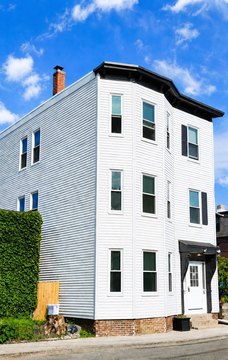
Renovated Triplex
For Sale
$1,749,000
16 Mitchell St, Boston, MA 02127
Renovated triplex with updated, bright living spaces, offering potential for further improvements.
Property Size2,262 SF
Price / SF$773.21
Days on Market94
Property Features for 16 Mitchell St
General Information
Standard status
Active
Size
2,262 SF
Property subtype
Multi-Family
Building Details
Year Built
1905
Listing Agency:
Greater Metropolitan R. E.
Listed By:
Ryan Foley · License #9043438
(617) 523-2505
Source:
Gooddeedsrealtypartners
Added: Jul 20
Changed: Oct 6
Last Checked: Oct 7 at 1:10PM
Displayed information is deemed reliable but is not guaranteed and should be independently verified. All listing content including descriptions, pricing, images are the copyrighted material of Greater Metropolitan R. E.

Ask AI about this property
Review the available facts, identify missing information and prepare questions for the agent.
Investment Insights
Based on property information with market context.
16 Mitchell Street is a triplex offering renovated, bright living spaces with thoughtful updates. The units are described as move-in ready, while still presenting opportunities for additional improvements to enhance income and overall performance.
The property is positioned in South Boston along the Andrew Square corridor, with proximity to the Washington Village development. That nearby redevelopment is intended to bring new residential housing, retail, public spaces, and infrastructure improvements to the area.
Additional upside is noted through potential in-unit enhancements such as adding central air. There is also a possibility to expand into the basement to capture additional space and support long-term value.
The property is positioned in South Boston along the Andrew Square corridor, with proximity to the Washington Village development. That nearby redevelopment is intended to bring new residential housing, retail, public spaces, and infrastructure improvements to the area.
Additional upside is noted through potential in-unit enhancements such as adding central air. There is also a possibility to expand into the basement to capture additional space and support long-term value.
Key Highlights
- 1905‑built renovated triplex with updated, bright living spaces
- Move‑in ready units with strong rental appeal, with further value‑add potential
- Potential to add central‑air to help increase rental income and asset value
Financial Insights
Estimated NOI and Cap Rate
NOI / Yr
$57,159
Cap Rate
3.27%
Suggested Prices Based on Cap Rates
Cap Rate 5%
$1,143,180
$1.1M
Cap Rate 7%
$816,557
$816.6K
Cap Rate 9%
$635,100
$635.1K
Market Conditions
NOI Build-Up for 2,262 SF
Gross rent
$85.5K $37.80/SF
− Vacancy
−$3.8K −$1.70/SF
EGI
$81.7K $36.10/SF
− OpEx
−$24.5K −$10.83/SF
NOI
$57.2K $25.27/SF
Area
Boston, MA
Vacancy
4.50%
Lease Rate
$37.80 /SF/Yr
Expense Ratio
30.00%
Simulate Cap Rate and NOI
Suggested Prices Based on Cap Rates
Cap Rate 5%
$1,143,180
Cap Rate 7%
$816,557
Cap Rate 9%
$635,100
Alternative Uses
Best Use
Multifamily LT 5
$816.6K
$714.5K – $952.7K
NOI $57,159 @ 7.0% cap · market cap 3.27%
Second Best
Apartment 5plus
$759.1K
$664.2K – $885.7K
NOI $53,139 @ 7.0% cap · market cap 3.04%
Theoretical Best
Office A
$1.69M
$1.48M – $1.98M
NOI $118,565 @ 7.0% cap · market cap 6.78%
Zoning and permitted uses should be independently verified with authorities.
How Realmo checks its estimates
Property Analytics
Unlock full access to Insights
Subscribe to Realmo Intelligence
Open Analytics
Location Intelligence
Trade Area within ½ mile
1,788
Businesses Nearby
Explore this area
Business Placement
Demographics for 02127, MA
37,939
Population
19,495
Households
1.9
Avg Household Size
31
Median Age
69%
College-Educated
95%
High-School Grad
2.1 sq mi
ZIP Area
18,066
Density / Sq Mi
$156,373
Median Household Income
$85,444
Median Earnings
$2,435
Median Rent
$858,600
Median Home Value
Check the figures for this property
Cap Rate, Value Estimation, Potential NOI and more
View Realmo Analytics
Market
Vacancy Rate% for Multifamily in Northeast region




Frequently Asked Questions
What type of property is this?
Triplex - Renovated triplex with updated, bright living spaces, offering potential for further improvements.
Where is this triplex located?
The property is located at 16 Mitchell St Boston, MA.
What is the asking price?
The asking price for this property is $1,749,000.
What are key features of this property?
This property features: 1905‑built renovated triplex with updated, bright living spaces; Move‑in ready units with strong rental appeal, with further value‑add potential; Potential to add central‑air to help increase rental income and asset value


