Industrial Flex Building with
For Sale
$299,000
Pending
16 Market Street, Scotia, NY 12302
Commercial Sale, Scotia, NY
Property Size1,394 SF
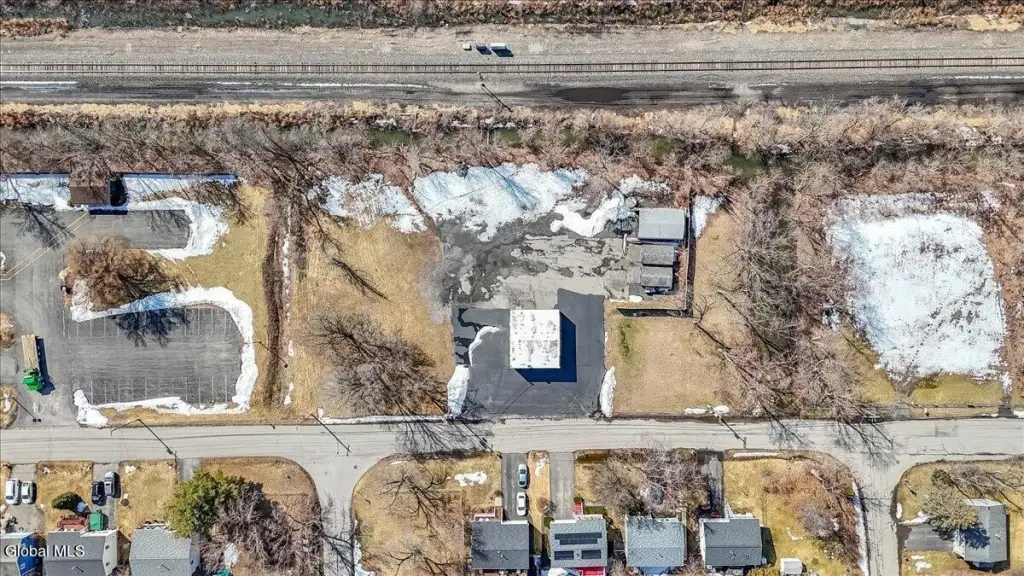
Lot Size0.96 Acres
Days on Market48
Property Features for 16 Market Street
General Information
Property type
Commercial Sale
Property subtype
Other
Zoning
Industrial
Parking
10
Security features
Security System
Lot features
Level, Cleared
High school
Scotia-Glenville
Elementary school district
Scotia Glenville
Middle school district
Scotia Glenville
High school district
Scotia Glenville
Directions
Banker, to Uncas to Parkland to Market.
Standard status
Pending
APN
422201 29.68-1-14
Size
1,394 SF
Lot size
0.96 Acres
Taxes and HOA fees
Tax Annual Amount
3871
Utilities
Sewer type
Public Sewer
Heating system
Natural Gas
Cooling system
Window Unit(s)
Water source
Public
Amenities
WiFi
security system
Building Details
Year built
1955
Floors in Building
1
Flooring type
Concrete
Building materials
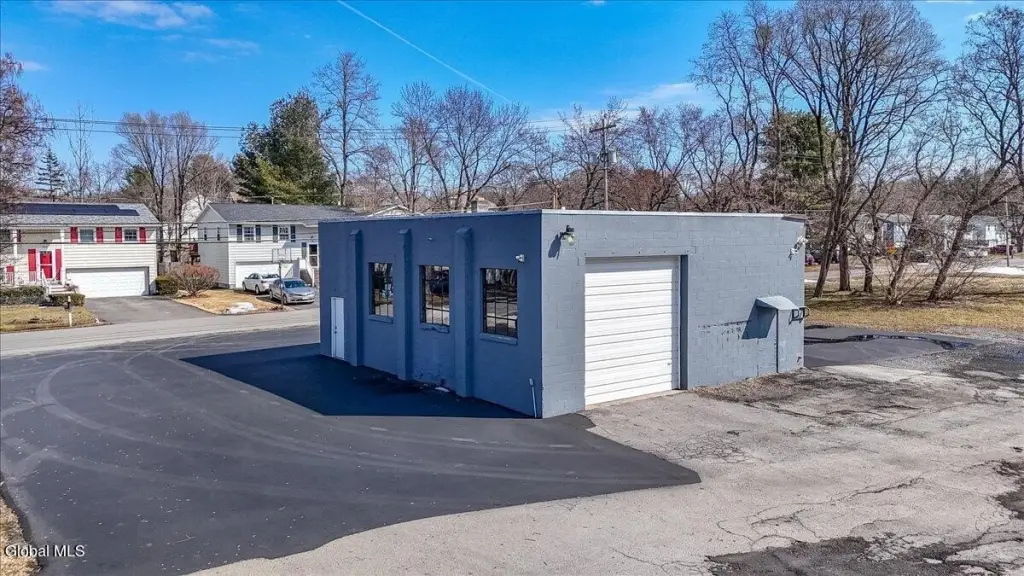
Block
Roof type
Rubber
Listing Agency:
KW Platform · Keller Williams Realty
(518) 724-5800
Listed By:
Christopher Iwinski · License #10401237144
(518) 405-6888
Added: Aug 21
Changed: Sep 16
Last Checked: Oct 7 at 4:06PM
MLS# 202624577
Copyright © 2026 Global MLS, Inc. All rights reserved. All information provided by the listing agent/broker is deemed reliable but is not guaranteed and should be independently verified.
Investment Insights
Based on property information with market context.
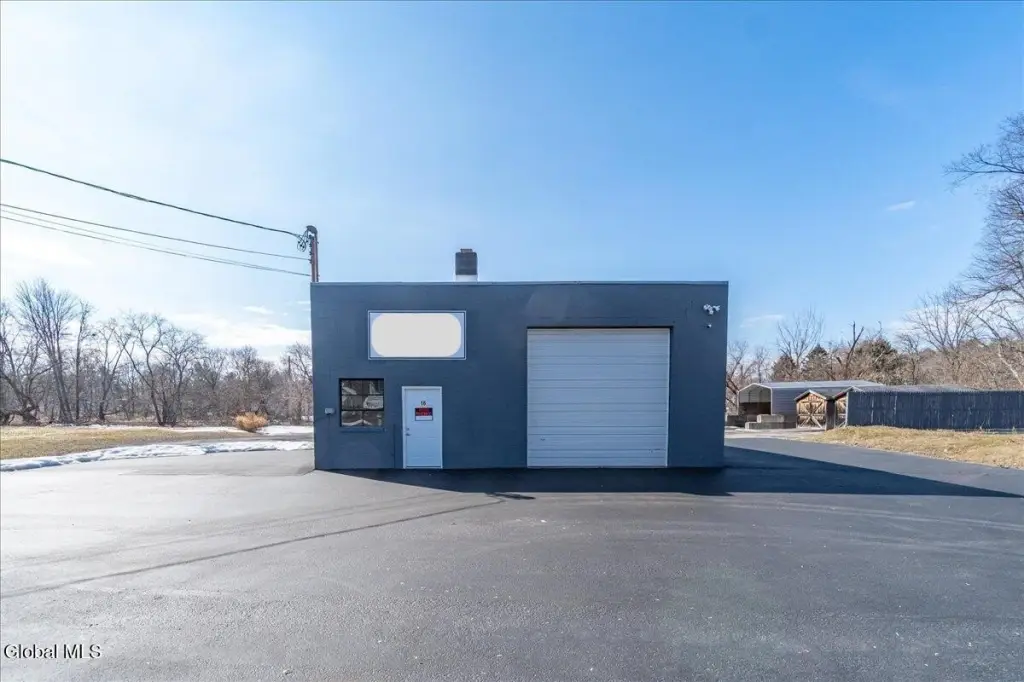
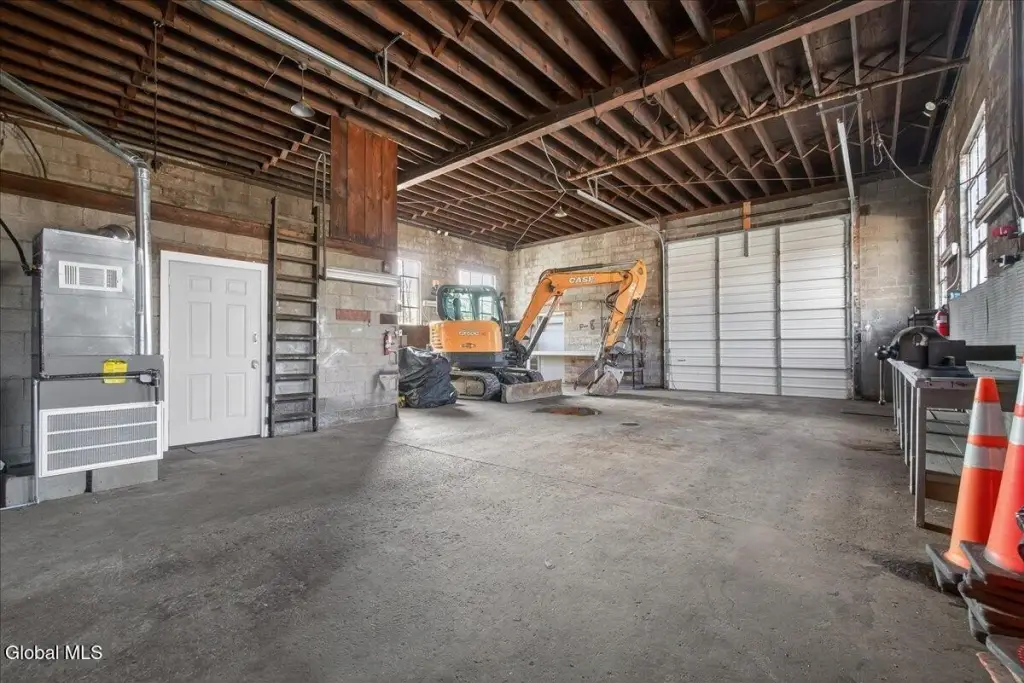
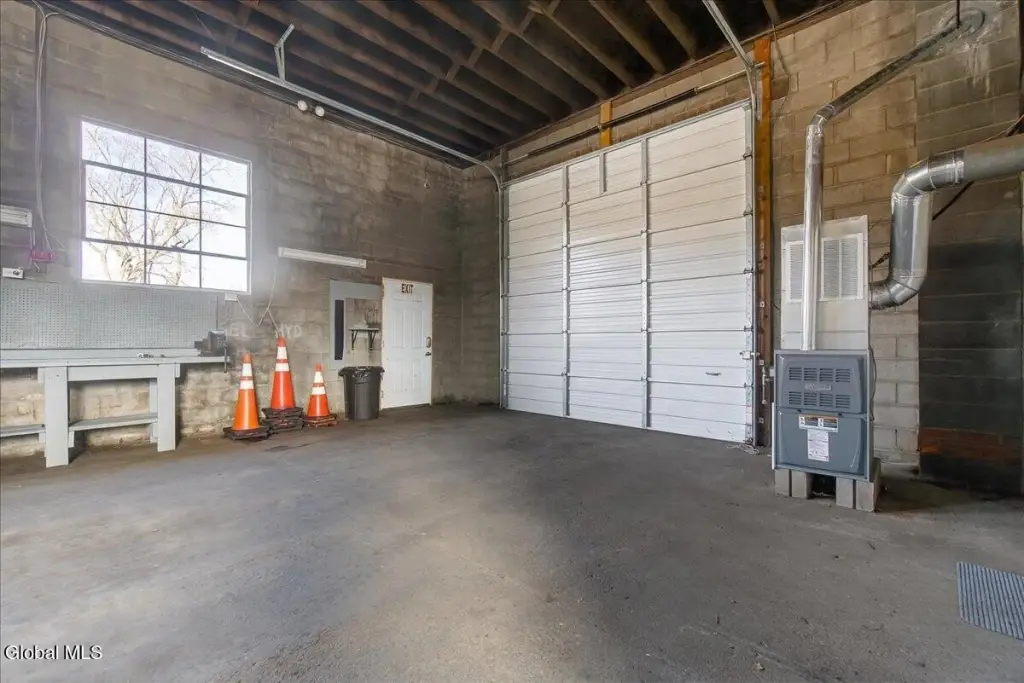
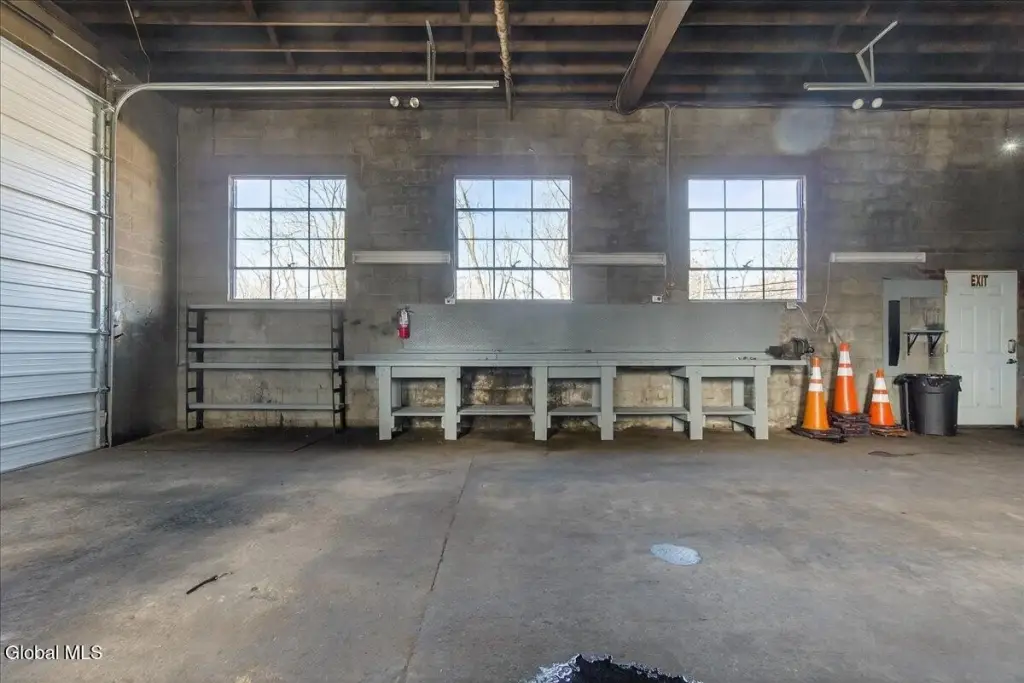
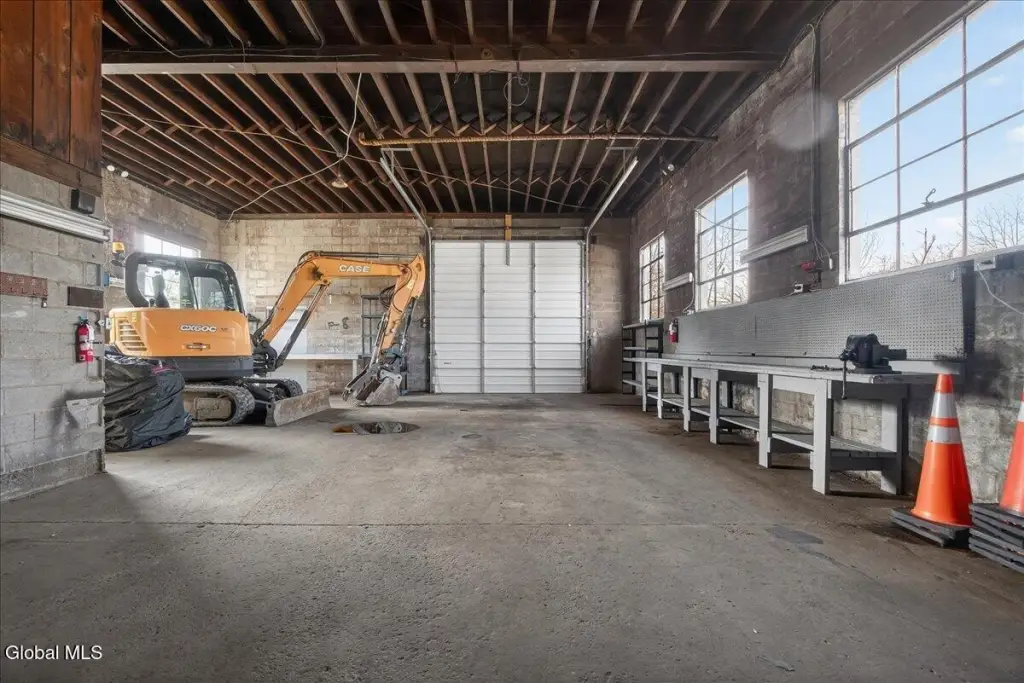
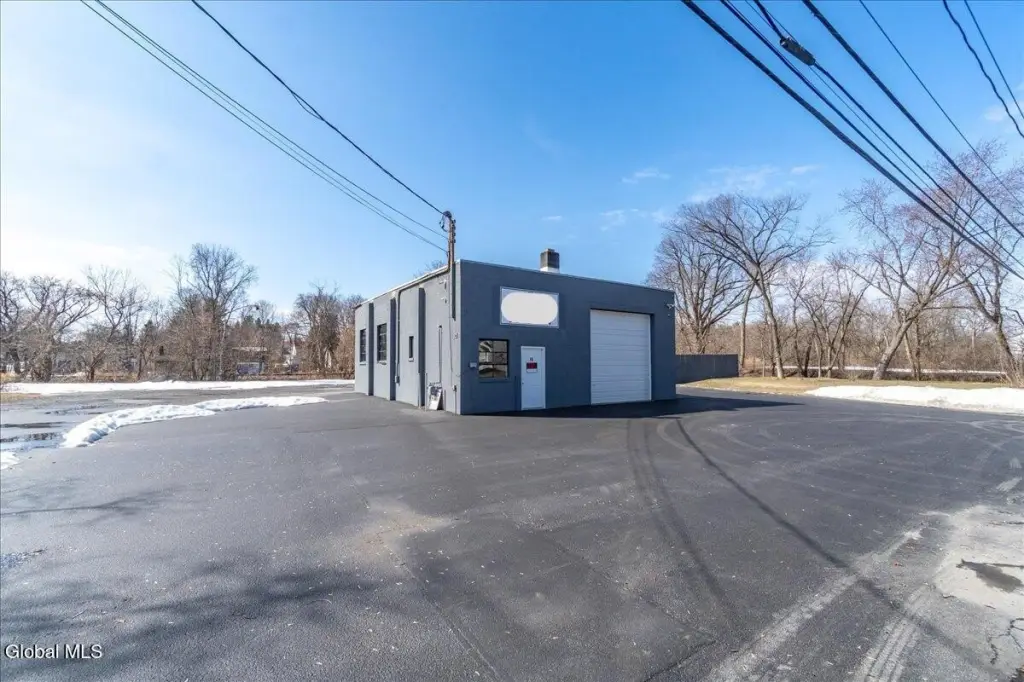
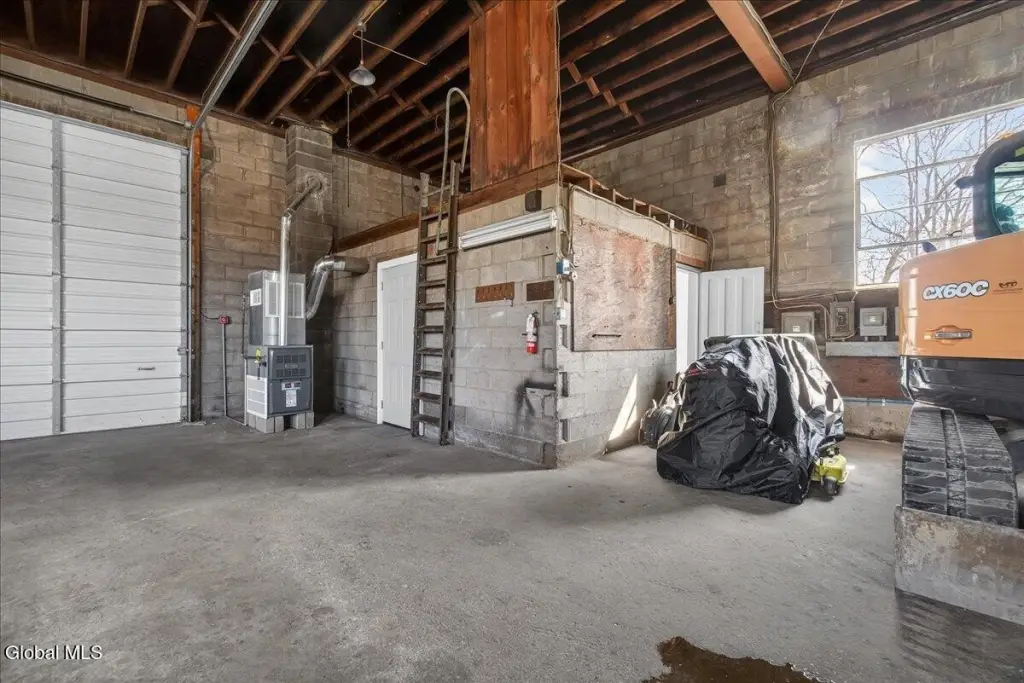
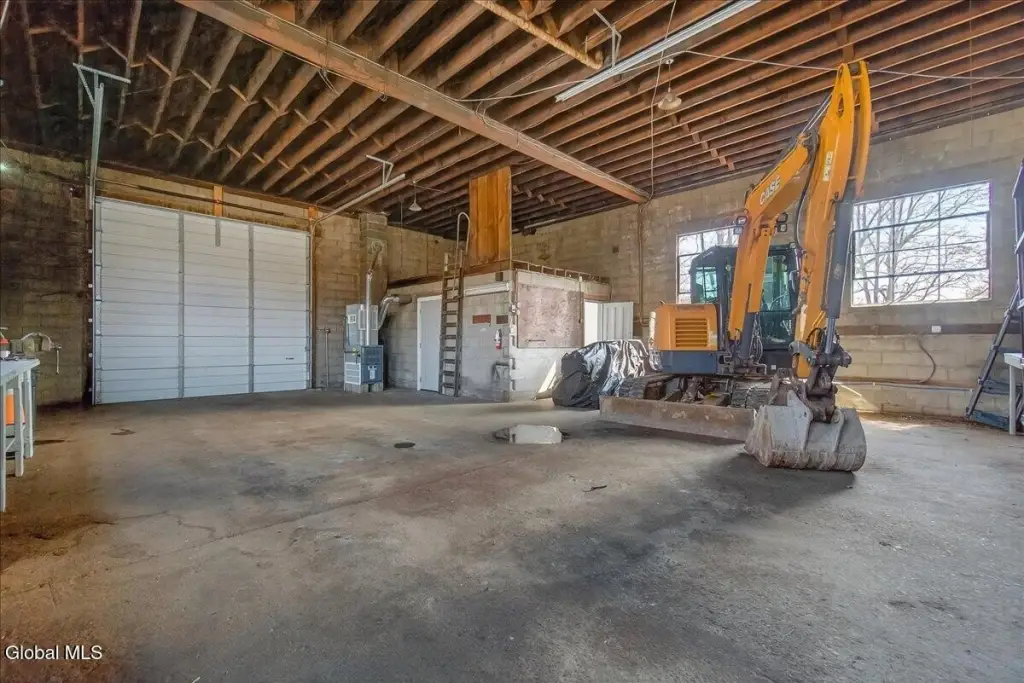
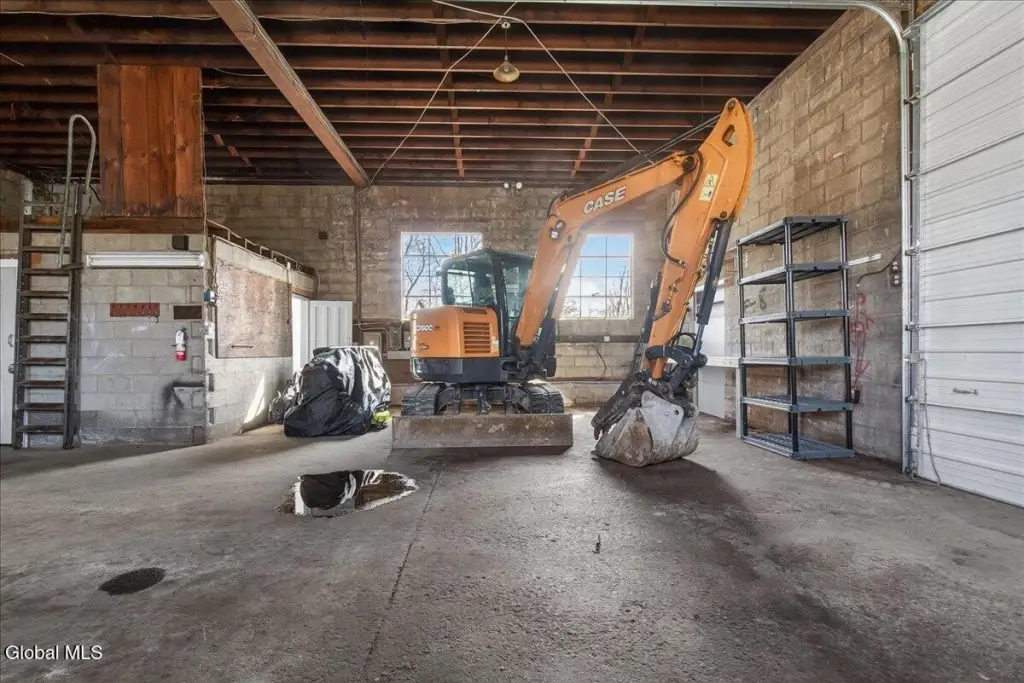
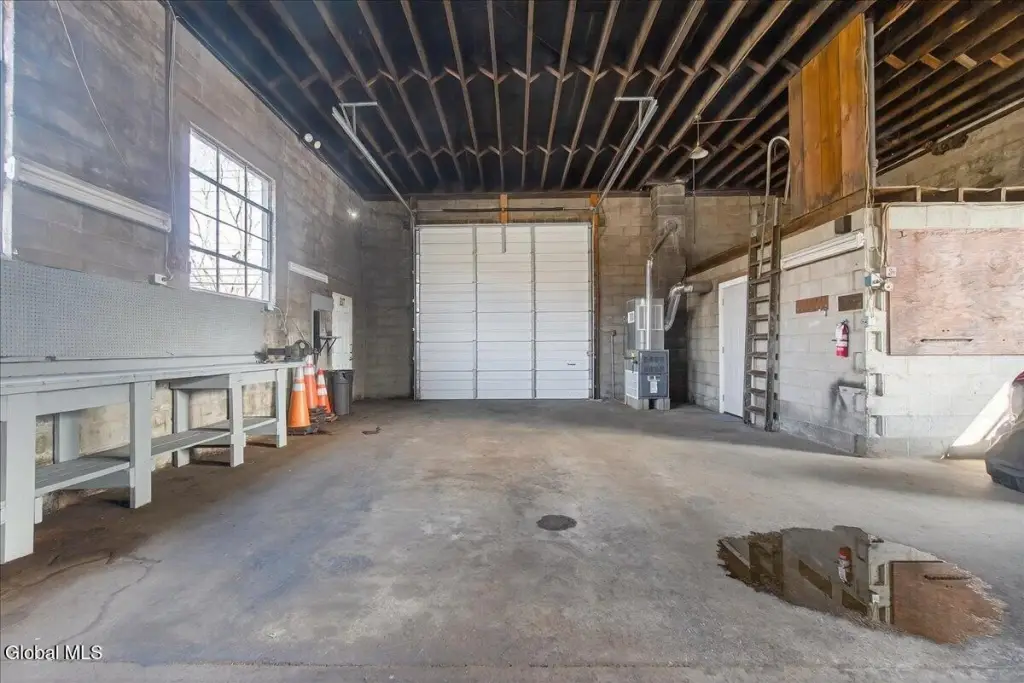
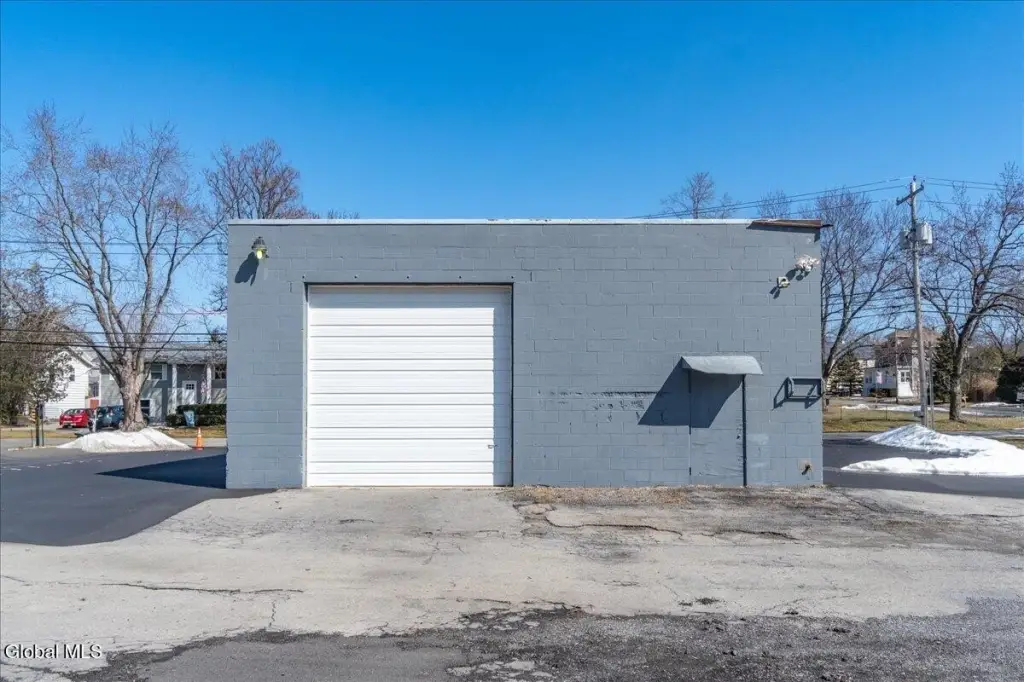
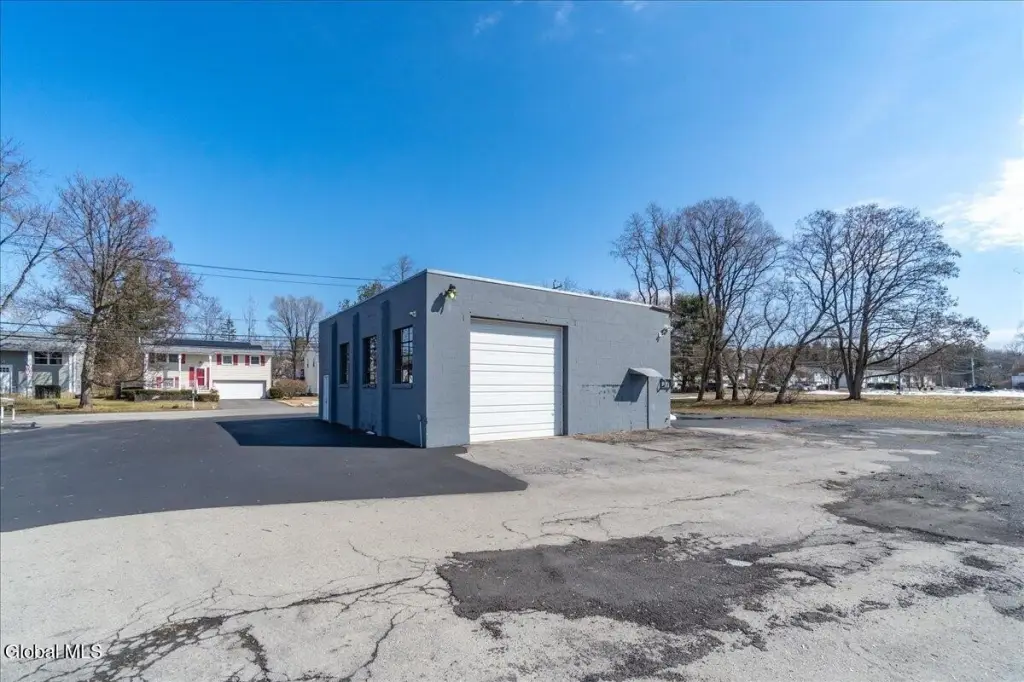
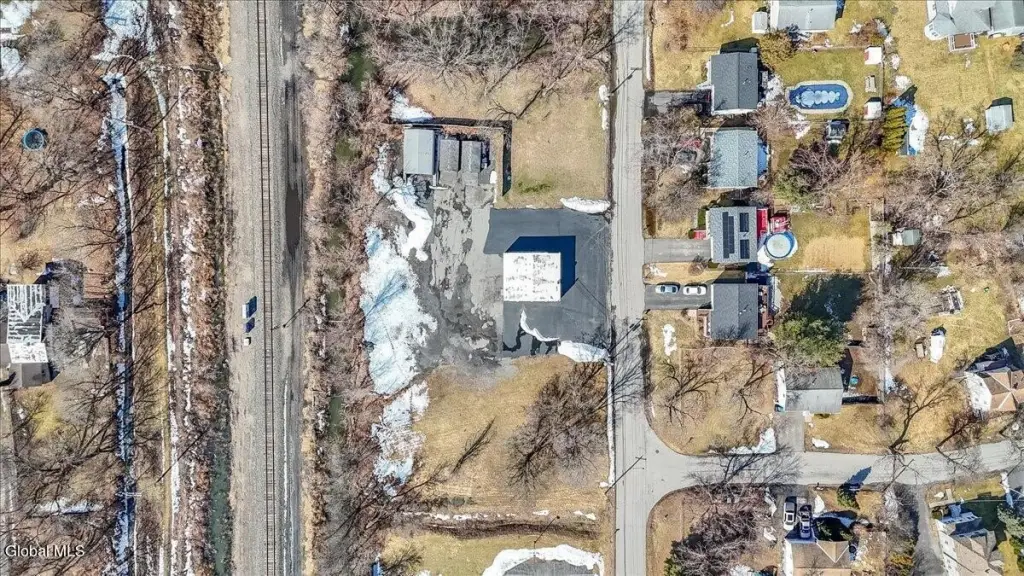
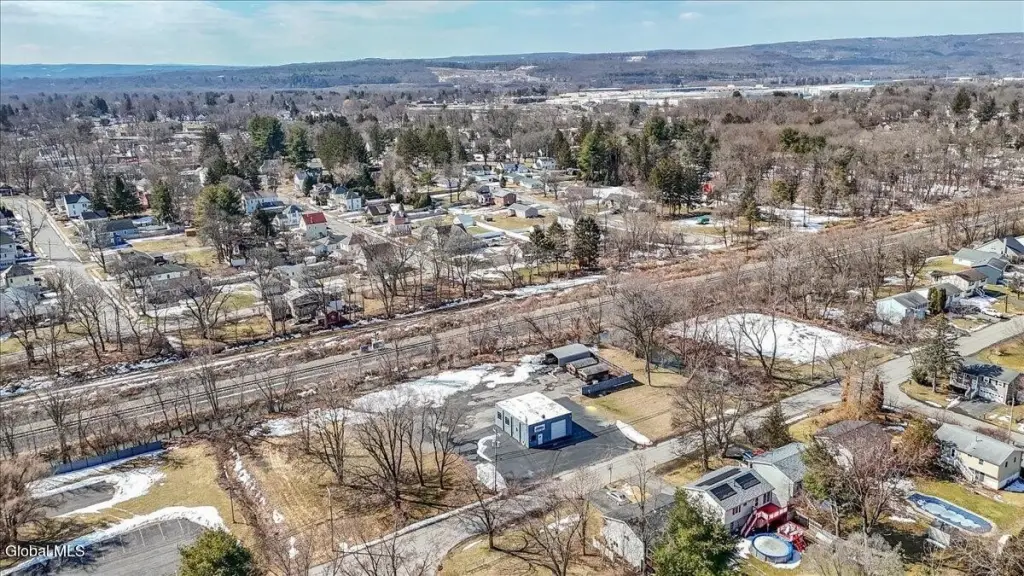
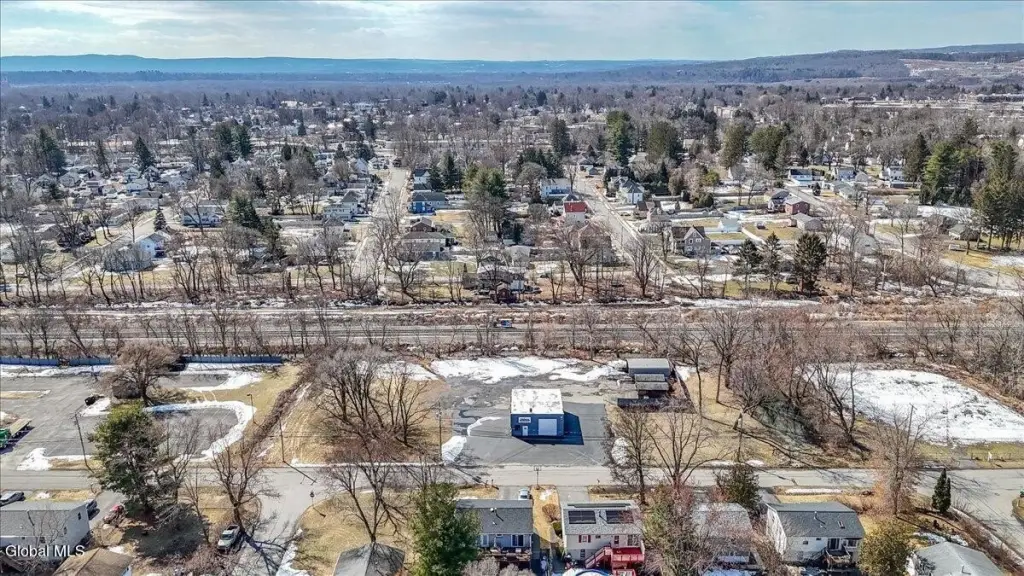
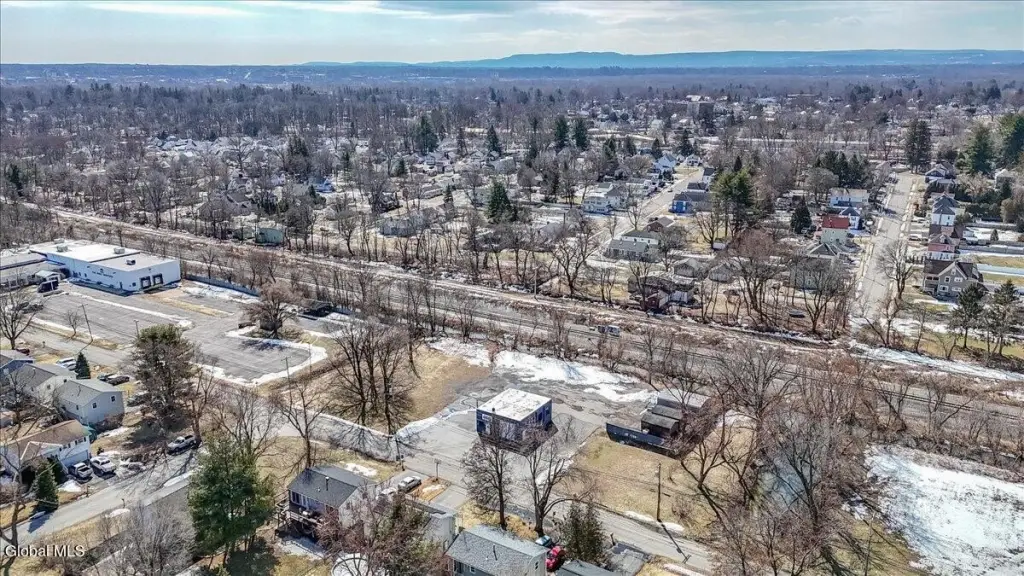
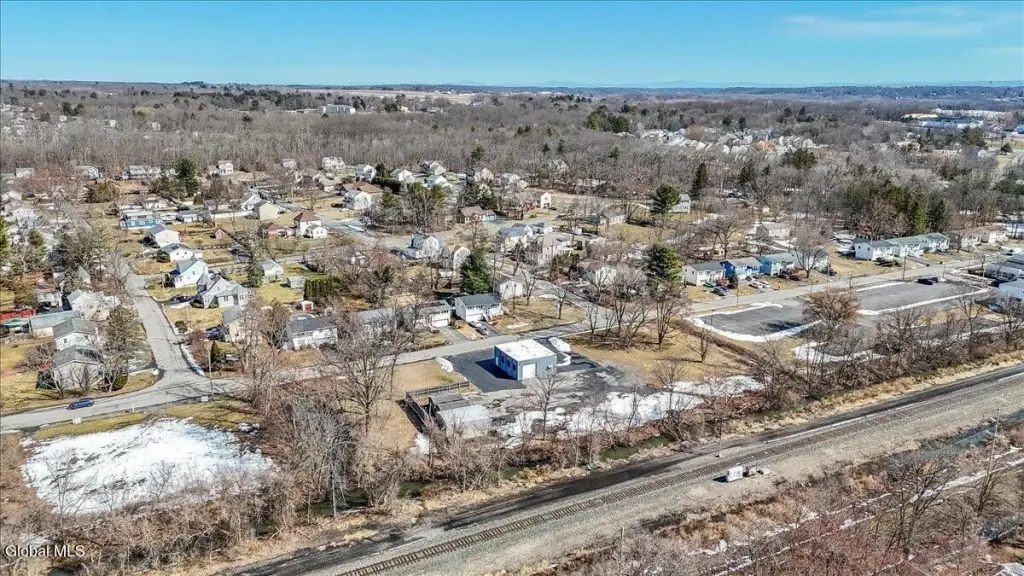
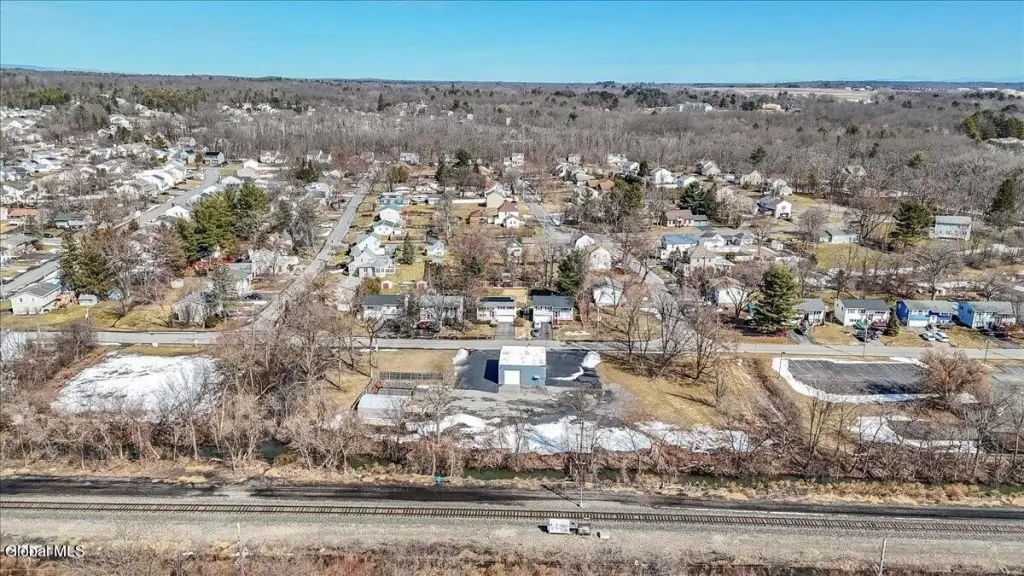
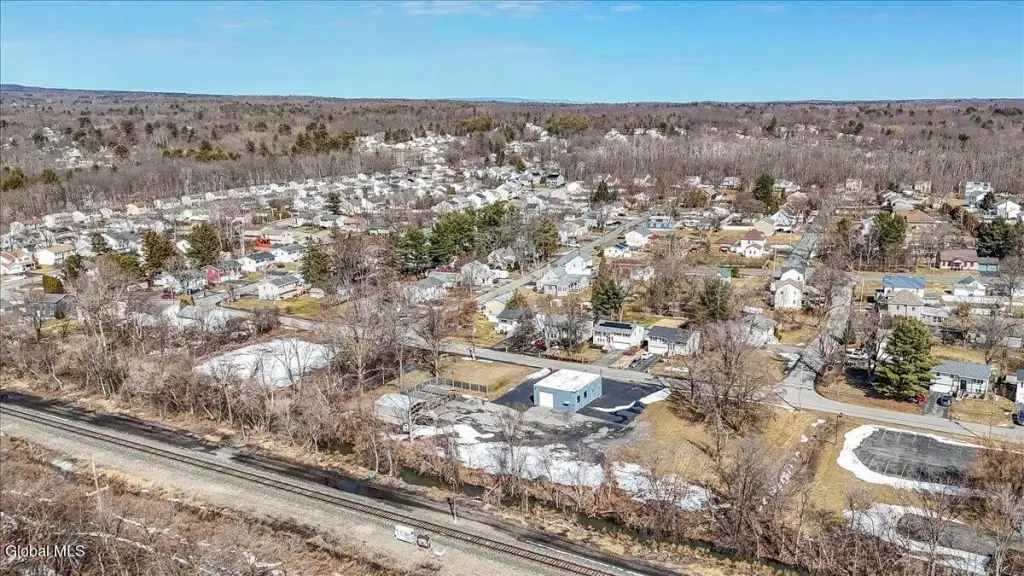
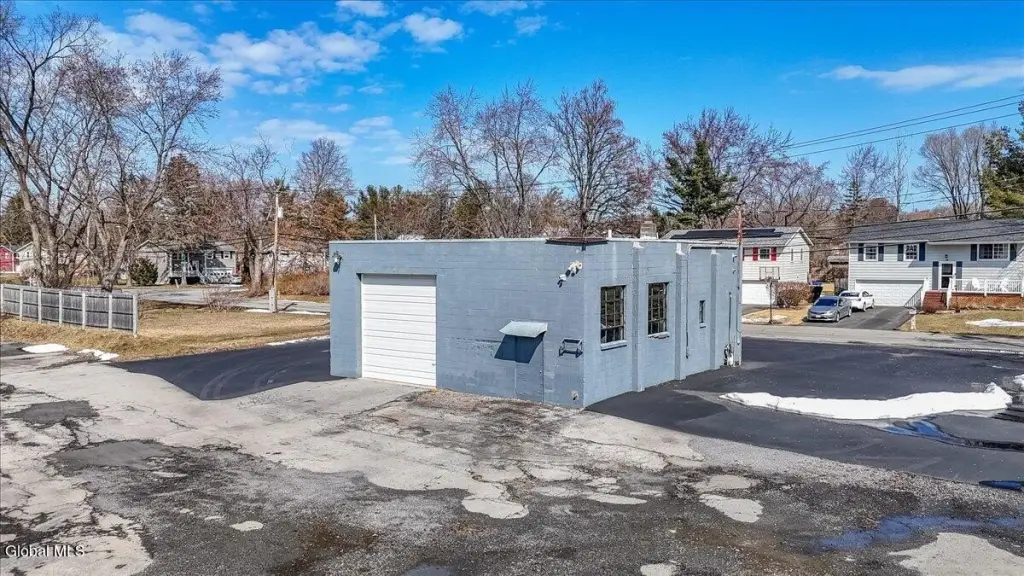
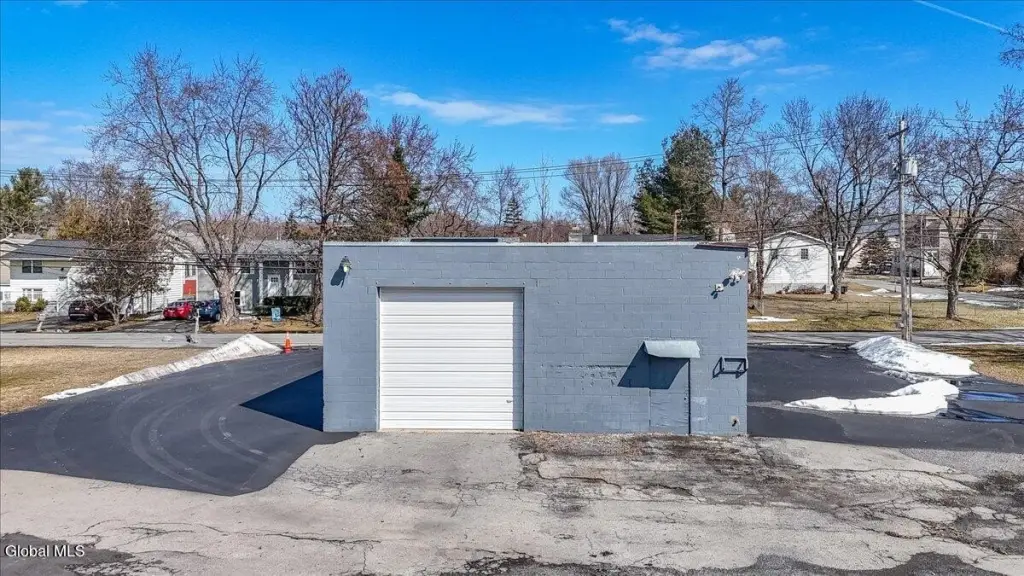
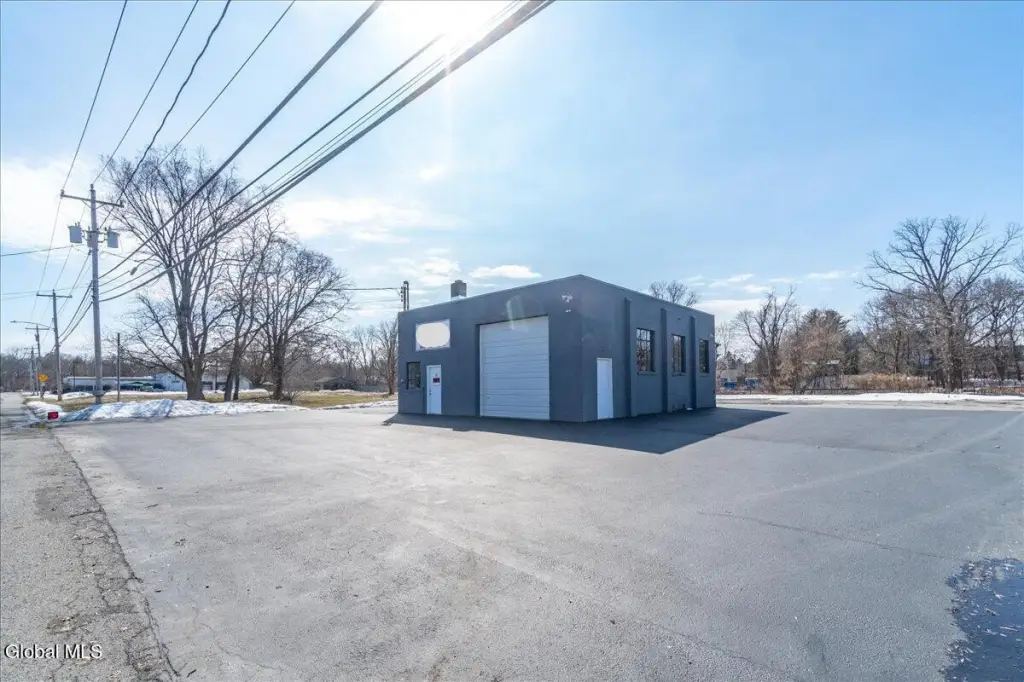
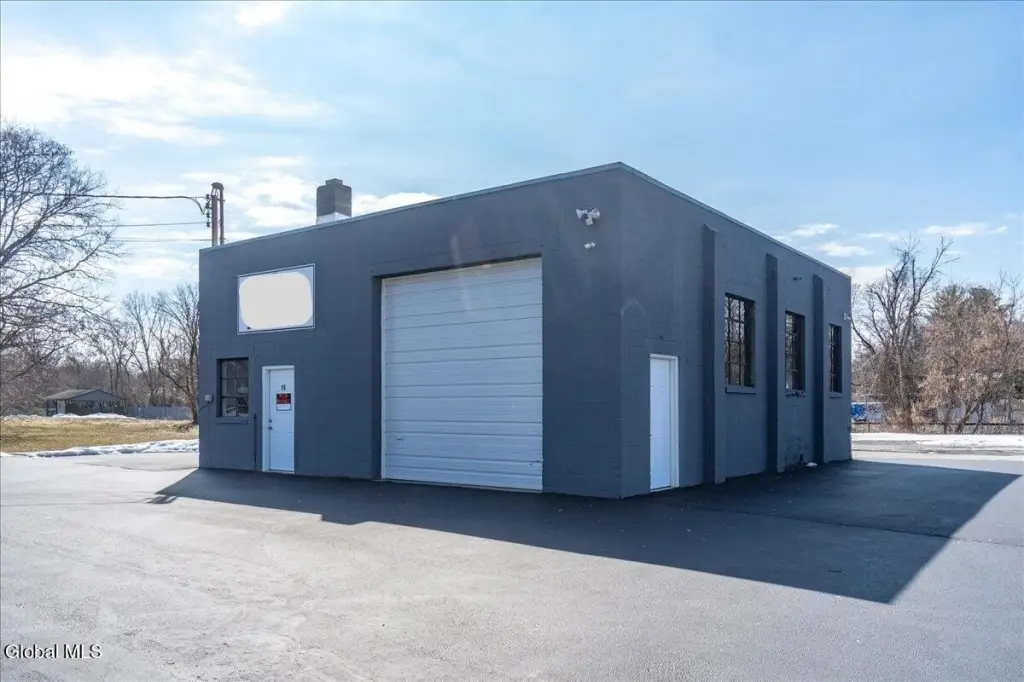
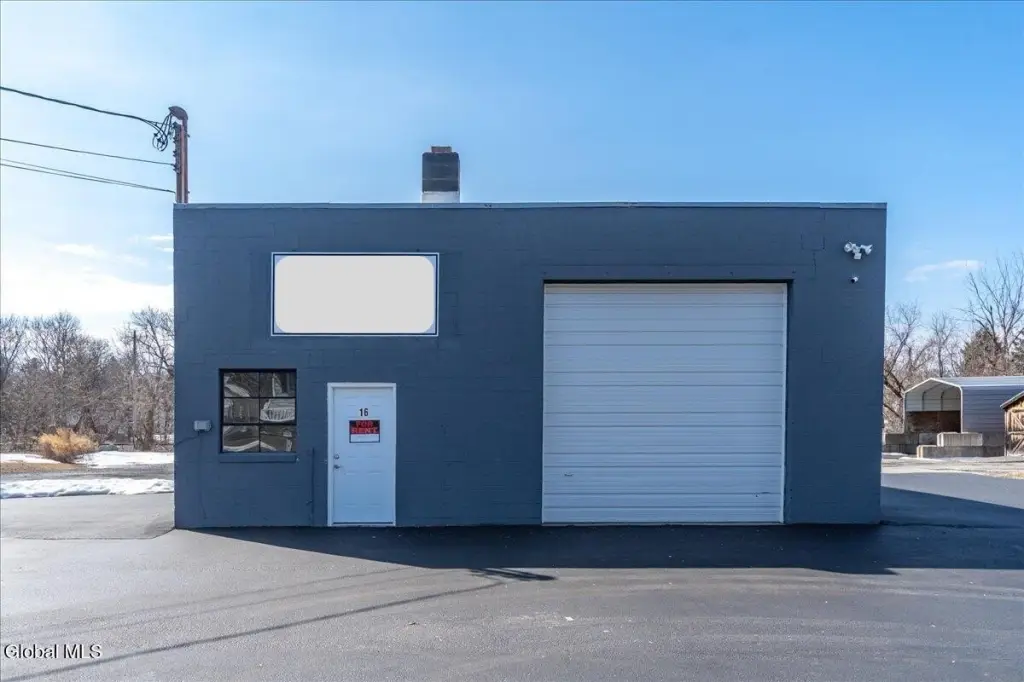
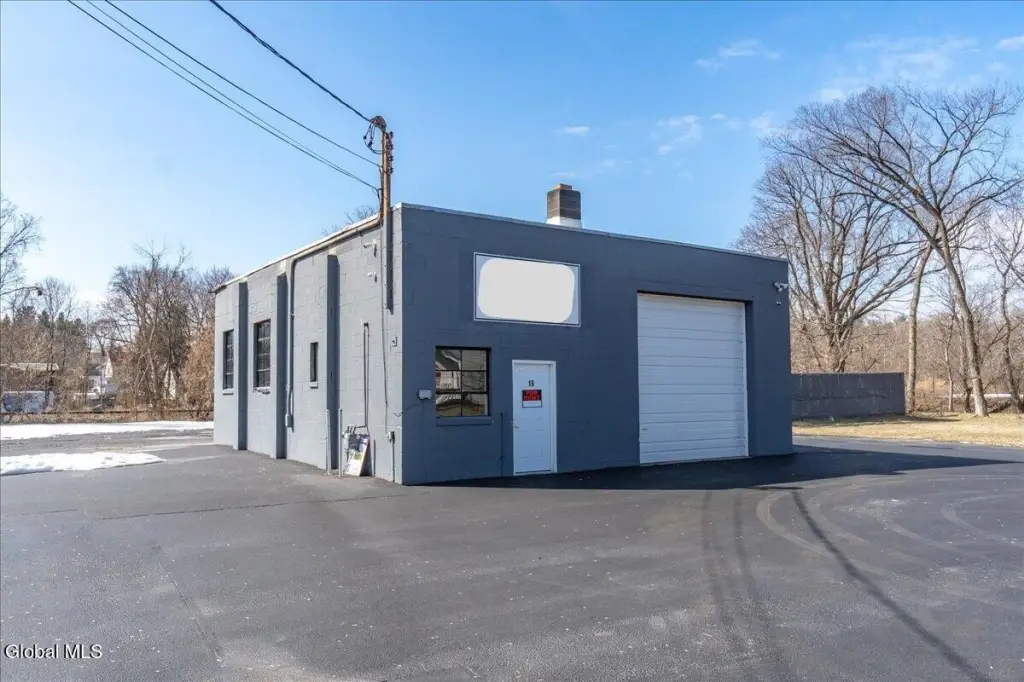
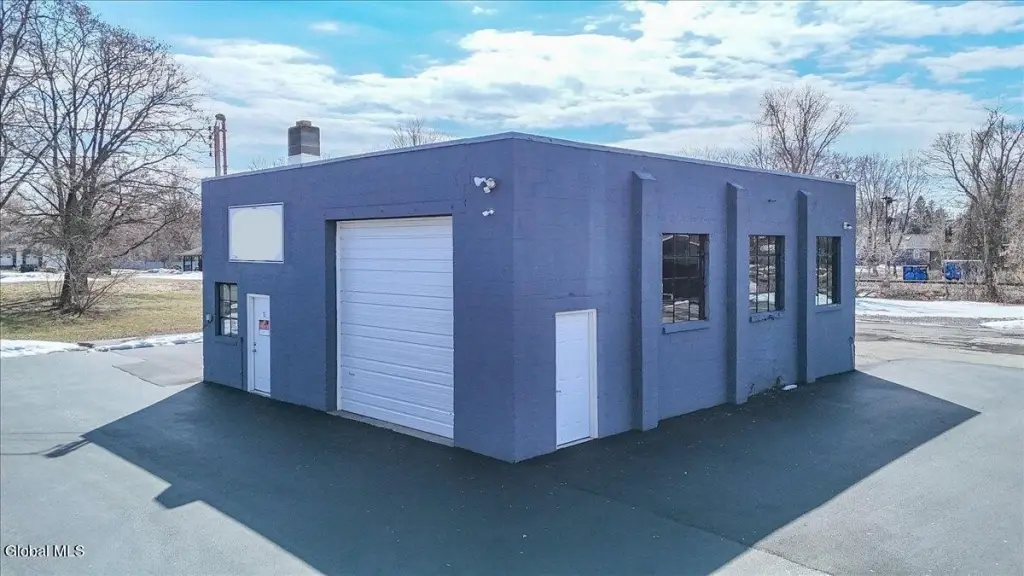
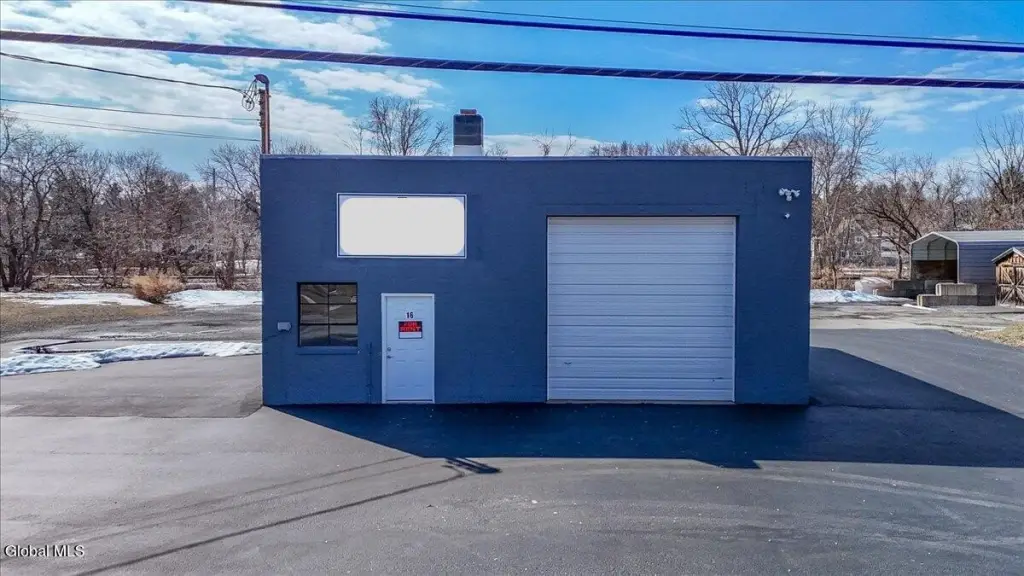
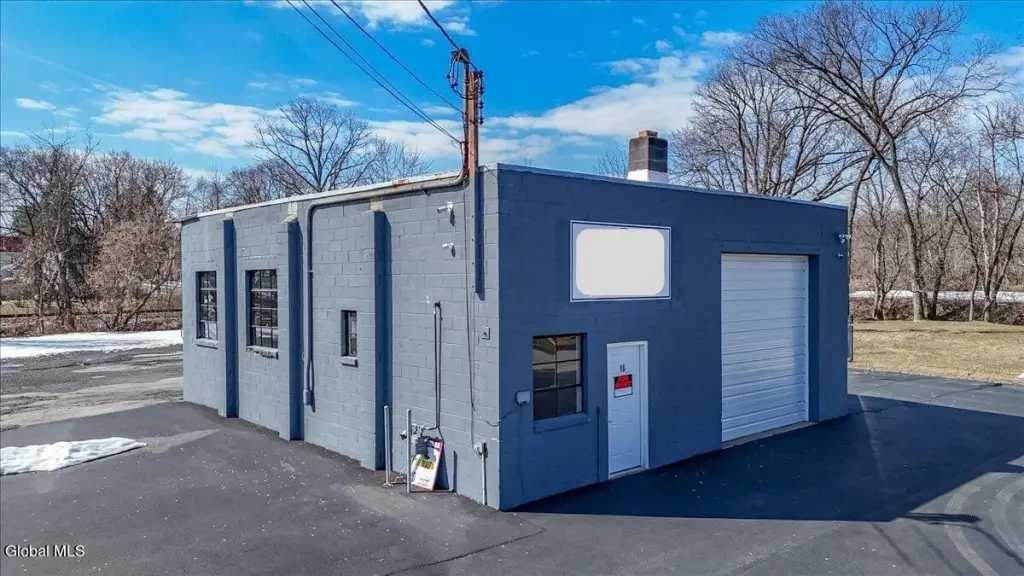
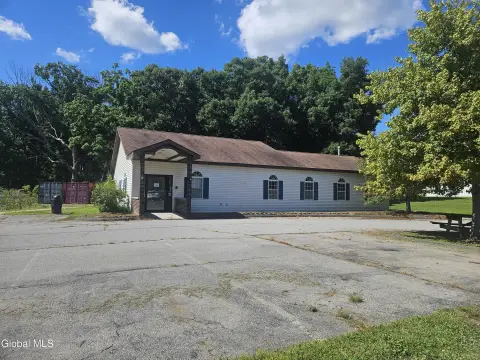
This 1,394-square-foot industrial flex building on 0.96 acres includes a spacious work area, private office, two bathrooms, and one shed. Two 14-foot overhead doors support access for vehicles and equipment, while 440 electrical service serves operational needs. The building has block construction, concrete flooring, a rubber roof, natural gas heat, window-unit cooling, public water, and public sewer.
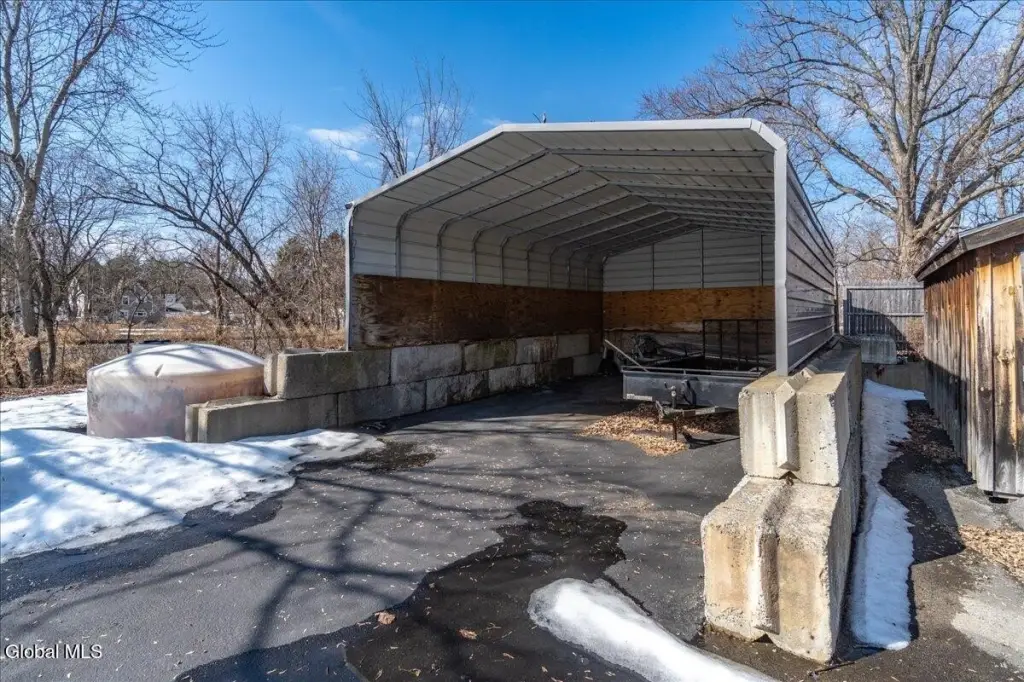
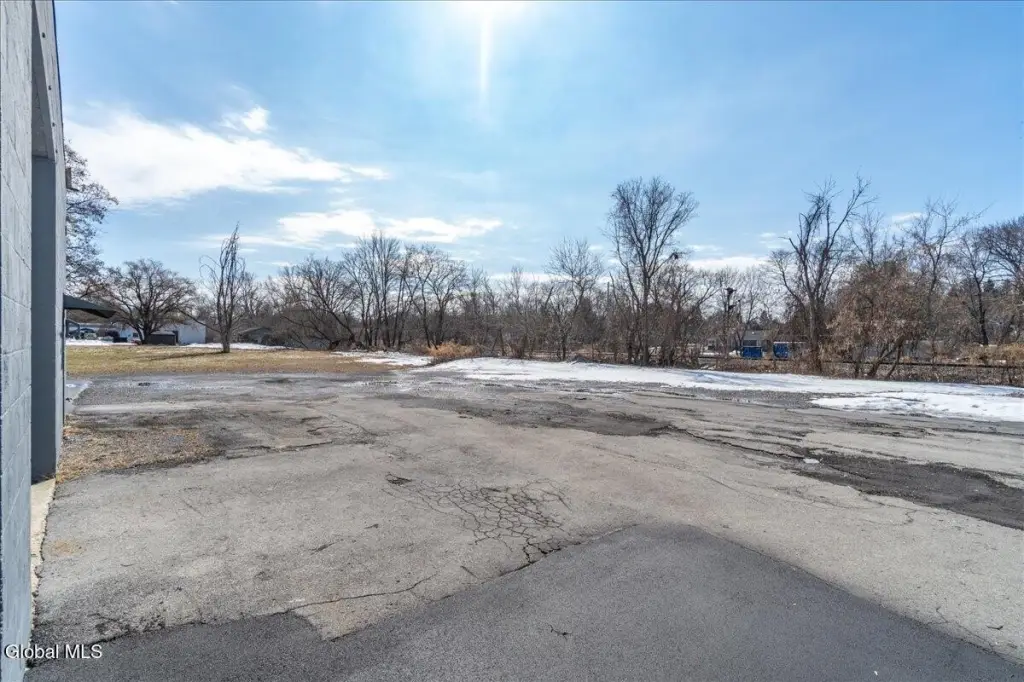
Recent improvements include a new gas furnace, new windows, and a new roof. Exterior parking and yard space provide room for maneuvering trucks, trailers, and equipment. The property is zoned Industrial and was built in 1955.
Recent improvements include a new gas furnace, new windows, and a new roof. Exterior parking and yard space provide room for maneuvering trucks, trailers, and equipment. The property is zoned Industrial and was built in 1955.
Key Highlights
- 1,394‑square‑foot industrial flex building on 0.96 acres
- Two 14‑foot overhead doors for vehicle and equipment access
- 440 electrical service with a spacious work area
Financial Insights
Estimated NOI and Cap Rate
NOI / Yr
$10,469
Cap Rate
3.50%
Suggested Prices Based on Cap Rates
Cap Rate 5%
$209,380
$209.4K
Cap Rate 7%
$149,557
$149.6K
Cap Rate 9%
$116,322
$116.3K
Market Conditions
NOI Build-Up for 1,394 SF
Gross rent
$13.2K $9.48/SF
− Vacancy
−$899 −$0.64/SF
EGI
$12.3K $8.84/SF
− OpEx
−$1.8K −$1.33/SF
NOI
$10.5K $7.51/SF
Area
Schenectady County, NY
Vacancy
6.80%
Lease Rate
$9.48 /SF/Yr
Expense Ratio
15.00%
Simulate Cap Rate and NOI
Suggested Prices Based on Cap Rates
Cap Rate 5%
$209,380
Cap Rate 7%
$149,557
Cap Rate 9%
$116,322
Alternative Uses
Best Use
Warehouse
$149.6K
$130.9K – $174.5K
NOI $10,469 @ 7.0% cap · market cap 3.50%
Second Best
Industrial
$123.2K
$107.8K – $143.7K
NOI $8,622 @ 7.0% cap · market cap 2.88%
Theoretical Best
Office A
$417.2K
$365.1K – $486.8K
NOI $29,207 @ 7.0% cap · market cap 9.77%
Zoning and permitted uses should be independently verified with authorities.
Property Analytics
Unlock full access to Insights
Subscribe to Realmo Intelligence
Open Analytics
Current Use
Location Intelligence
Trade Area within ½ mile
48
Businesses Nearby
Well-served
Demand for This Use
Explore this area
Business Placement
Demographics for 12302, NY
27,618
Population
12,406
Households
2.2
Avg Household Size
45
Median Age
42%
College-Educated
95%
High-School Grad
43.3 sq mi
ZIP Area
638
Density / Sq Mi
$94,156
Median Household Income
$55,305
Median Earnings
$1,207
Median Rent
$240,700
Median Home Value
Check the figures for this property
Cap Rate, Value Estimation, Potential NOI and more
View Realmo Analytics
Market
Vacancy Rate% for Industrial in Northeast region

Questions? Ask Rey
Realmo’s AI knows this listing — price, zoning, demand, history. Ask anything.


Frequently Asked Questions
What type of property is this?
Flex space - Functional commercial space with overhead doors, office areas, utility service, and exterior room for trucks, trailers, and equipment.
Where is this flex space located?
The property is located at 16 Market Street Scotia, NY.
What is the asking price?
The asking price for this property is $299,000.
What are key features of this property?
This property features: 1,394‑square‑foot industrial flex building on 0.96 acres; Two 14‑foot overhead doors for vehicle and equipment access; 440 electrical service with a spacious work area



