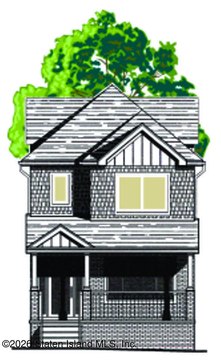
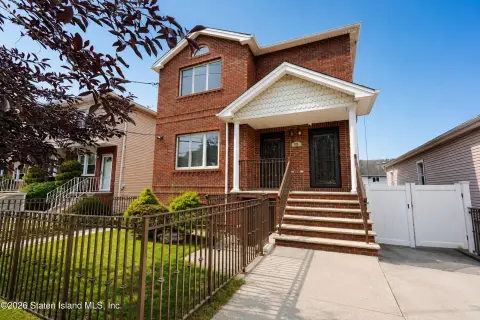
Side-Hall Colonial
For Sale
Contact for pricing
Pending
155 Waterbury Avenue A, Staten Island, NY 10309
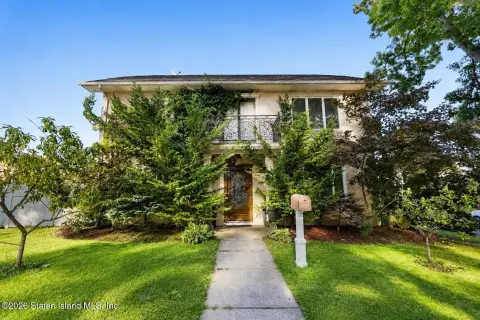
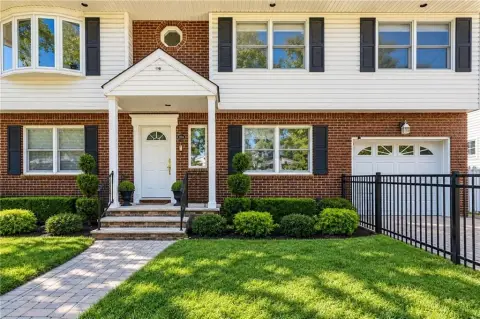
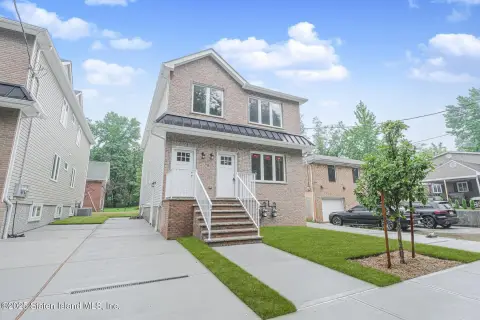
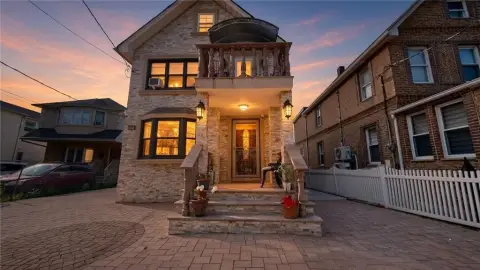
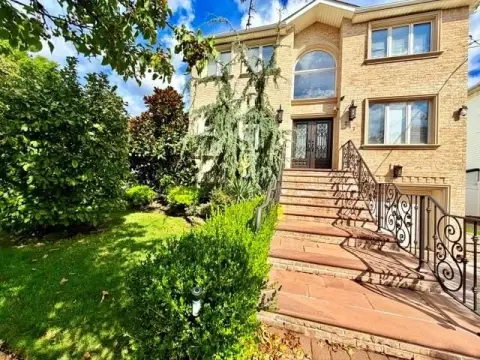
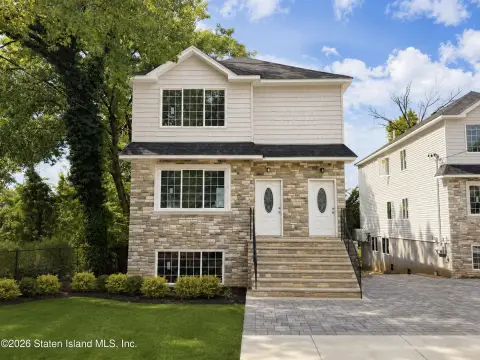
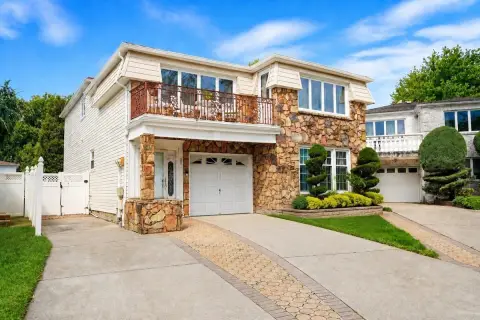
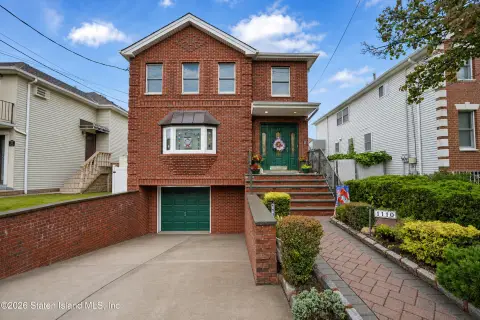
A meticulously maintained two-family home with spacious bedrooms, custom features, and flexible lower-level apartment options.
Property Size2,700 SF
Days on Market115
Property Features for 155 Waterbury Avenue A
General Information
Standard status
Pending
Size
2,700 SF
Property subtype
Multifamily
Zoning
R3X
Additional Details
Multifamily Units
2
Building Details
Year Built
2009
Stories
2
Units
2
Tenancy
Multi
Listing Agency:
NEUHAUS REALTY INC.
Listed By:
Gaetano Marasa · License #NY
(732) 946-2911
Source:
Crexi
Added: Jun 21
Changed: Oct 2
Last Checked: Oct 12 at 5:20PM
Displayed information is deemed reliable but is not guaranteed and should be independently verified. All listing content including descriptions, pricing, images are the copyrighted material of NEUHAUS REALTY INC.
Investment Insights
Based on property information with market context.
This side-hall colonial duplex offers a fully customized, better-than-new interior with multiple living levels. The first floor features a two-story entry foyer, formal dining room, living room, custom eat-in kitchen with stainless steel appliances and island, family room with fireplace, a half bath, and sliders to a maintenance-free yard. On the second level, you’ll find four spacious bedrooms, two full baths, and a primary suite with a walk-in closet and private bath. Attic access provides additional storage.
The lower level includes the garage, one large room that can be added as a second bedroom for the apartment, a three-quarter bath, and utilities. A separate large one-bedroom apartment is already located on the lower level and may be converted into a two-bedroom layout. Custom moldings throughout and high-end fixtures support a turn-key feel throughout the home.
Located in Prince’s Bay, the property is described as steps to shopping, transportation, and schools, making it convenient for both owner-occupants and tenants. With its multi-level configuration and described conversion potential, the home can fit a range of household needs while retaining separate living spaces for a two-family arrangement.
The lower level includes the garage, one large room that can be added as a second bedroom for the apartment, a three-quarter bath, and utilities. A separate large one-bedroom apartment is already located on the lower level and may be converted into a two-bedroom layout. Custom moldings throughout and high-end fixtures support a turn-key feel throughout the home.
Located in Prince’s Bay, the property is described as steps to shopping, transportation, and schools, making it convenient for both owner-occupants and tenants. With its multi-level configuration and described conversion potential, the home can fit a range of household needs while retaining separate living spaces for a two-family arrangement.
Key Highlights
- Year built 2009: meticulously maintained two‑family side‑hall colonial with custom features and high‑end fixtures
- 6 bedrooms and 5 bathrooms total, including a 4‑bedroom main level with master suite featuring a walk‑in closet and private full bath
- First floor offers a 2‑story entry foyer, formal dining room, living room, custom EIK with stainless steel appliances and island, plus a family room with fireplace
Financial Insights
Estimated NOI and Cap Rate
NOI / Yr
$67,144
Cap Rate
4.97%
Suggested Prices Based on Cap Rates
Cap Rate 5%
$1,342,880
$1.3M
Cap Rate 7%
$959,200
$959.2K
Cap Rate 9%
$746,044
$746.0K
Market Conditions
NOI Build-Up for 2,700 SF
Gross rent
$100.4K $37.20/SF
− Vacancy
−$4.5K −$1.67/SF
EGI
$95.9K $35.53/SF
− OpEx
−$28.8K −$10.66/SF
NOI
$67.1K $24.87/SF
Area
Staten Island, NY
Vacancy
4.50%
Lease Rate
$37.20 /SF/Yr
Expense Ratio
30.00%
Simulate Cap Rate and NOI
Suggested Prices Based on Cap Rates
Cap Rate 5%
$1,342,880
Cap Rate 7%
$959,200
Cap Rate 9%
$746,044
Alternative Uses
Best Use
Multifamily LT 5
$959.2K
$839.3K – $1.12M
NOI $67,144 @ 7.0% cap · market cap 4.97%
Second Best
Apartment 5plus
$855.4K
$748.4K – $997.9K
NOI $59,875 @ 7.0% cap · market cap 4.44%
Theoretical Best
Office A
$1.29M
$1.13M – $1.50M
NOI $90,181 @ 7.0% cap · market cap 6.68%
Zoning and permitted uses should be independently verified with authorities.
How Realmo checks its estimates
Property Analytics
Unlock full access to Insights
Subscribe to Realmo Intelligence
Open Analytics
Current Use
Lease Details
2
Residential units
Multi-tenant
Tenancy
Location Intelligence
Trade Area within ½ mile
528
Businesses Nearby
Explore this area
Business Placement
Demographics for 10309, NY
33,523
Population
12,770
Households
2.6
Avg Household Size
41
Median Age
40%
College-Educated
92%
High-School Grad
7.3 sq mi
ZIP Area
4,592
Density / Sq Mi
$123,638
Median Household Income
$67,348
Median Earnings
$1,907
Median Rent
$745,500
Median Home Value
Check the figures for this property
Cap Rate, Value Estimation, Potential NOI and more
View Realmo Analytics
Market
Vacancy Rate% for Multifamily in Northeast region

Questions? Ask Rey
Realmo’s AI knows this listing — price, zoning, demand, history. Ask anything.
Frequently Asked Questions
What type of property is this?
Duplex - A meticulously maintained two-family home with spacious bedrooms, custom features, and flexible lower-level apartment options.
Where is this duplex located?
The property is located at 155 Waterbury Avenue A Staten Island, NY.
What is the asking price?
The asking price for this property is $1,350,000.
What are key features of this property?
This property features: Year built 2009: meticulously maintained two‑family side‑hall colonial with custom features and high‑end fixtures; 6 bedrooms and 5 bathrooms total, including a 4‑bedroom main level with master suite featuring a walk‑in closet and private full bath; First floor offers a 2‑story entry foyer, formal dining room, living room, custom EIK with stainless steel appliances and island, plus a family room with fireplace


