Renovated Property with Highway

For Sale
$590,000
153s Us 1, Oak Hill, FL 32759
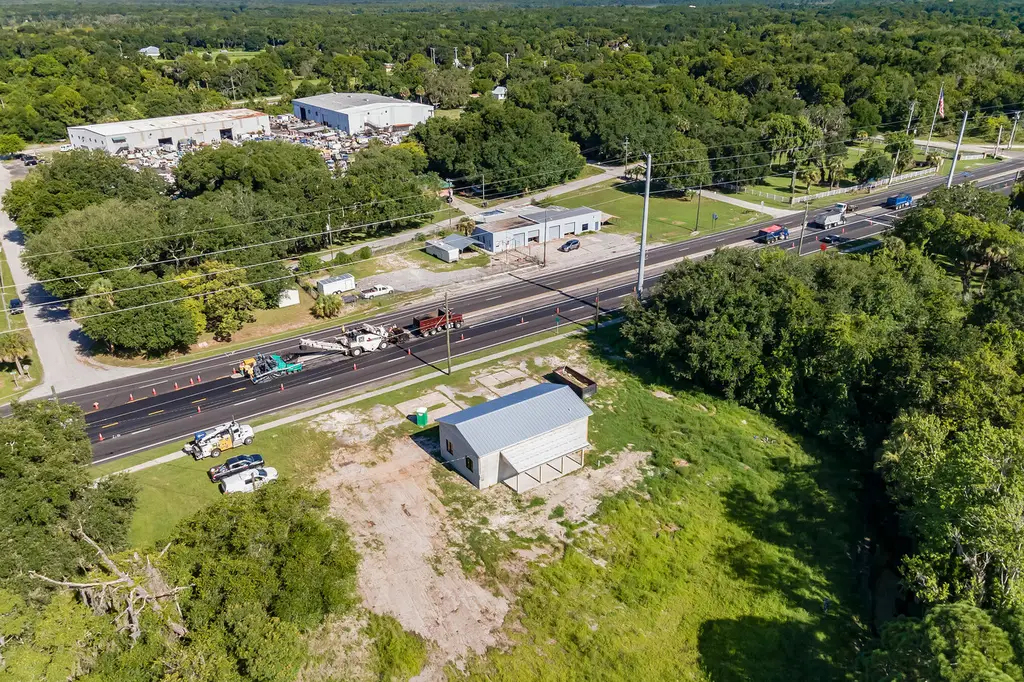
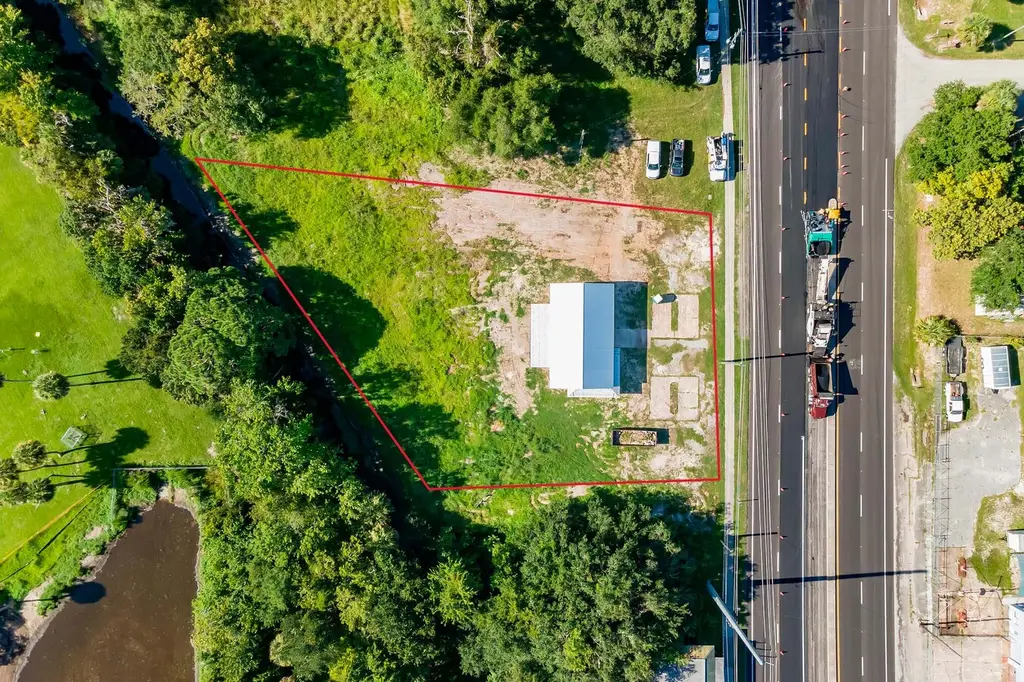
1.5+ Acres – Direct US Highway 1 Access!
Property Size1,855 SF
Lot Size1.53 Acres
Price / SF$318.06
Days on Market279
Property Features for 153s Us 1
General Information
Standard status
Active
Property type
Auto shops, Storefront properties, Commercial land, Automotive properties, Individual retail properties, Land
Size
1,855 SF
Net Rentable
1,855 SF
Class
C
Total Parking Spaces
25
Elevators
No
Lot size
1.53 Acres
Building Details
Year Built
1956
Year Renovated
2024
Buildings
1
Stories
1
Units
1
Listing Agency:
Dalton Wade Inc.
Listed By:
Linda Castro · License #3392783
(978) 804-9232
Added: Jan 7
Changed: Mar 16
Investment Insights
Based on property information with market context.
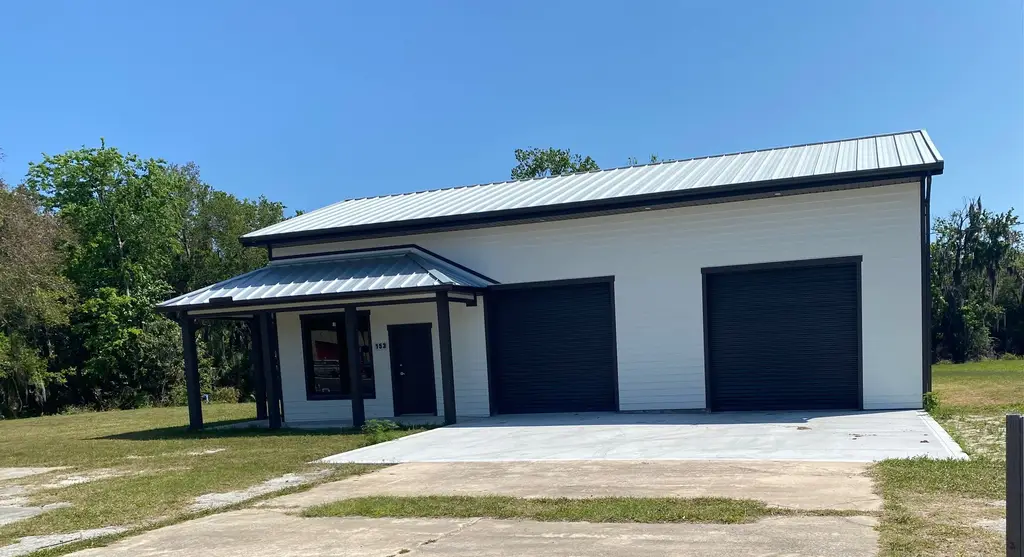
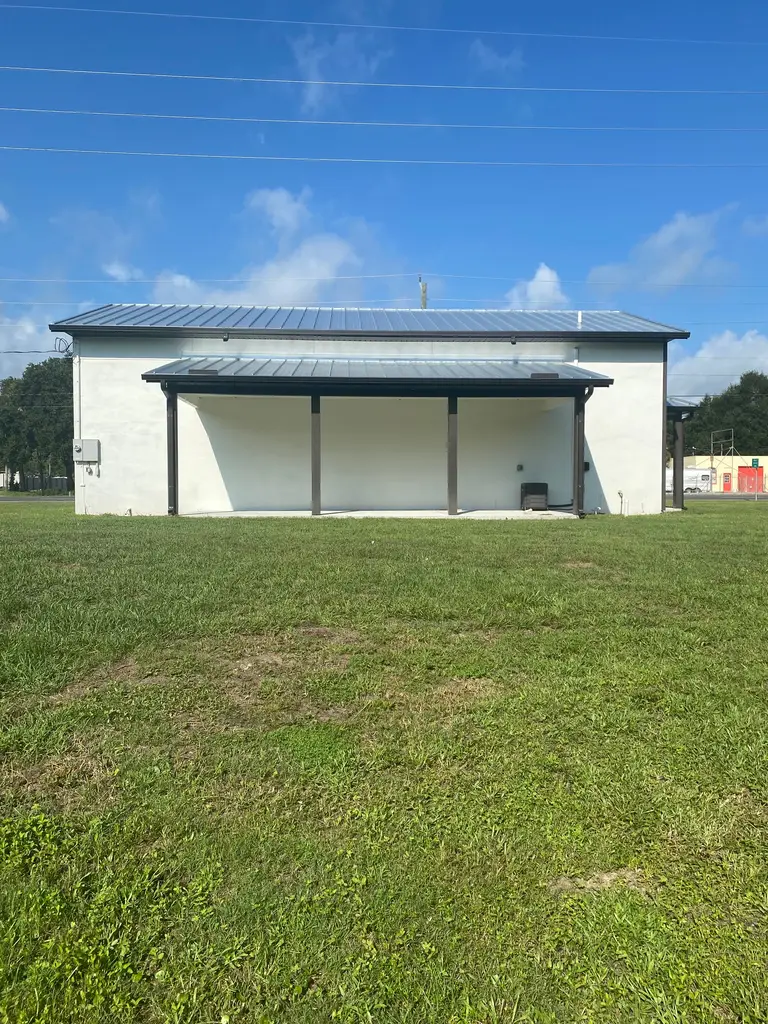
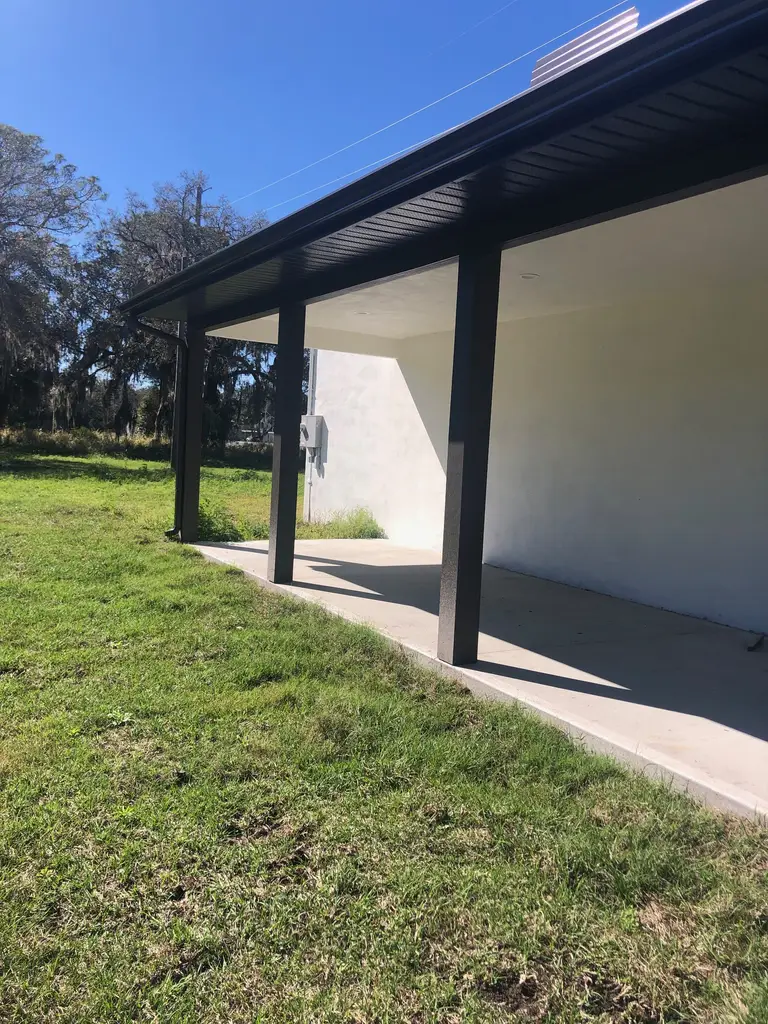
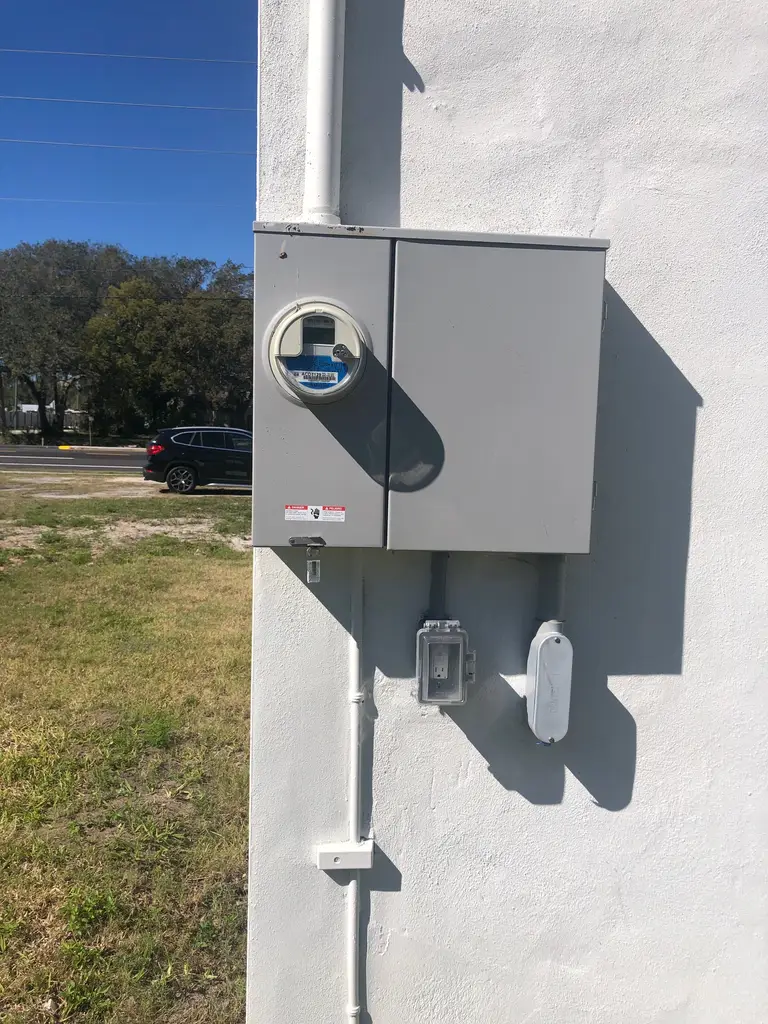
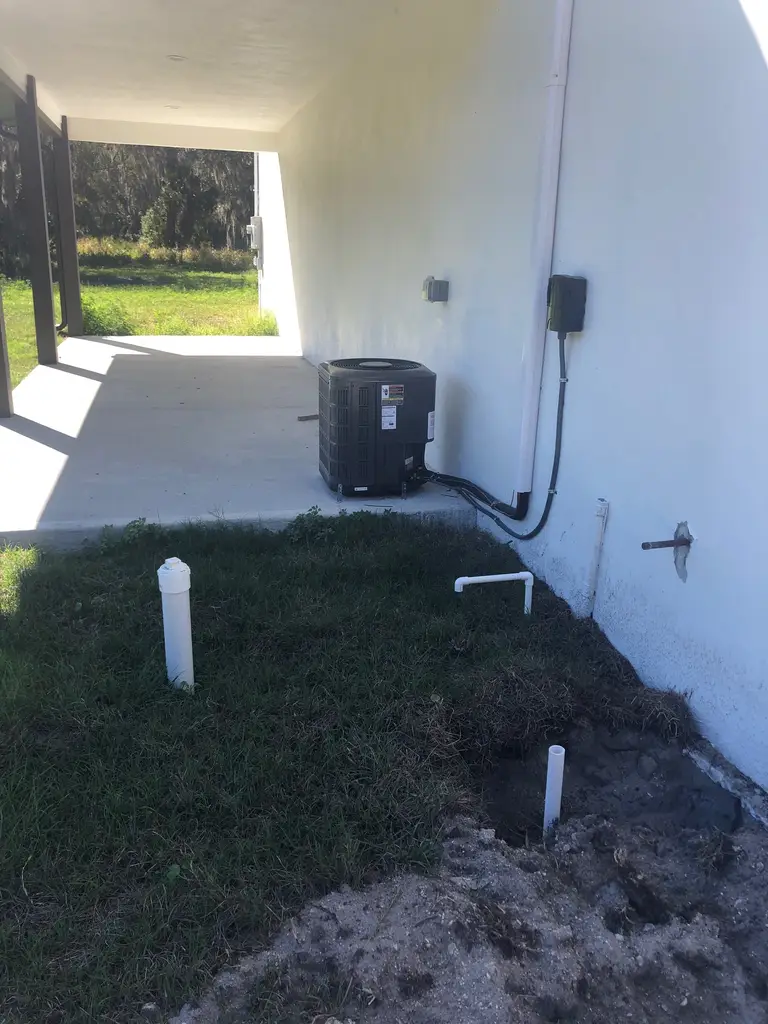
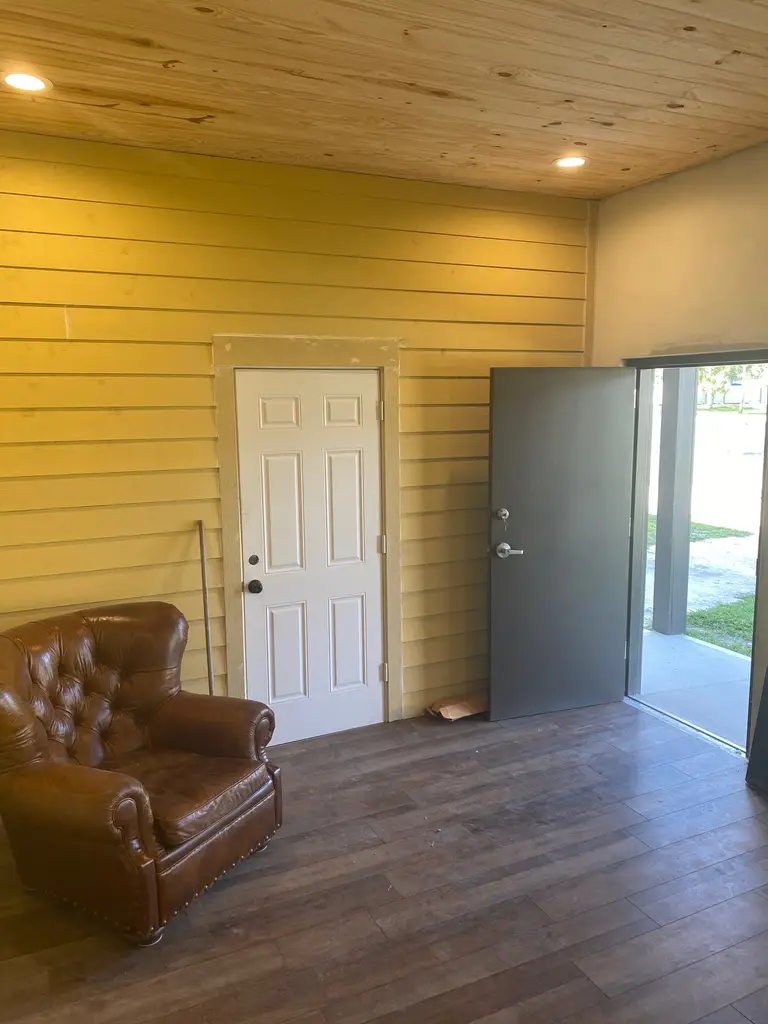
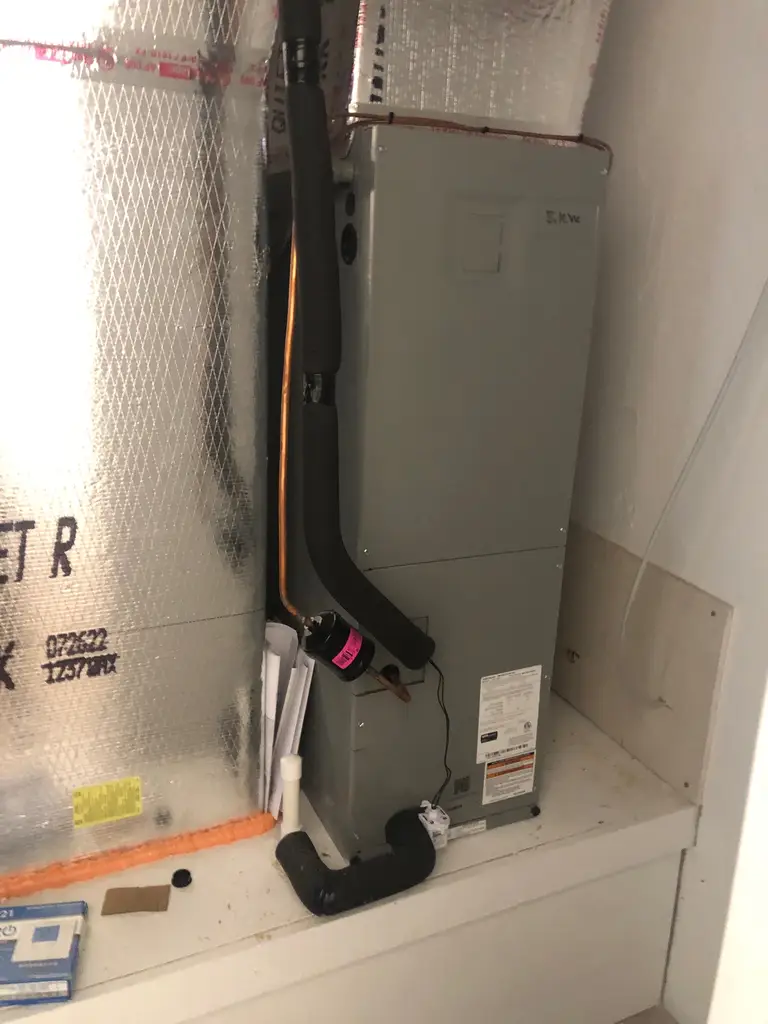
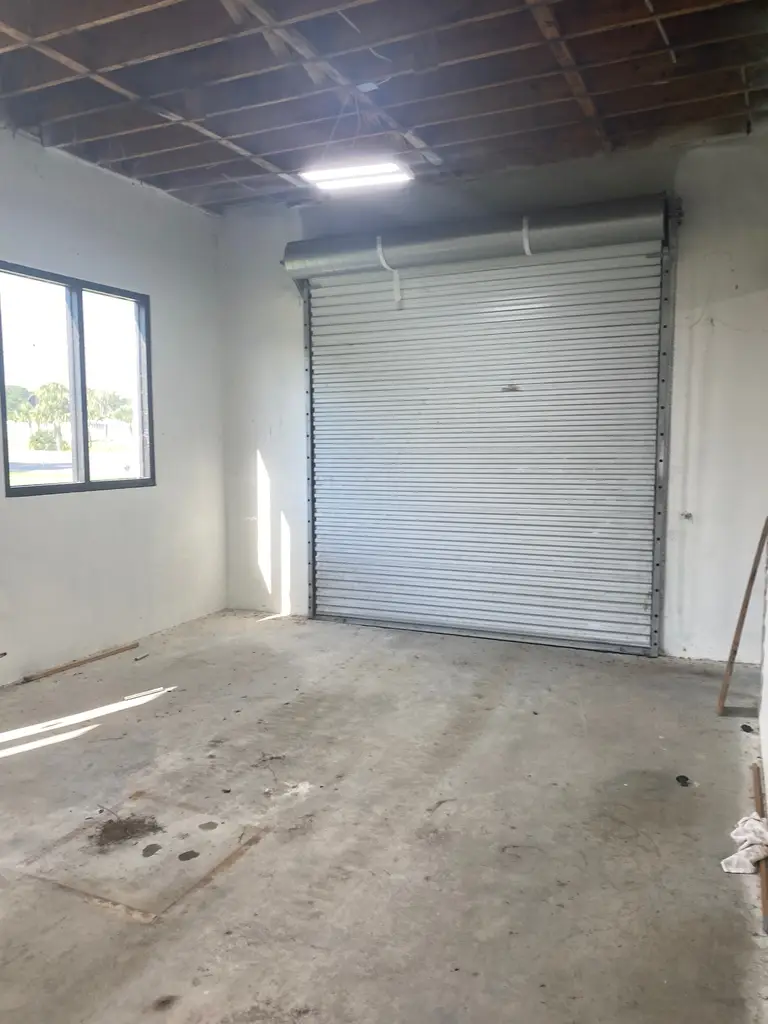
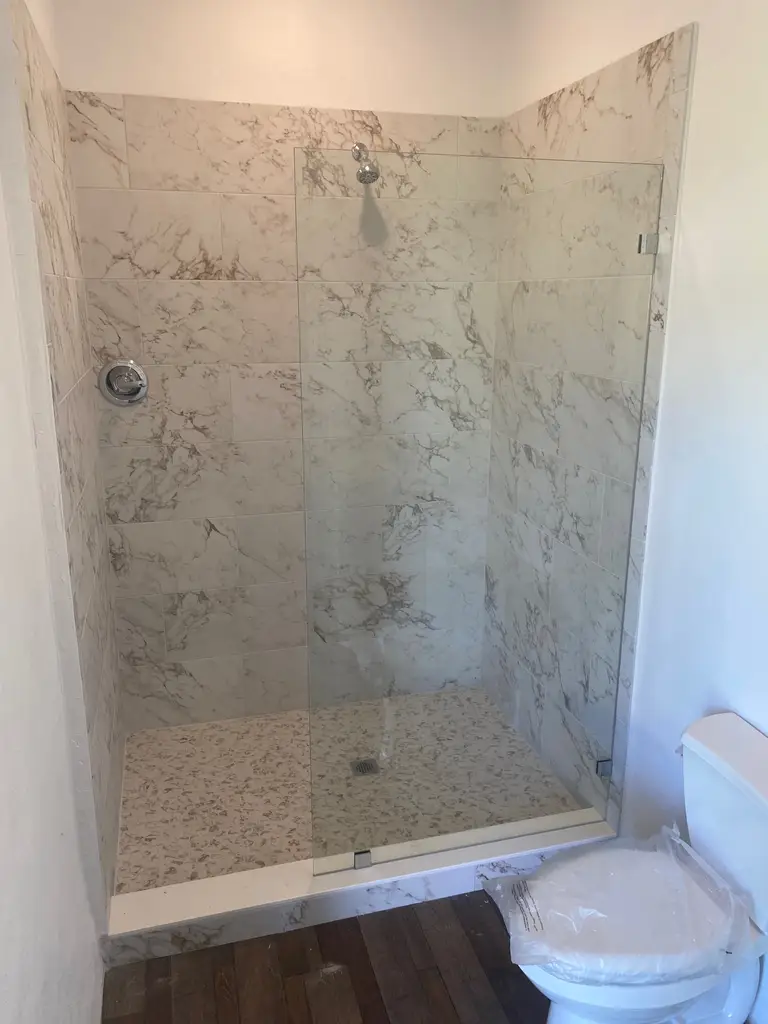
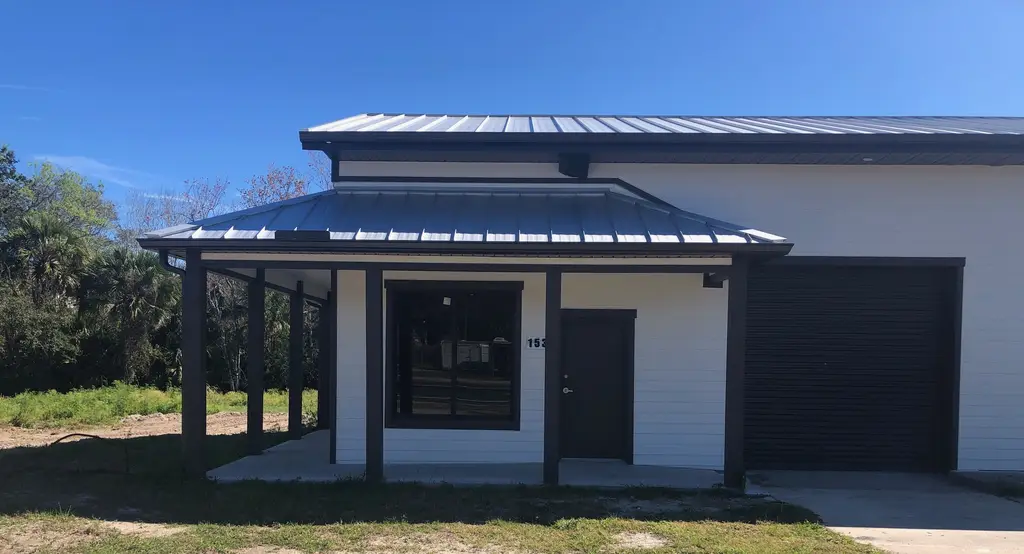
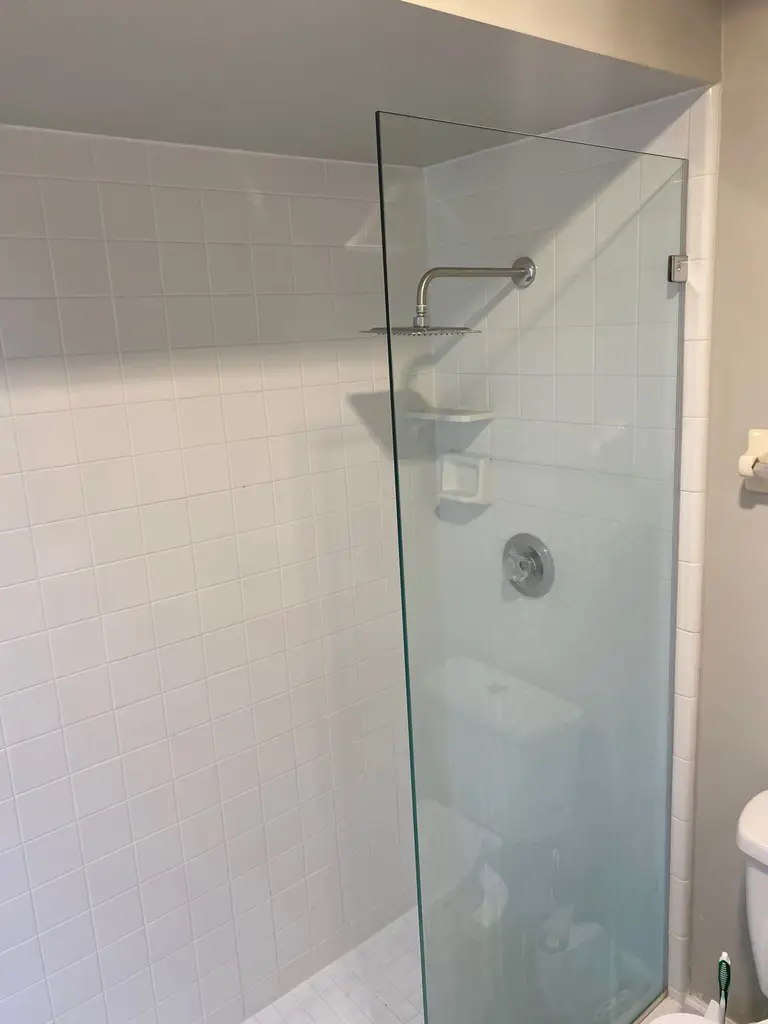
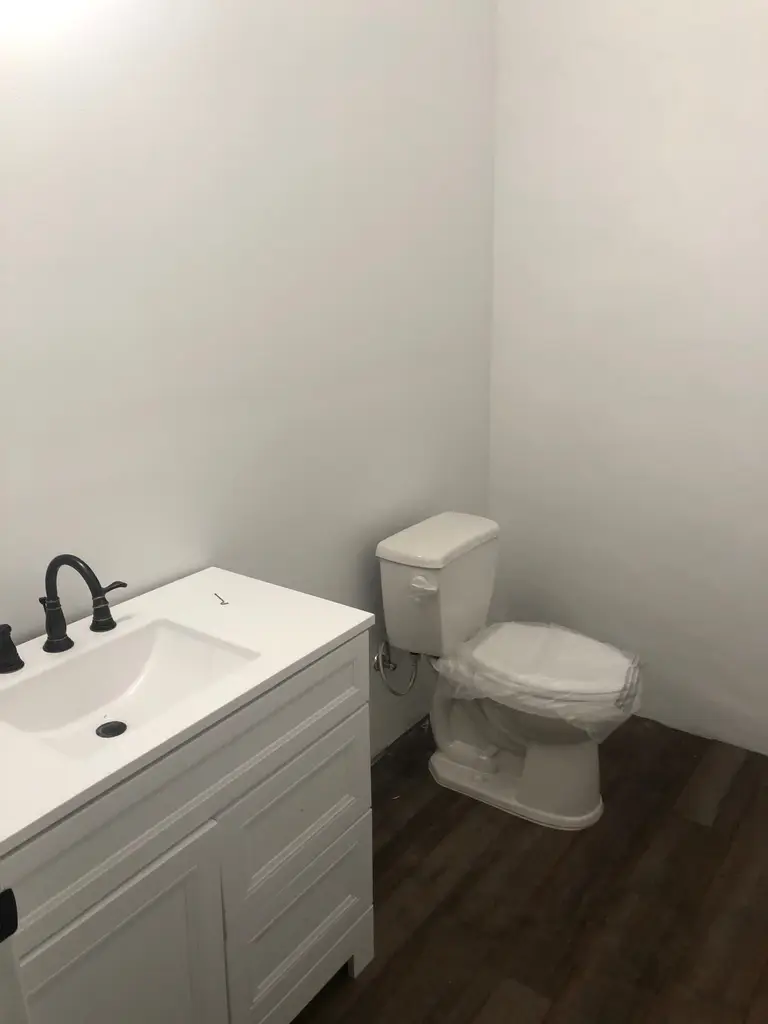
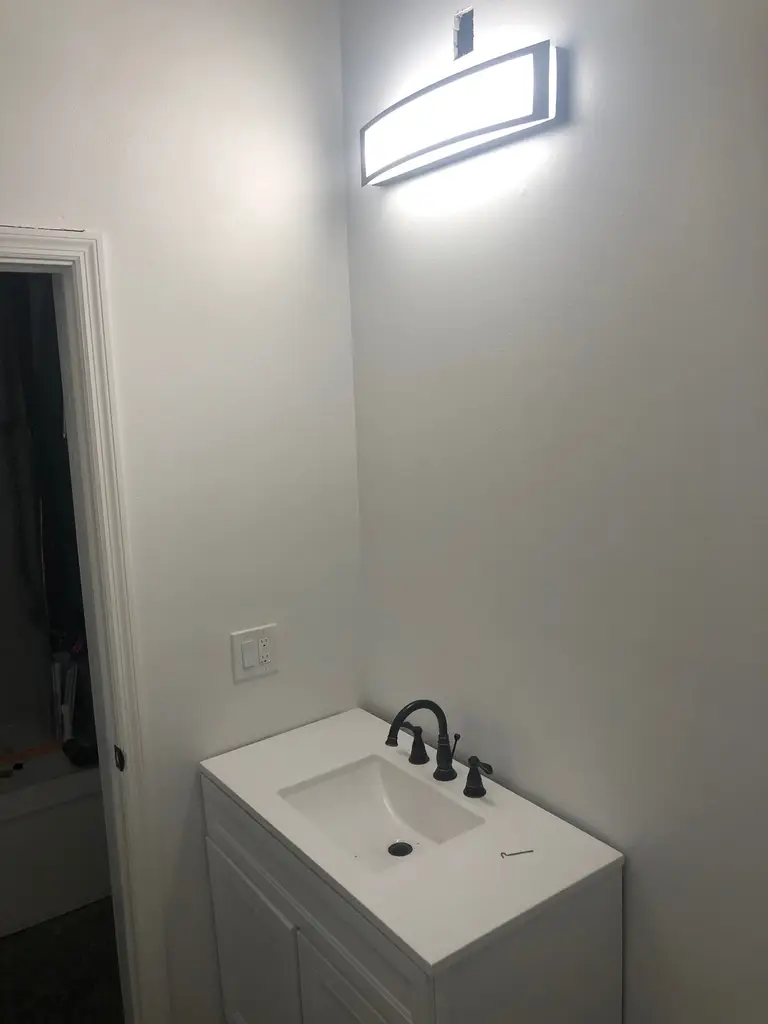
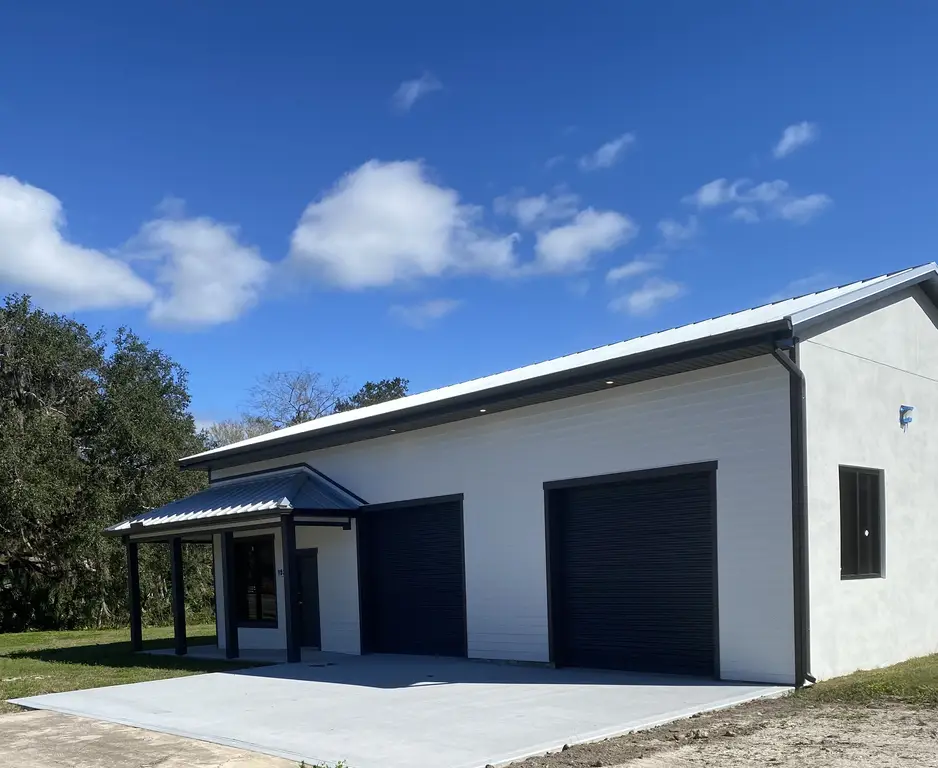
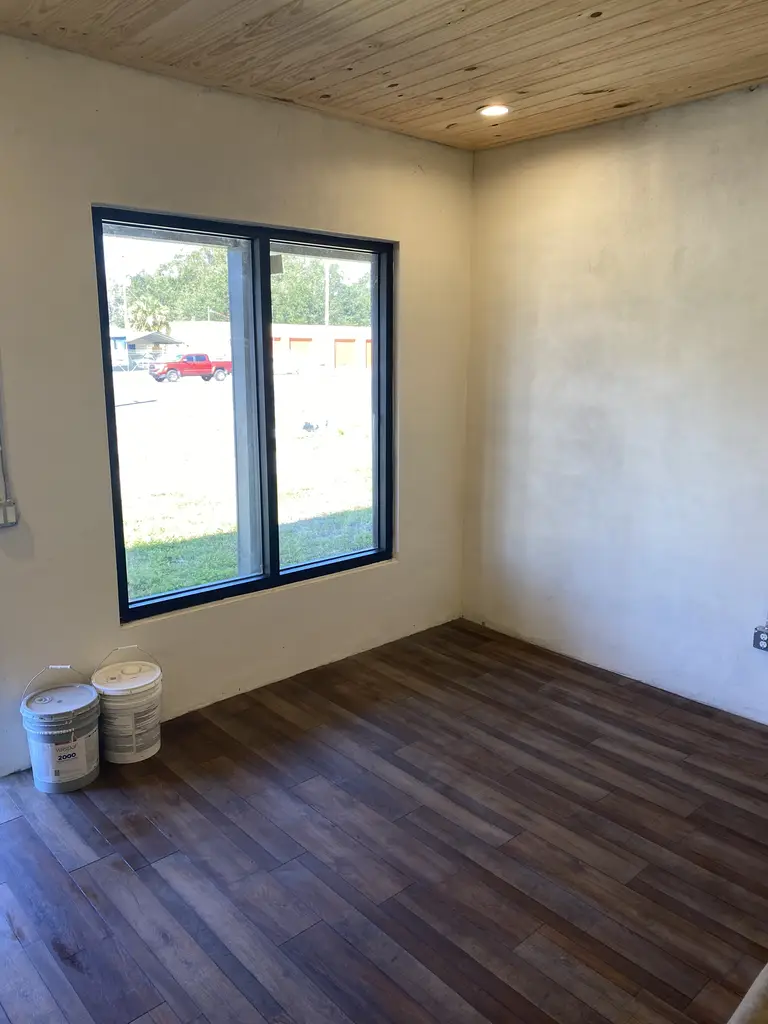
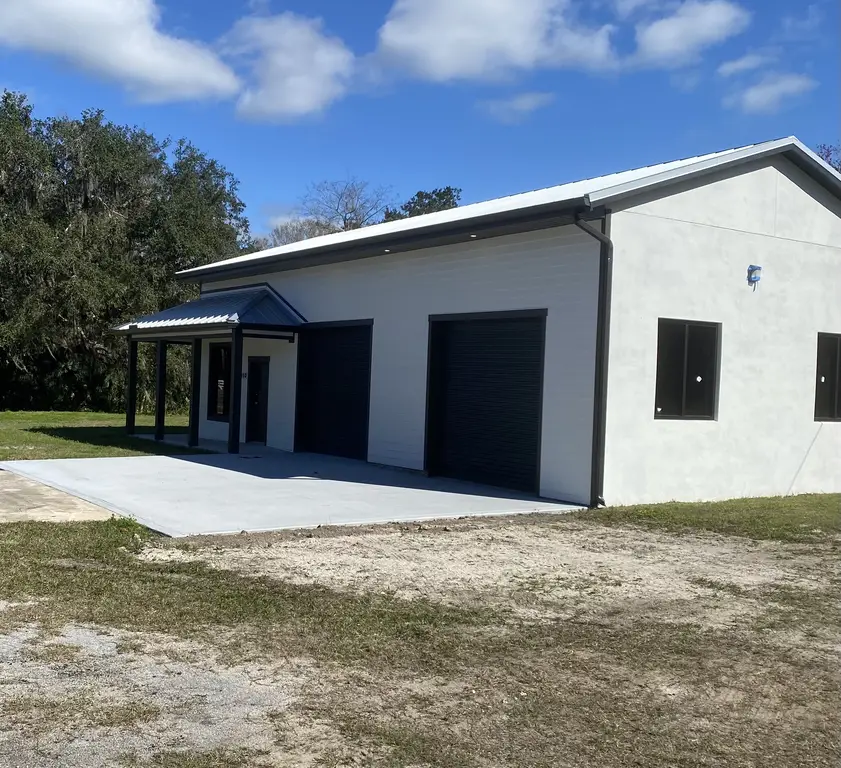
This renovated property, situated on over 1.5 acres, features direct access to US Highway 1. The property has been completely updated, including a new metal roof, columns, and back porch. The interior and exterior have been refreshed with new stucco, paint, and hardboard siding. New floors, bathroom tile, sinks, and fixtures have been installed, along with new plumbing under the slab, a new water pump, and water lines. The septic tank has been fully replaced, and new impact windows have been added. Electrical systems have been updated throughout. The property includes well and septic systems, both of which are new. There are two bathrooms, one inside and one outside, each equipped with a shower. The property offers plenty of parking and includes two bays, each measuring 28' x 17', as well as a 12' x 14' move-in-ready office. Over one acre has been cleared for storage or additional buildings. Located in Oak Hill, Florida, one of the fastest-growing areas along the coast, this property presents a significant opportunity.
Key Highlights
- Totally renovated 2024 - 1+ acres cleared for storage or additional buildings
Financial Insights
Estimated NOI and Cap Rate
NOI / Yr
$17,471
Cap Rate
2.96%
Suggested Prices Based on Cap Rates
Cap Rate 5%
$349,420
$349.4K
Cap Rate 7%
$249,586
$249.6K
Cap Rate 9%
$194,122
$194.1K
Market Conditions
NOI Build-Up for 1,855 SF
Gross rent
$27.8K $15.00/SF
− Vacancy
−$2.9K −$1.55/SF
EGI
$25.0K $13.46/SF
− OpEx
−$7.5K −$4.04/SF
NOI
$17.5K $9.42/SF
Area
Volusia County, FL
Vacancy
10.30%
Lease Rate
$15.00 /SF/Yr
Expense Ratio
30.00%
Simulate Cap Rate and NOI
Suggested Prices Based on Cap Rates
Cap Rate 5%
$349,420
Cap Rate 7%
$249,586
Cap Rate 9%
$194,122
Alternative Uses
Best Use
Retail
$249.6K
$218.4K – $291.2K
NOI $17,471 @ 7.0% cap · market cap 2.96%
Second Best
Industrial
$157.8K
$138.1K – $184.1K
NOI $11,044 @ 7.0% cap · market cap 1.87%
Theoretical Best
Office A
$547.0K
$478.6K – $638.1K
NOI $38,287 @ 7.0% cap · market cap 6.49%
Zoning and permitted uses should be independently verified with authorities.
How Realmo checks its estimates
Property Analytics
Current Use
Location Intelligence
Trade Area within ½ mile
55
Businesses Nearby
Well-served
Demand for This Use
Explore this area
Business Placement
Demographics for 32759, FL
2,951
Population
1,471
Households
2
Avg Household Size
56
Median Age
15%
College-Educated
86%
High-School Grad
48.7 sq mi
ZIP Area
61
Density / Sq Mi
$61,968
Median Household Income
$38,929
Median Earnings
$1,316
Median Rent
$266,600
Median Home Value
Market
Vacancy Rate% for Retail in South region

Questions? Ask Rey
Realmo’s AI knows this listing — price, zoning, demand, history. Ask anything.
Similar Off Market Nearby
- TMZ Auto — 415 Ward Dr, Oak Hill, FL 32759
Frequently Asked Questions
What type of property is this?
Auto shop - 1.5+ Acres – Direct US Highway 1 Access!
Where is this auto shop located?
The property is located at 153s Us 1 Oak Hill, FL.
What is the asking price?
The asking price for this property is $590,000.
What are key features of this property?
This property features: Totally renovated 2024 - 1+ acres cleared for storage or additional buildings


