23.5 Acres Mixed-Use Development
For Sale
$1,300,000
15213 S Dixie Hwy, Monroe, MI 48161
Income-producing property with development potential in Monroe, Michigan.
Property Size8,752 SF
Lot Size23.50 Acres
Price / SF$148.54
Days on Market194
Property Features for 15213 S Dixie Hwy
General Information
Standard status
Active
Size
8,752 SF
Lot size
23.50 Acres
Property subtype
Industrial, Investment
Zoning
C-3
Building Details
Building Size
8,752 SF
Year Built
2000
Year Renovated
2018
Buildings
5
Stories
1
Tenancy
Multi-Tenant
Listing Agency:
Signature Associates - Toledo
Listed By:
Thomas Fritz · License #6506045434
(734) 625-7100
Source:
Cpix.resimplifi
Added: Mar 27
Changed: Sep 13
Last Checked: Oct 5 at 3:23PM
Displayed information is deemed reliable but is not guaranteed and should be independently verified. All listing content including descriptions, pricing, images are the copyrighted material of Signature Associates - Toledo
Investment Insights
Based on property information with market context.
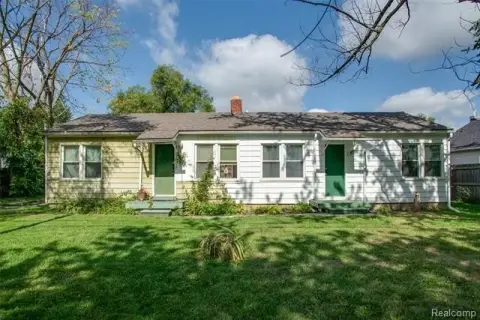
This 23.5-acre mixed-use property is located at the south end of Monroe, Michigan, on S Dixie Hwy. The property includes a fully leased commercial office/shop building, two large pole barns, and an independently rented residential house generating $1,350.00 per month. The existing buildings and outbuildings utilize 2.0 acres, leaving 21.5 vacant acres of developable land across three separate parcels. The vacant land is zoned for growth, including C-2 (General Commercial) and R-3 classifications. It is suited for projects such as storage units or a commercial yard for contractors requiring ground area. The property offers income from commercial buildings and a residential rental house. The location is strategic, and the zoning allows for flexible development options.
Key Highlights
- 23. 5‑acre mixed‑use property with 21.5 acres of developable land.
- Income‑producing property generating $1,350.00 per month from existing commercial buildings, pole barns, and a rented residential house.
- Strategic location on S Dixie Hwy at the south end of Monroe, Michigan.
Financial Insights
Estimated NOI and Cap Rate
NOI / Yr
$118,152
Cap Rate
9.09%
Suggested Prices Based on Cap Rates
Cap Rate 5%
$2,363,040
$2.4M
Cap Rate 7%
$1,687,886
$1.7M
Cap Rate 9%
$1,312,800
$1.3M
Market Conditions
NOI Build-Up for 8,752 SF
Gross rent
$210.0K $24.00/SF
− Vacancy
−$21.0K −$2.40/SF
EGI
$189.0K $21.60/SF
− OpEx
−$70.9K −$8.10/SF
NOI
$118.2K $13.50/SF
Area
Monroe County, MI
Vacancy
10.00%
Lease Rate
$24.00 /SF/Yr
Expense Ratio
37.50%
Simulate Cap Rate and NOI
Suggested Prices Based on Cap Rates
Cap Rate 5%
$2,363,040
Cap Rate 7%
$1,687,886
Cap Rate 9%
$1,312,800
Alternative Uses
Best Use
Warehouse
$9.03M
$7.90M – $10.53M
NOI $631,860 @ 7.0% cap · market cap 48.60%
Second Best
Industrial
$7.43M
$6.50M – $8.67M
NOI $520,356 @ 7.0% cap · market cap 40.03%
Theoretical Best
—
—
same as Best Use
Zoning and permitted uses should be independently verified with authorities.
Property Analytics
Unlock full access to Insights
Subscribe to Realmo Intelligence
Open Analytics
Current Use
Location Intelligence
Trade Area within ½ mile
238
Businesses Nearby
Explore this area
Business Placement
Demographics for 48161, MI
26,571
Population
12,015
Households
2.2
Avg Household Size
40
Median Age
19%
College-Educated
89%
High-School Grad
44.8 sq mi
ZIP Area
593
Density / Sq Mi
$65,517
Median Household Income
$40,184
Median Earnings
$955
Median Rent
$173,200
Median Home Value
Check the figures for this property
Cap Rate, Value Estimation, Potential NOI and more
View Realmo Analytics
Market
Vacancy Rate% for Office in Midwest region

Questions? Ask Rey
Realmo’s AI knows this listing — price, zoning, demand, history. Ask anything.




Frequently Asked Questions
What type of property is this?
Mixed-use property - Income-producing property with development potential in Monroe, Michigan.
Where is this mixed-use property located?
The property is located at 15213 S Dixie Hwy Monroe, MI.
What is the asking price?
The asking price for this property is $1,300,000.
What are key features of this property?
This property features: 23. 5‑acre mixed‑use property with **21.5 acres of developable land**.; Income‑producing property generating $1,350.00 per month from existing commercial buildings, pole barns, and a rented residential house.; Strategic location on S Dixie Hwy at the south end of Monroe, Michigan.



