Multi-Building Office and Education
For Sale
Contact for pricing
1511 S US Highway 301, Tampa, FL 33619
Three-building property with central heat and A/C, totaling 15,416 +/- SF, with parking for 28 vehicles.
Property Size15,416 SF
Lot Size2.05 Acres
Price / SF$194.28
Days on Market108
Property Features for 1511 S US Highway 301
General Information
Standard status
Active
Size
15,416 SF
Class
B
Total Parking Spaces
28
Lot size
2.05 Acres
Property subtype
Office
Zoning
RSC-6
Investment Type
Owner/User
Site & Location
Highway Access
Yes
Road Access
Yes
Building Details
Year Built
1990
Buildings
3
Listing Agency:
Transworld Commercial Real Estate
Listed By:
Alan Kaye · License #FL
Source:
Crexi
Added: Jul 8
Changed: Oct 1
Last Checked: Oct 20 at 6:47PM
Displayed information is deemed reliable but is not guaranteed and should be independently verified. All listing content including descriptions, pricing, images are the copyrighted material of Transworld Commercial Real Estate

Ask AI about this property
Review the available facts, identify missing information and prepare questions for the agent.
Investment Insights
Based on property information with market context.
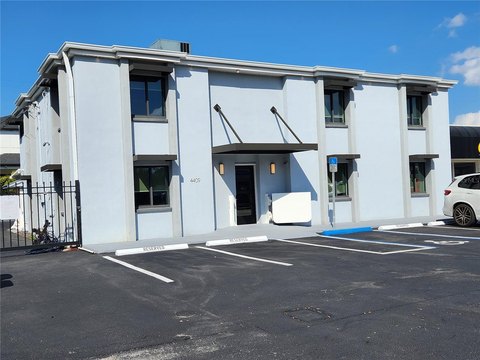
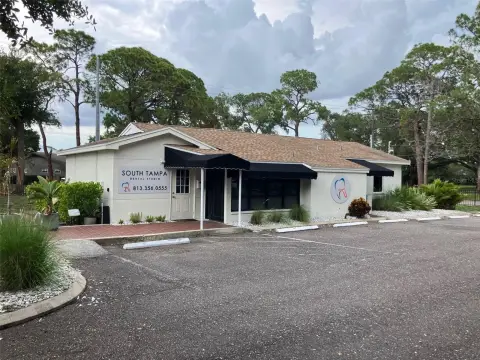
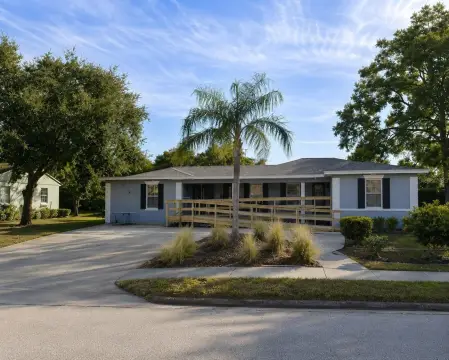
1511 S. US Highway 301 is a highly visible, multi-building commercial property improved with three separate structures totaling 15,416 +/- square feet. The largest building is a two-story facility of 11,480 +/- square feet constructed of concrete and masonry, built in 1990 and offering a flexible floor plan suitable for office, educational, or other commercial use. Building Two totals 3,190 +/- square feet, built in 1999 as a one-story wood frame structure with a metal roof and two bathrooms. Building Three comprises 1,824 +/- square feet, built in 2000 with wood frame construction. Each building is equipped with central heat & A/C.
The site is positioned at the intersection of two major transportation corridors, offering exposure along US Highway 301 and visibility from the Selmon Expressway. The property is described as providing convenient regional access throughout the Tampa Bay market, including Interstate 75, Interstate 4, Interstate 275, Downtown Tampa, the Port of Tampa, and Tampa International Airport.
The property sits on approximately 2.05 acres and includes parking for 28 spaces, with additional land area that may support outdoor uses, future expansion, or redevelopment.
The site is positioned at the intersection of two major transportation corridors, offering exposure along US Highway 301 and visibility from the Selmon Expressway. The property is described as providing convenient regional access throughout the Tampa Bay market, including Interstate 75, Interstate 4, Interstate 275, Downtown Tampa, the Port of Tampa, and Tampa International Airport.
The property sits on approximately 2.05 acres and includes parking for 28 spaces, with additional land area that may support outdoor uses, future expansion, or redevelopment.
Key Highlights
- Three‑building commercial property totaling 15,416 +/- SF on approximately 2.05 acres, built in 1990–2000.
- Large Building One: 11,480 +/- SF, two‑story concrete and masonry construction with a flexible floor plan.
- Building Two: 3,190 +/- SF (built 1999) with wood frame construction and a metal roof; includes two bathrooms.
Financial Insights
Estimated NOI and Cap Rate
NOI / Yr
$209,503
Cap Rate
7.00%
Suggested Prices Based on Cap Rates
Cap Rate 5%
$4,190,060
$4.2M
Cap Rate 7%
$2,992,900
$3.0M
Cap Rate 9%
$2,327,811
$2.3M
Market Conditions
NOI Build-Up for 15,416 SF
Gross rent
$370.0K $24.00/SF
− Vacancy
−$90.6K −$5.88/SF
EGI
$279.3K $18.12/SF
− OpEx
−$69.8K −$4.53/SF
NOI
$209.5K $13.59/SF
Area
Tampa, FL
Vacancy
24.50%
Lease Rate
$24.00 /SF/Yr
Expense Ratio
25.00%
Simulate Cap Rate and NOI
Suggested Prices Based on Cap Rates
Cap Rate 5%
$4,190,060
Cap Rate 7%
$2,992,900
Cap Rate 9%
$2,327,811
Alternative Uses
Best Use
Office B
$2.99M
$2.62M – $3.49M
NOI $209,503 @ 7.0% cap · market cap 7.00%
Second Best
—
—
no second resolved use
Theoretical Best
Office A
$3.59M
$3.14M – $4.19M
NOI $251,404 @ 7.0% cap · market cap 8.39%
Zoning and permitted uses should be independently verified with authorities.
How Realmo checks its estimates
Property Analytics
Who owns this building?
See the owner, sales and loan history
Open Analytics
Current Use
Lease Details
Yes
Highway access
Yes
Paved road access
Location Intelligence
Trade Area within ½ mile
356
Businesses Nearby
Explore this area
Business Placement
Demographics for 33619, FL
39,881
Population
15,360
Households
2.6
Avg Household Size
35
Median Age
23%
College-Educated
83%
High-School Grad
27.5 sq mi
ZIP Area
1,450
Density / Sq Mi
$63,193
Median Household Income
$38,448
Median Earnings
$1,618
Median Rent
$220,300
Median Home Value
Check the figures for this property
Cap Rate, Value Estimation, Potential NOI and more
View Realmo Analytics
Market
Vacancy Rate% for Office in Tampa, FL




Frequently Asked Questions
What type of property is this?
Office building - Three-building property with central heat and A/C, totaling 15,416 +/- SF, with parking for 28 vehicles.
Where is this office building located?
The property is located at 1511 S US Highway 301 Tampa, FL.
What is the asking price?
The asking price for this property is $2,995,000.
What are key features of this property?
This property features: Three‑building commercial property totaling 15,416 +/- SF on approximately 2.05 acres, built in 1990–2000.; Large Building One: 11,480 +/- SF, two‑story concrete and masonry construction with a flexible floor plan.; Building Two: 3,190 +/- SF (built 1999) with wood frame construction and a metal roof; includes two bathrooms.


