Coastal Retreat Condo Near
For Sale
$219,900
1510 OCEAN SHORE Blvd 3150, Ormond Beach, FL 32176
Charming ground-floor condo near the beach with modern upgrades.
Property Size952 SF
Days on Market176
Property Features for 1510 OCEAN SHORE Blvd 3150
General Information
Standard status
Active
Size
952 SF
Property subtype
Commercial
Taxes and HOA fees
Annual Taxes
$2,979
Building Details
Building Size
952 SF
Year Built
1973
Stories
7
Listing Agency:
Adams, Cameron & Co., Realtors
Listed By:
Debra Callahan · License #3493262
(386) 453-8814
Source:
Elliman
Added: Apr 24
Changed: Sep 30
Last Checked: Oct 15 at 12:44AM
Displayed information is deemed reliable but is not guaranteed and should be independently verified. All listing content including descriptions, pricing, images are the copyrighted material of Adams, Cameron & Co., Realtors

Ask AI about this property
Review the available facts, identify missing information and prepare questions for the agent.
Investment Insights
Based on property information with market context.
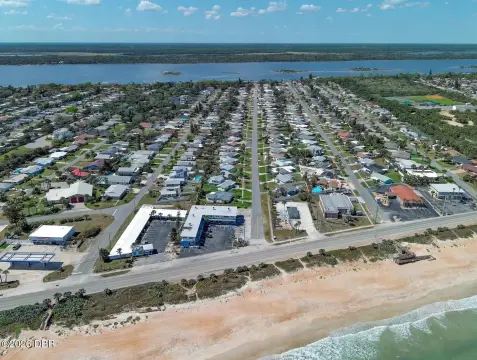
This ground-floor end-unit condo offers a blend of comfort, convenience, and seaside tranquility. Located near beach access and Tom Renick Park, the location is suitable for beach activities such as fishing, biking, strolling, surfing, and sailing. The single-level living space is filled with natural light from additional windows. The condo features a remodeled kitchen and bathrooms with modern finishes. The kitchen showcases quartz countertops, and the open dining and living area is highlighted by a shiplap accent wall and quartz table top. Additional conveniences include an in-unit washer and dryer, a half bath, and a Ring security system. The utilities can be monitored remotely. The property is located near a no-car beach. The bike score is 49, indicating it is somewhat bikeable, and the walk score is 41, indicating car dependence.
Key Highlights
- Steps from beach access and Tom Renick Park on a no‑car beach.
- Newly remodeled kitchen and bathrooms with quartz countertops and modern finishes.
- Ground‑floor end‑unit condo with abundant natural light.
Financial Insights
Estimated NOI and Cap Rate
NOI / Yr
$7,254
Cap Rate
3.30%
Suggested Prices Based on Cap Rates
Cap Rate 5%
$145,080
$145.1K
Cap Rate 7%
$103,629
$103.6K
Cap Rate 9%
$80,600
$80.6K
Market Conditions
NOI Build-Up for 952 SF
Gross rent
$14.7K $15.48/SF
− Vacancy
−$1.5K −$1.63/SF
EGI
$13.2K $13.85/SF
− OpEx
−$5.9K −$6.23/SF
NOI
$7.3K $7.62/SF
Area
Volusia County, FL
Vacancy
10.50%
Lease Rate
$15.48 /SF/Yr
Expense Ratio
45.00%
Simulate Cap Rate and NOI
Suggested Prices Based on Cap Rates
Cap Rate 5%
$145,080
Cap Rate 7%
$103,629
Cap Rate 9%
$80,600
Alternative Uses
Best Use
Apartment 5plus
$103.6K
$90.7K – $120.9K
NOI $7,254 @ 7.0% cap · market cap 3.30%
Second Best
—
—
no second resolved use
Theoretical Best
Office A
$280.7K
$245.6K – $327.5K
NOI $19,649 @ 7.0% cap · market cap 8.94%
Zoning and permitted uses should be independently verified with authorities.
How Realmo checks its estimates
Property Analytics
Unlock full access to Insights
Subscribe to Realmo Intelligence
Open Analytics
Current Use
Location Intelligence
Trade Area within ½ mile
367
Businesses Nearby
Explore this area
Business Placement
Demographics for 32176, FL
14,410
Population
10,329
Households
1.4
Avg Household Size
59
Median Age
38%
College-Educated
95%
High-School Grad
5.7 sq mi
ZIP Area
2,528
Density / Sq Mi
$72,248
Median Household Income
$39,529
Median Earnings
$1,436
Median Rent
$368,400
Median Home Value
Check the figures for this property
Cap Rate, Value Estimation, Potential NOI and more
View Realmo Analytics


Frequently Asked Questions
What type of property is this?
Residential income property - Charming ground-floor condo near the beach with modern upgrades.
Where is this residential income property located?
The property is located at 1510 OCEAN SHORE Blvd 3150 Ormond Beach, FL.
What is the asking price?
The asking price for this property is $219,900.
What are key features of this property?
This property features: Steps from beach access and Tom Renick Park on a no‑car beach.; Newly remodeled kitchen and bathrooms with quartz countertops and modern finishes.; Ground‑floor end‑unit condo with abundant natural light.


