20-Unit Two-Bedroom Apartment
For Sale
$6,200,000
1502 27th Street San Diego, San Diego, CA 92154
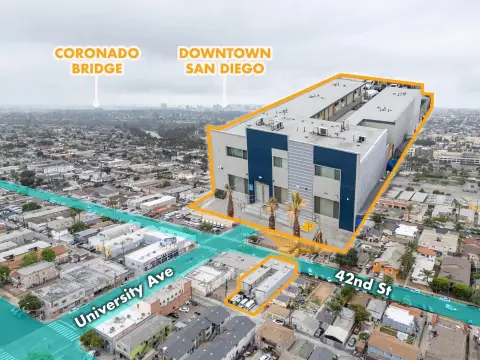
San Diego condo-grade complex with 20 two-bedroom, two-bath units, private patios, and dedicated laundry hook-ups plus separate water meters.
Property Size17,500 SF
Lot Size0.71 Acres
Price / SF$354.29
Days on Market109
Property Features for 1502 27th Street San Diego
General Information
Standard status
Active
Size
17,500 SF
Total Parking Spaces
28
Lot size
0.71 Acres
Net Operating Income
$416,688
Site & Location
Highway Access
Yes
Road Access
Yes
Additional Details
Business Included
Yes
Multifamily Units
20
Amenities
false
true
30927
28
0.71
3
Building Details
Year Built
1985
Year Renovated
2024
Buildings
3
Stories
2
Tenancy
Multi
Listed By:
Valerie Strom
(909) 328-1567
Source:
Rmarealty
Added: Jun 28
Changed: Oct 7
Last Checked: Oct 7 at 8:47AM
Displayed information is deemed reliable but is not guaranteed and should be independently verified. All listing content including descriptions, pricing, images are the copyrighted material of Valerie Strom
Investment Insights
Based on property information with market context.
The Benton Apartments is a condo-grade 20-unit apartment complex built in 1985 on a 30,927-square-foot lot. The property features three separate two-story buildings with pitched roofs, totaling approximately 17,500 square feet of structures. All units are 2 bedroom/2 bathroom and include private patio areas, including some large layouts and one wraparound patio across multiple sides of the unit. One unit is attached to the manager’s office, and one unit features a large family room. Each unit has its own laundry hook-ups with a full-sized washer and dryer, and each unit has separate water meters.
The buildings are on a contiguous parcel with frontage on two streets at 1485-95 25th Street and 1502-30 27th Street. Parking is provided by 27 spaces split between two parking lots, with one lot secured by an automatic gate. The property includes onsite security cameras and an approximately 300-square-foot storage unit. Recent site improvements include new fencing, landscaping, and signage.
Interior and exterior updates include new vinyl plank flooring in half of the units, and two units equipped with mini-split air conditioning. In 2021, the roofs, fascia boards, and some siding were replaced, along with new exterior and trim paint, and new gutters were installed. In 2024, the parking lots were resurfaced. The asset is offered as a turnkey investment for an operator seeking a maintained, primarily residential rental setup.
The buildings are on a contiguous parcel with frontage on two streets at 1485-95 25th Street and 1502-30 27th Street. Parking is provided by 27 spaces split between two parking lots, with one lot secured by an automatic gate. The property includes onsite security cameras and an approximately 300-square-foot storage unit. Recent site improvements include new fencing, landscaping, and signage.
Interior and exterior updates include new vinyl plank flooring in half of the units, and two units equipped with mini-split air conditioning. In 2021, the roofs, fascia boards, and some siding were replaced, along with new exterior and trim paint, and new gutters were installed. In 2024, the parking lots were resurfaced. The asset is offered as a turnkey investment for an operator seeking a maintained, primarily residential rental setup.
Key Highlights
- 20‑unit condo‑grade apartment complex in San Diego with all units configured as 2 Bed/2 Bath
- Approximately 17,500 SF of structures built in 1985 across 3 two‑story buildings with pitched roofs
- Lot size 30,927 SF (0.71 acres) on a single contiguous parcel with frontage on 25th St and 27th St
Financial Insights
Estimated NOI and Cap Rate
NOI / Yr
$329,868
Cap Rate
5.32%
Suggested Prices Based on Cap Rates
Cap Rate 5%
$6,597,360
$6.6M
Cap Rate 7%
$4,712,400
$4.7M
Cap Rate 9%
$3,665,200
$3.7M
Market Conditions
NOI Build-Up for 17,500 SF
Gross rent
$630.0K $36.00/SF
− Vacancy
−$30.2K −$1.73/SF
EGI
$599.8K $34.27/SF
− OpEx
−$269.9K −$15.42/SF
NOI
$329.9K $18.85/SF
Area
ZIP 92154
Vacancy
4.80%
Lease Rate
$36.00 /SF/Yr
Expense Ratio
45.00%
Simulate Cap Rate and NOI
Suggested Prices Based on Cap Rates
Cap Rate 5%
$6,597,360
Cap Rate 7%
$4,712,400
Cap Rate 9%
$3,665,200
Alternative Uses
Best Use
Apartment 5plus
$4.71M
$4.12M – $5.50M
NOI $329,868 @ 7.0% cap · market cap 5.32%
Second Best
—
—
no second resolved use
Theoretical Best
Office A
$6.26M
$5.48M – $7.31M
NOI $438,480 @ 7.0% cap · market cap 7.07%
Zoning and permitted uses should be independently verified with authorities.
How Realmo checks its estimates
Property Analytics
Unlock full access to Insights
Subscribe to Realmo Intelligence
Open Analytics
Current Use
Lease Details
20
Residential units
Multi-tenant
Tenancy
Turnkey business
Opportunity
Yes
Highway access
Yes
Paved road access
Location Intelligence
Trade Area within ½ mile
594
Businesses Nearby
Explore this area
Business Placement
Demographics for 92154, CA
84,027
Population
23,832
Households
3.5
Avg Household Size
36
Median Age
21%
College-Educated
80%
High-School Grad
51.3 sq mi
ZIP Area
1,638
Density / Sq Mi
$90,035
Median Household Income
$42,333
Median Earnings
$2,143
Median Rent
$606,400
Median Home Value
Check the figures for this property
Cap Rate, Value Estimation, Potential NOI and more
View Realmo Analytics
Market
Vacancy Rate% for Multifamily in West region

Questions? Ask Rey
Realmo’s AI knows this listing — price, zoning, demand, history. Ask anything.




Frequently Asked Questions
What type of property is this?
Apartment building - San Diego condo-grade complex with 20 two-bedroom, two-bath units, private patios, and dedicated laundry hook-ups plus separate water meters.
Where is this apartment building located?
The property is located at 1502 27th Street San Diego San Diego, CA.
What is the asking price?
The asking price for this property is $6,200,000.
What are key features of this property?
This property features: 20‑unit condo‑grade apartment complex in San Diego with all units configured as 2 Bed/2 Bath; Approximately 17,500 SF of structures built in 1985 across 3 two‑story buildings with pitched roofs; Lot size 30,927 SF (0.71 acres) on a single contiguous parcel with frontage on 25th St and 27th St