Multi-Floor Office and Retail
For Sale
Contact for pricing
1501 TILTON RD, Northfield, NJ 08225
Multi-floor building with elevator service and on-site parking, featuring office and training space plus a leasing-ready first floor.
Property Size15,973 SF
Price / SF$175.30
Days on Market136

Ask AI about this property
Review the available facts, identify missing information and prepare questions for the agent.
Property Features for 1501 TILTON RD
General Information
Standard status
Active
Size
15,973 SF
Property subtype
Office
Zoning
Off Prof
Lease Type
NNN
Investment Type
Redevelopment
Building Details
Buildings
1
Stories
2
Units
53
Tenancy
Multi
Listing Agency:
Foresite Commercial Realty
Listed By:
Samantha Zerafa Roessler · License #NJ 1643608
(609) 646-1919
Source:
Crexi
Added: Jun 2
Changed: Oct 15
Last Checked: Oct 14 at 10:31PM
Displayed information is deemed reliable but is not guaranteed and should be independently verified. All listing content including descriptions, pricing, images are the copyrighted material of Foresite Commercial Realty
Investment Insights
Based on property information with market context.
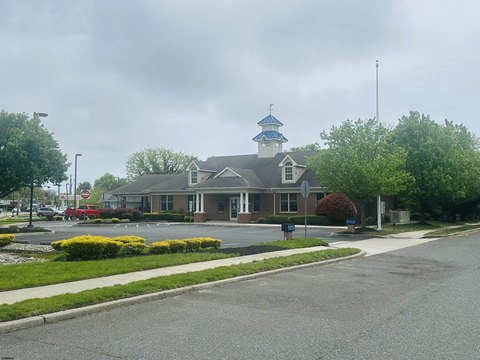
The property is a 15,970+/- sf multi-floor building with elevator access serving all three floors. The lower level and second floor are finished for office use and include a training room. The first floor is currently vacant and was formerly occupied by Bank of America, and it is being marketed for lease. There is on-site parking, with stated potential to increase the number of parking spaces. The building also offers signage, including monument signage.
The asset is positioned in the heart of the Northfield Business district with access to all Shore Points. A short-term lease is in place for more than 9,000 sf, while the first floor is available for leasing and potential exists to lease the entire building. Call listing agents for further details.
For tenants and buyers, the layout supports an owner-occupant strategy or a multi-tenant configuration, with finished office space and a dedicated training room on the lower and second floors. The vacant first floor provides immediate flexibility for a range of office-oriented users, with the option to pursue a larger footprint if a full-building requirement develops. On-site parking and building signage support day-to-day customer and client access.
The asset is positioned in the heart of the Northfield Business district with access to all Shore Points. A short-term lease is in place for more than 9,000 sf, while the first floor is available for leasing and potential exists to lease the entire building. Call listing agents for further details.
For tenants and buyers, the layout supports an owner-occupant strategy or a multi-tenant configuration, with finished office space and a dedicated training room on the lower and second floors. The vacant first floor provides immediate flexibility for a range of office-oriented users, with the option to pursue a larger footprint if a full-building requirement develops. On-site parking and building signage support day-to-day customer and client access.
Key Highlights
- 15,970+/- SF multi‑floor building with elevator access to all 3 floors
- Short‑term lease in place for 9,000+ SF; first floor (former Bank of America) currently vacant
- Lower level and 2nd floor are finished as office space and a training room
Financial Insights
Estimated NOI and Cap Rate
NOI / Yr
$234,022
Cap Rate
8.36%
Suggested Prices Based on Cap Rates
Cap Rate 5%
$4,680,440
$4.7M
Cap Rate 7%
$3,343,171
$3.3M
Cap Rate 9%
$2,600,244
$2.6M
Market Conditions
NOI Build-Up for 15,973 SF
Gross rent
$427.4K $26.76/SF
− Vacancy
−$115.4K −$7.23/SF
EGI
$312.0K $19.53/SF
− OpEx
−$78.0K −$4.88/SF
NOI
$234.0K $14.65/SF
Area
Atlantic County, NJ
Vacancy
27.00%
Lease Rate
$26.76 /SF/Yr
Expense Ratio
25.00%
Simulate Cap Rate and NOI
Suggested Prices Based on Cap Rates
Cap Rate 5%
$4,680,440
Cap Rate 7%
$3,343,171
Cap Rate 9%
$2,600,244
Alternative Uses
Best Use
Office B
$3.34M
$2.93M – $3.90M
NOI $234,022 @ 7.0% cap · market cap 8.36%
Second Best
—
—
no second resolved use
Theoretical Best
Warehouse
$5.95M
$5.20M – $6.94M
NOI $416,377 @ 7.0% cap · market cap 14.87%
Zoning and permitted uses should be independently verified with authorities.
How Realmo checks its estimates
Property Analytics
Unlock full access to Insights
Subscribe to Realmo Intelligence
Open Analytics
Current Use
Location Intelligence
Trade Area within ½ mile
774
Businesses Nearby
Explore this area
Business Placement
Demographics for 08225, NJ
8,442
Population
3,447
Households
2.4
Avg Household Size
44
Median Age
46%
College-Educated
93%
High-School Grad
6.1 sq mi
ZIP Area
1,384
Density / Sq Mi
$104,042
Median Household Income
$50,938
Median Earnings
$1,554
Median Rent
$275,900
Median Home Value
Check the figures for this property
Cap Rate, Value Estimation, Potential NOI and more
View Realmo Analytics
Market
Vacancy Rate% for Office in Northeast region






Frequently Asked Questions
What type of property is this?
Office building - Multi-floor building with elevator service and on-site parking, featuring office and training space plus a leasing-ready first floor.
Where is this office building located?
The property is located at 1501 TILTON RD Northfield, NJ.
What is the asking price?
The asking price for this property is $2,800,000.
What are key features of this property?
This property features: 15,970+/- SF multi‑floor building with elevator access to all 3 floors; Short‑term lease in place for 9,000+ SF; first floor (former Bank of America) currently vacant; Lower level and 2nd floor are finished as office space and a training room


