Corner Storefront
For Sale
$150,000
1501 S Marietta St, Gastonia, NC 28054
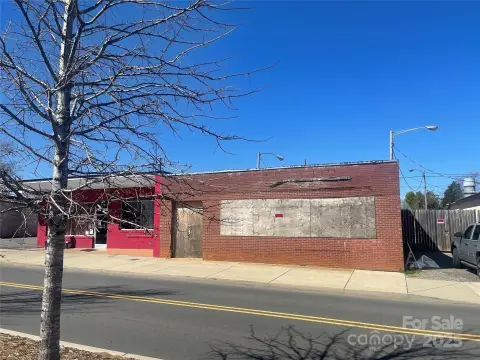
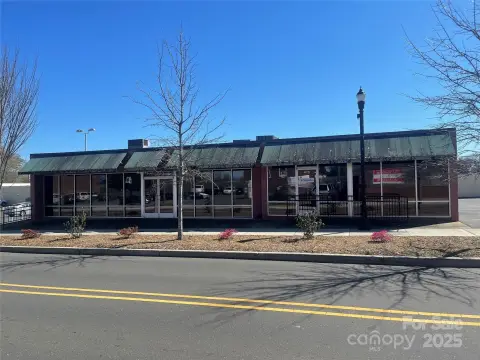
Vacant corner-lot storefront beside a convenience store with easy access.
Property Size1,000 SF
Price / SF$150
Days on Market70
Property Features for 1501 S Marietta St
General Information
Standard status
Active
Size
1,000 SF
Additional Details
Corner Location
Yes
Building Details
Year Built
1956
Buildings
1
Listing Agency:
EXP Realty LLC Ballantyne
Listed By:
Sierra Garren · License #127928
(803) 627-3072
Source:
Highperformancerea
Added: Aug 5
Changed: Oct 6
Last Checked: Oct 7 at 4:22PM
Displayed information is deemed reliable but is not guaranteed and should be independently verified. All listing content including descriptions, pricing, images are the copyrighted material of EXP Realty LLC Ballantyne
Investment Insights
Based on property information with market context.
This vacant storefront building contains 1,000 square feet and occupies a corner lot at 1501 S Marietta St in Gastonia, North Carolina. Constructed in 1956, the property offers a compact commercial setting for a future occupant or owner-user.
The building sits next to a convenience store and is positioned for straightforward access from the surrounding street network. Its corner placement and location along S Marietta St provide clear physical orientation within the immediate commercial setting.
The building sits next to a convenience store and is positioned for straightforward access from the surrounding street network. Its corner placement and location along S Marietta St provide clear physical orientation within the immediate commercial setting.
Key Highlights
- 1,000‑square‑foot vacant storefront building
- Corner‑lot position at 1501 S Marietta St
- Adjacent to a convenience store
Financial Insights
Estimated NOI and Cap Rate
NOI / Yr
$12,277
Cap Rate
8.18%
Suggested Prices Based on Cap Rates
Cap Rate 5%
$245,540
$245.5K
Cap Rate 7%
$175,386
$175.4K
Cap Rate 9%
$136,411
$136.4K
Market Conditions
NOI Build-Up for 1,000 SF
Gross rent
$19.0K $18.96/SF
− Vacancy
−$1.4K −$1.42/SF
EGI
$17.5K $17.54/SF
− OpEx
−$5.3K −$5.26/SF
NOI
$12.3K $12.28/SF
Area
Gaston County, NC
Vacancy
7.50%
Lease Rate
$18.96 /SF/Yr
Expense Ratio
30.00%
Simulate Cap Rate and NOI
Suggested Prices Based on Cap Rates
Cap Rate 5%
$245,540
Cap Rate 7%
$175,386
Cap Rate 9%
$136,411
Alternative Uses
Best Use
Retail
$175.4K
$153.5K – $204.6K
NOI $12,277 @ 7.0% cap · market cap 8.18%
Second Best
—
—
no second resolved use
Theoretical Best
Office A
$314.7K
$275.4K – $367.2K
NOI $22,032 @ 7.0% cap · market cap 14.69%
Zoning and permitted uses should be independently verified with authorities.
How Realmo checks its estimates
Property Analytics
Unlock full access to Insights
Subscribe to Realmo Intelligence
Open Analytics
Current Use
Location Intelligence
Trade Area within ½ mile
202
Businesses Nearby
7k
Monthly Visits Nearby
Under-served
Demand for This Use
Explore this area
Business Placement
Foot Traffic Nearby
Dining 100%
Hardee's
Dining
6,685 visits/mo
0.4 miles
Demographics for 28054, NC
40,548
Population
18,351
Households
2.2
Avg Household Size
40
Median Age
25%
College-Educated
90%
High-School Grad
19.3 sq mi
ZIP Area
2,101
Density / Sq Mi
$59,524
Median Household Income
$39,883
Median Earnings
$1,150
Median Rent
$220,200
Median Home Value
Check the figures for this property
Cap Rate, Value Estimation, Potential NOI and more
View Realmo Analytics
Market
Vacancy Rate% for Retail in South region

Questions? Ask Rey
Realmo’s AI knows this listing — price, zoning, demand, history. Ask anything.





Similar Off Market Nearby
- Fine & Fancy Flowers Inc — 1204 S York St, Gastonia, NC 28052
Frequently Asked Questions
What type of property is this?
Storefront property - Vacant corner-lot storefront beside a convenience store with easy access.
Where is this storefront property located?
The property is located at 1501 S Marietta St Gastonia, NC.
What is the asking price?
The asking price for this property is $150,000.
What are key features of this property?
This property features: 1,000‑square‑foot vacant storefront building; Corner‑lot position at 1501 S Marietta St; Adjacent to a convenience store