Fourplex with Private
For Sale
$2,394,900
1501 Huntington Street, Huntington Beach, CA 92648
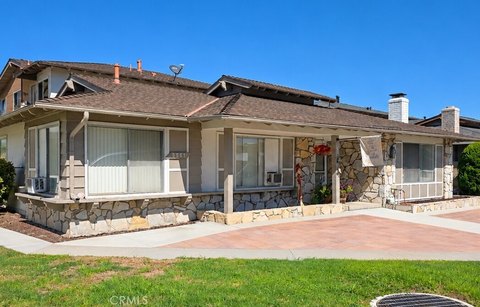
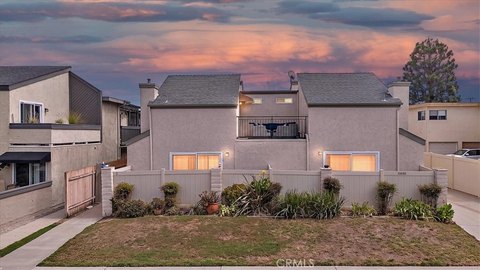
Four residential units offer fireplaces, private patios, and shared laundry access alongside individual garage parking.
Property Size3,861 SF
Days on Market55
Property Features for 1501 Huntington Street
General Information
Standard status
Active
Size
3,861 SF
Property subtype
Quadruplex
Units
Unit Mix
1 x 3BR/2BA, 2 x 2BR/2BA, 1 x 1BR/1BA
Multifamily Units
4
Additional Details
Road Access
Yes
Amenities
fireplaces
private patios
laundry room
Techwood gates
Building Details
Building Size
3,861 SF
Year Built
1974
Buildings
1
Tenancy
Multi
Listing Agency:
Landmark Realtors
Listed By:
Silvana Raiola · License #00411102
(949) 874-0456
Source:
Altamirarealty
Added: Aug 21
Changed: Oct 11
Last Checked: Oct 13 at 1:44AM
Displayed information is deemed reliable but is not guaranteed and should be independently verified. All listing content including descriptions, pricing, images are the copyrighted material of Landmark Realtors
Investment Insights
Based on property information with market context.
Built in 1974, this quadplex contains four residential units: one three-bedroom, two-bath residence and two two-bedroom, two-bath residences, plus a one-bedroom, one-bath unit. Every unit includes a fireplace and private patio. Techwood gates were recently installed, and the property provides a dedicated laundry room for three units. The three-bedroom unit also has an interior-accessible garage washer and dryer hookup.
Each residence is served by a single-car garage with an automatic roll-up door. The area in front of the garages accommodates two additional vehicles per door, with further street parking available along both sides of the corner parcel. The property sits at Oswego and Huntington in Huntington Beach. Three tenants have maintained long-term occupancy, while the one-bedroom unit is leased for one year; the remaining tenancies are month to month.
Each residence is served by a single-car garage with an automatic roll-up door. The area in front of the garages accommodates two additional vehicles per door, with further street parking available along both sides of the corner parcel. The property sits at Oswego and Huntington in Huntington Beach. Three tenants have maintained long-term occupancy, while the one-bedroom unit is leased for one year; the remaining tenancies are month to month.
Key Highlights
- Four‑unit mix: one 3‑bedroom/2‑bath, two 2‑bedroom/2‑bath, and one 1‑bedroom/1‑bath residences
- Built in 1974 with fireplaces and private patios for every unit
- Four single‑car garages with automatic roll‑up doors
Financial Insights
Estimated NOI and Cap Rate
NOI / Yr
$90,232
Cap Rate
3.77%
Suggested Prices Based on Cap Rates
Cap Rate 5%
$1,804,640
$1.8M
Cap Rate 7%
$1,289,029
$1.3M
Cap Rate 9%
$1,002,578
$1.0M
Market Conditions
NOI Build-Up for 3,861 SF
Gross rent
$132.0K $34.20/SF
− Vacancy
−$3.1K −$0.81/SF
EGI
$128.9K $33.39/SF
− OpEx
−$38.7K −$10.02/SF
NOI
$90.2K $23.37/SF
Area
Huntington Beach, CA
Vacancy
2.38%
Lease Rate
$34.20 /SF/Yr
Expense Ratio
30.00%
Simulate Cap Rate and NOI
Suggested Prices Based on Cap Rates
Cap Rate 5%
$1,804,640
Cap Rate 7%
$1,289,029
Cap Rate 9%
$1,002,578
Alternative Uses
Best Use
Multifamily LT 5
$1.29M
$1.13M – $1.50M
NOI $90,232 @ 7.0% cap · market cap 3.77%
Second Best
Apartment 5plus
$1.19M
$1.04M – $1.39M
NOI $83,233 @ 7.0% cap · market cap 3.48%
Theoretical Best
Specialty Retail
$1.33M
$1.17M – $1.56M
NOI $93,405 @ 7.0% cap · market cap 3.90%
Zoning and permitted uses should be independently verified with authorities.
How Realmo checks its estimates
Property Analytics
Unlock full access to Insights
Subscribe to Realmo Intelligence
Open Analytics
Current Use
Lease Details
4
Residential units
Multi-tenant
Tenancy
Yes
Paved road access
Location Intelligence
Trade Area within ½ mile
1,297
Businesses Nearby
Explore this area
Business Placement
Demographics for 92648, CA
46,691
Population
21,609
Households
2.2
Avg Household Size
44
Median Age
51%
College-Educated
95%
High-School Grad
8.0 sq mi
ZIP Area
5,836
Density / Sq Mi
$118,993
Median Household Income
$73,049
Median Earnings
$2,324
Median Rent
$1,176,000
Median Home Value
Check the figures for this property
Cap Rate, Value Estimation, Potential NOI and more
View Realmo Analytics
Market
Vacancy Rate% for Multifamily in West region

Questions? Ask Rey
Realmo’s AI knows this listing — price, zoning, demand, history. Ask anything.






Frequently Asked Questions
What type of property is this?
Quadplex - Four residential units offer fireplaces, private patios, and shared laundry access alongside individual garage parking.
Where is this quadplex located?
The property is located at 1501 Huntington Street Huntington Beach, CA.
What is the asking price?
The asking price for this property is $2,394,900.
What are key features of this property?
This property features: Four‑unit mix: one 3‑bedroom/2‑bath, two 2‑bedroom/2‑bath, and one 1‑bedroom/1‑bath residences; Built in 1974 with fireplaces and private patios for every unit; Four single‑car garages with automatic roll‑up doors


