Mixed-Use Property with Office
For Sale
Contact for pricing
Pending
150 N SWINTON AVE, Delray Beach, FL 33444
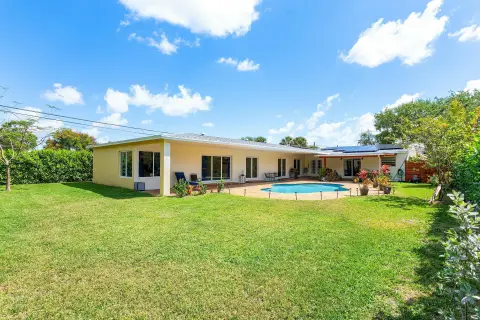
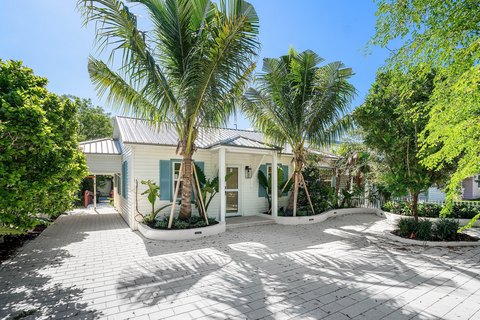
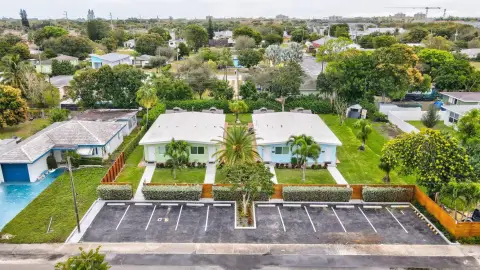
Occupied office and residential spaces support a flexible downtown mixed-use configuration.
Property Size5,569 SF
Lot Size0.25 Acres
Days on Market176
Property Features for 150 N SWINTON AVE
General Information
Standard status
Pending
Size
5,569 SF
Lot size
0.25 Acres
Property subtype
Mixed Use
Zoning
OSSHAD
Occupancy
100%
Lease Type
Net
Investment Type
Value Add
Net Operating Income
$264,290
Units
Multifamily Units
2
Office Units
2
Building Details
Year Built
1999
Buildings
1
Stories
2
Units
8
Building Size
5,569 SF
Tenancy
Multi
Owner Occupied
Yes
Listing Agency:
Marcus & Millichap - Fort Lauderdale
Listed By:
Brian Rosen · License #FL SL 3189020
(954) 245-3513
Source:
Crexi
Added: Apr 24
Changed: Sep 10
Last Checked: Oct 16 at 6:39AM
Displayed information is deemed reliable but is not guaranteed and should be independently verified. All listing content including descriptions, pricing, images are the copyrighted material of Marcus & Millichap - Fort Lauderdale

Ask AI about this property
Review the available facts, identify missing information and prepare questions for the agent.
Investment Insights
Based on property information with market context.
Built in 1999 on a quarter-acre parcel, this mixed-use property combines two office suites with two residential apartments. All four spaces are occupied, providing an established operating profile across commercial and residential components.
At closing, the larger office suite will be vacated, while the smaller suite is expected to remain under a 12-month market-rent SF NNN leaseback. The apartments are leased month-to-month, offering flexibility in future residential leasing decisions. The property sits directly across from Old School Square and within walking distance of Atlantic Avenue’s restaurants, retail, nightlife, and hospitality uses. Its Downtown Delray Beach setting also places it within an area experiencing continued redevelopment and demand for mixed-use and live-work space.
At closing, the larger office suite will be vacated, while the smaller suite is expected to remain under a 12-month market-rent SF NNN leaseback. The apartments are leased month-to-month, offering flexibility in future residential leasing decisions. The property sits directly across from Old School Square and within walking distance of Atlantic Avenue’s restaurants, retail, nightlife, and hospitality uses. Its Downtown Delray Beach setting also places it within an area experiencing continued redevelopment and demand for mixed-use and live-work space.
Key Highlights
- Mixed‑use property with 2 office suites and 2 residential apartments
- Quarter‑acre parcel with all 4 spaces currently occupied
- Larger office suite to be vacated at closing
Financial Insights
Estimated NOI and Cap Rate
NOI / Yr
$143,631
Cap Rate
4.42%
Suggested Prices Based on Cap Rates
Cap Rate 5%
$2,872,620
$2.9M
Cap Rate 7%
$2,051,871
$2.1M
Cap Rate 9%
$1,595,900
$1.6M
Market Conditions
NOI Build-Up for 5,419 SF
Gross rent
$247.1K $45.60/SF
− Vacancy
−$55.6K −$10.26/SF
EGI
$191.5K $35.34/SF
− OpEx
−$47.9K −$8.84/SF
NOI
$143.6K $26.51/SF
Area
Palm Beach County, FL
Vacancy
22.50%
Lease Rate
$45.60 /SF/Yr
Expense Ratio
25.00%
Simulate Cap Rate and NOI
Suggested Prices Based on Cap Rates
Cap Rate 5%
$2,872,620
Cap Rate 7%
$2,051,871
Cap Rate 9%
$1,595,900
Alternative Uses
Best Use
Office B
$2.05M
$1.80M – $2.39M
NOI $143,631 @ 7.0% cap · market cap 4.42%
Second Best
Mixed Use
$1.34M
$1.17M – $1.56M
NOI $93,478 @ 7.0% cap · market cap 2.88%
Theoretical Best
Office A
$3.82M
$3.34M – $4.45M
NOI $267,145 @ 7.0% cap · market cap 8.22%
Zoning and permitted uses should be independently verified with authorities.
How Realmo checks its estimates
Property Analytics
Unlock full access to Insights
Subscribe to Realmo Intelligence
Open Analytics
Current Use
Lease Details
2
Office units
2
Residential units
100%
Occupancy
Multi-tenant
Tenancy
Location Intelligence
Trade Area within ½ mile
3,408
Businesses Nearby
Explore this area
Business Placement
Demographics for 33444, FL
22,671
Population
10,469
Households
2.2
Avg Household Size
41
Median Age
33%
College-Educated
84%
High-School Grad
5.0 sq mi
ZIP Area
4,534
Density / Sq Mi
$74,803
Median Household Income
$37,915
Median Earnings
$1,712
Median Rent
$425,200
Median Home Value
Check the figures for this property
Cap Rate, Value Estimation, Potential NOI and more
View Realmo Analytics
Market
Vacancy Rate% for Office in South region




Frequently Asked Questions
What type of property is this?
Mixed-use property - Occupied office and residential spaces support a flexible downtown mixed-use configuration.
Where is this mixed-use property located?
The property is located at 150 N SWINTON AVE Delray Beach, FL.
What is the asking price?
The asking price for this property is $3,250,000.
What are key features of this property?
This property features: Mixed‑use property with 2 office suites and 2 residential apartments; Quarter‑acre parcel with all 4 spaces currently occupied; Larger office suite to be vacated at closing