Renovated Four-Story Restaurant
For Sale
$790,000
15 E Centre St, Baltimore, MD 21202
Renovated restaurant and entertainment property with multiple dining levels, commercial kitchen, bars, offices, and storage.
Property Size5,625 SF
Lot Size0.05 Acres
Price / SF$140.44
Days on Market48
Property Features for 15 E Centre St
General Information
Standard status
Active
Size
5,625 SF
Lot size
0.05 Acres
Zoning
OR-2
Site & Location
Neighborhood
Mount Vernon
Frontage
19 ft
Highway Access
Yes
Road Access
Yes
Restaurant
Commercial Hood
Yes
Equipment Included
Yes
Additional Details
Furnished
Yes
Building Details
Year Built
1900
Buildings
1
Stories
4
Construction
masonry
Listing Agency:
Berkshire Hathaway HomeServices Homesale Realty
Listed By:
Jonathan J Mester · License #666532
(410) 292-8430
Source:
Baltimorehousesale
Added: Sep 7
Changed: Oct 5
Last Checked: Oct 7 at 3:14PM
Displayed information is deemed reliable but is not guaranteed and should be independently verified. All listing content including descriptions, pricing, images are the copyrighted material of Berkshire Hathaway HomeServices Homesale Realty

Ask AI about this property
Review the available facts, identify missing information and prepare questions for the agent.
Investment Insights
Based on property information with market context.
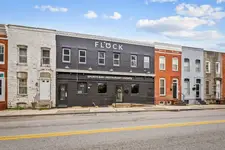
This renovated four-story masonry restaurant property at 15 E Centre St includes approximately 5,800 square feet of gross leasable area, with approximately 5,625 square feet above grade. The first level combines bar service, restaurant seating, and a commercial kitchen with hood. A second bar and additional dining areas occupy the second level, while the third floor provides entertainment and lounge space. The fourth floor contains offices, a break area, and storage, with further storage and a walk-in cooler in the basement. Furniture, fixtures, and equipment convey with the property.
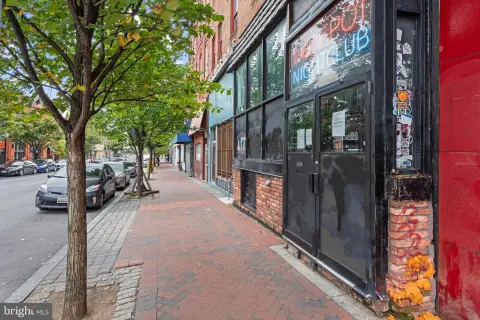
The building offers 19 feet of frontage on E Centre St and a depth of 108 feet within Baltimore City's Mount Vernon Historic District. It is zoned OR-2, with a commercial site influence. The property is directly across from the Peabody Conservatory and is located near Light Rail, downtown Baltimore, I-83, I-95, Baltimore Penn Station, and major cultural and institutional destinations.
The building offers 19 feet of frontage on E Centre St and a depth of 108 feet within Baltimore City's Mount Vernon Historic District. It is zoned OR-2, with a commercial site influence. The property is directly across from the Peabody Conservatory and is located near Light Rail, downtown Baltimore, I-83, I-95, Baltimore Penn Station, and major cultural and institutional destinations.
Key Highlights
- Approximately 5,800 SF GLA, including approximately 5,625 sq ft above grade
- Renovated four‑story masonry restaurant and entertainment building
- 19' frontage on E Centre St with a 108' depth
Financial Insights
Estimated NOI and Cap Rate
NOI / Yr
$31,057
Cap Rate
3.93%
Suggested Prices Based on Cap Rates
Cap Rate 5%
$621,140
$621.1K
Cap Rate 7%
$443,671
$443.7K
Cap Rate 9%
$345,078
$345.1K
Market Conditions
NOI Build-Up for 5,625 SF
Gross rent
$47.3K $8.40/SF
− Vacancy
−$2.9K −$0.51/SF
EGI
$44.4K $7.89/SF
− OpEx
−$13.3K −$2.37/SF
NOI
$31.1K $5.52/SF
Area
Baltimore, MD
Vacancy
6.10%
Lease Rate
$8.40 /SF/Yr
Expense Ratio
30.00%
Simulate Cap Rate and NOI
Suggested Prices Based on Cap Rates
Cap Rate 5%
$621,140
Cap Rate 7%
$443,671
Cap Rate 9%
$345,078
Alternative Uses
Best Use
Specialty Retail
$1.30M
$1.14M – $1.51M
NOI $90,897 @ 7.0% cap · market cap 11.51%
Second Best
Industrial
$443.7K
$388.2K – $517.6K
NOI $31,057 @ 7.0% cap · market cap 3.93%
Theoretical Best
Office A
$1.35M
$1.18M – $1.57M
NOI $94,332 @ 7.0% cap · market cap 11.94%
Zoning and permitted uses should be independently verified with authorities.
How Realmo checks its estimates
Property Analytics
Who owns this building?
See the owner, sales and loan history
Open Analytics
Current Use
Lease Details
Yes
Highway access
Yes
Paved road access
Yes
Commercial hood
Location Intelligence
Trade Area within ½ mile
12,119
Businesses Nearby
Under-served
Demand for This Use
Explore this area
Business Placement
Demographics for 21202, MD
22,247
Population
12,731
Households
1.7
Avg Household Size
33
Median Age
48%
College-Educated
86%
High-School Grad
1.6 sq mi
ZIP Area
13,904
Density / Sq Mi
$61,578
Median Household Income
$53,609
Median Earnings
$1,497
Median Rent
$307,700
Median Home Value
Check the figures for this property
Cap Rate, Value Estimation, Potential NOI and more
View Realmo Analytics
Market
Vacancy Rate% for Retail in Baltimore, MD





Similar Off Market Nearby
- Picnic Perch — Baltimore, MD 21201
Frequently Asked Questions
What type of property is this?
Conventional restaurant - Renovated restaurant and entertainment property with multiple dining levels, commercial kitchen, bars, offices, and storage.
Where is this conventional restaurant located?
The property is located at 15 E Centre St Baltimore, MD.
What is the asking price?
The asking price for this property is $790,000.
What are key features of this property?
This property features: Approximately 5,800 SF GLA, including approximately 5,625 sq ft above grade; Renovated four‑story masonry restaurant and entertainment building; 19' frontage on E Centre St with a 108' depth



