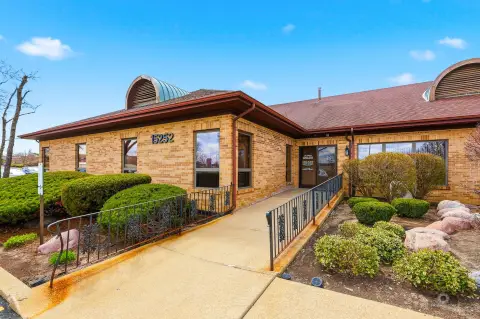
Two-Story Office Building with Natural
For Sale
$4,400,000
14489 John Humphrey Dr, Orland Park, IL 60462
Professional office property with central air, extensive glazing, and parking in Orland Park’s medical corridor.
Property Size20,000 SF
Price / SF$220
Days on Market174
Property Features for 14489 John Humphrey Dr
General Information
Standard status
Active
Size
20,000 SF
Building Details
Year Built
2005
Listing Agency:
Coldwell Banker Realty
Listed By:
Rocco Zaccaro · License #475179214
(630) 207-4434
Source:
Grandviewrealtyservices
Added: Apr 24
Changed: Sep 2
Last Checked: Oct 7 at 2:52PM
Displayed information is deemed reliable but is not guaranteed and should be independently verified. All listing content including descriptions, pricing, images are the copyrighted material of Coldwell Banker Realty
Investment Insights
Based on property information with market context.
This two-story professional office building was constructed in 2005 and includes central air, large windows around the building, and ample parking. The property includes office and medical space, with interior finishes that include solid mahogany doors, wainscoting, and double glass entry doors in one finished suite.
Located on John Humphrey Drive in Orland Park, the property is positioned within the community’s medical corridor and offers access to major thoroughfares. The combination of office functionality, medical-use configuration, natural light, and established interior improvements supports a range of professional occupancy options.
Located on John Humphrey Drive in Orland Park, the property is positioned within the community’s medical corridor and offers access to major thoroughfares. The combination of office functionality, medical-use configuration, natural light, and established interior improvements supports a range of professional occupancy options.
Key Highlights
- Two‑story professional office building constructed in 2005
- Central air conditioning
- Large windows wrap the building and provide natural light
Financial Insights
Estimated NOI and Cap Rate
NOI / Yr
$275,767
Cap Rate
6.27%
Suggested Prices Based on Cap Rates
Cap Rate 5%
$5,515,340
$5.5M
Cap Rate 7%
$3,939,529
$3.9M
Cap Rate 9%
$3,064,078
$3.1M
Market Conditions
NOI Build-Up for 20,000 SF
Gross rent
$489.6K $24.48/SF
− Vacancy
−$121.9K −$6.10/SF
EGI
$367.7K $18.38/SF
− OpEx
−$91.9K −$4.60/SF
NOI
$275.8K $13.79/SF
Area
Cook County, IL
Vacancy
24.90%
Lease Rate
$24.48 /SF/Yr
Expense Ratio
25.00%
Simulate Cap Rate and NOI
Suggested Prices Based on Cap Rates
Cap Rate 5%
$5,515,340
Cap Rate 7%
$3,939,529
Cap Rate 9%
$3,064,078
Alternative Uses
Best Use
Office B
$3.94M
$3.45M – $4.60M
NOI $275,767 @ 7.0% cap · market cap 6.27%
Second Best
Healthcare Medical
$3.79M
$3.31M – $4.42M
NOI $264,960 @ 7.0% cap · market cap 6.02%
Theoretical Best
Office A
$6.91M
$6.04M – $8.06M
NOI $483,356 @ 7.0% cap · market cap 10.99%
Zoning and permitted uses should be independently verified with authorities.
How Realmo checks its estimates
Property Analytics
Current Use
Location Intelligence
Trade Area within ½ mile
1,761
Businesses Nearby
Explore this area
Business Placement
Demographics for 60462, IL
40,539
Population
17,335
Households
2.3
Avg Household Size
45
Median Age
45%
College-Educated
94%
High-School Grad
16.0 sq mi
ZIP Area
2,534
Density / Sq Mi
$96,747
Median Household Income
$52,902
Median Earnings
$1,393
Median Rent
$330,400
Median Home Value
Market
Vacancy Rate% for Office in Midwest region

Questions? Ask Rey
Realmo’s AI knows this listing — price, zoning, demand, history. Ask anything.




Frequently Asked Questions
What type of property is this?
Office building - Professional office property with central air, extensive glazing, and parking in Orland Park’s medical corridor.
Where is this office building located?
The property is located at 14489 John Humphrey Dr Orland Park, IL.
What is the asking price?
The asking price for this property is $4,400,000.
What are key features of this property?
This property features: Two‑story professional office building constructed in 2005; Central air conditioning; Large windows wrap the building and provide natural light