Victorian 3-Unit
For Sale
$449,000
1423 N Main Street, Honesdale, PA 18431
Residential Income, Honesdale, PA
Property Size3,600 SF
Lot Size0.16 Acres
Price / SF$124.72
Days on Market48
Property Features for 1423 N Main Street
General Information
Property type
Residential Multi Family
Property subtype
Other
Zoning description
Commercial
Bedrooms
5
Bathrooms
3
Full bathrooms
3
Rooms
Bathroom 2, Basement, Bedroom 5, Bedroom 1, Bedroom 2, Bathroom 3, Bedroom 3, Bedroom 4, Bathroom 1
Parking features
Off Street, Garage
Interior features
High Ceilings, Laminate Counters
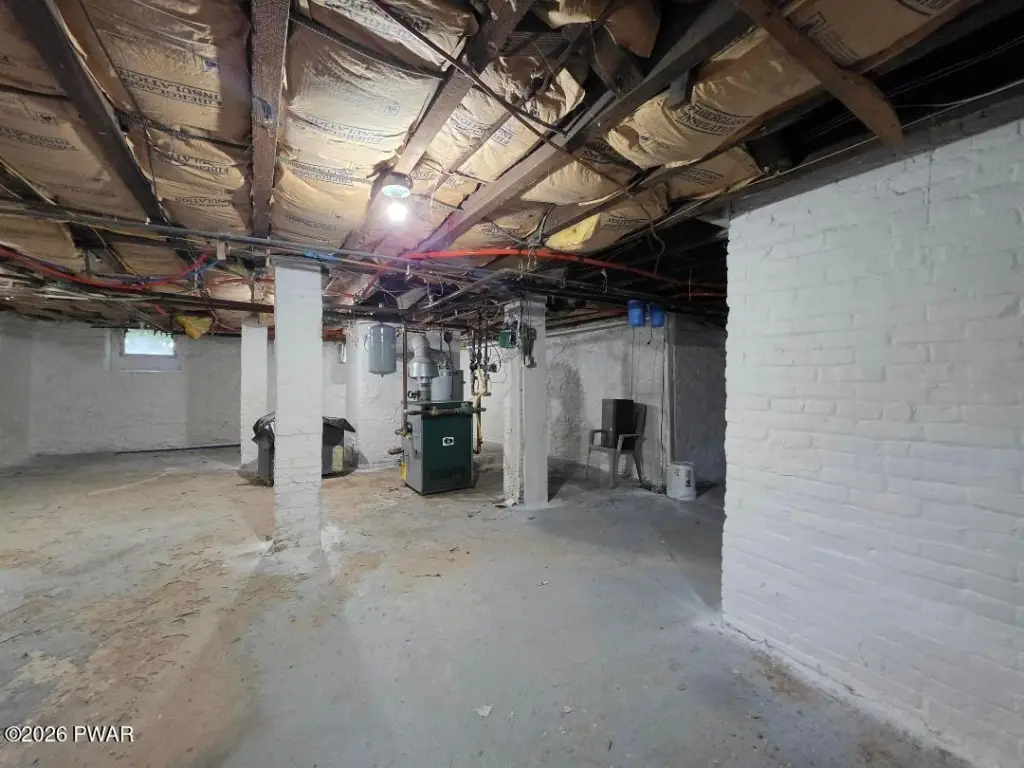
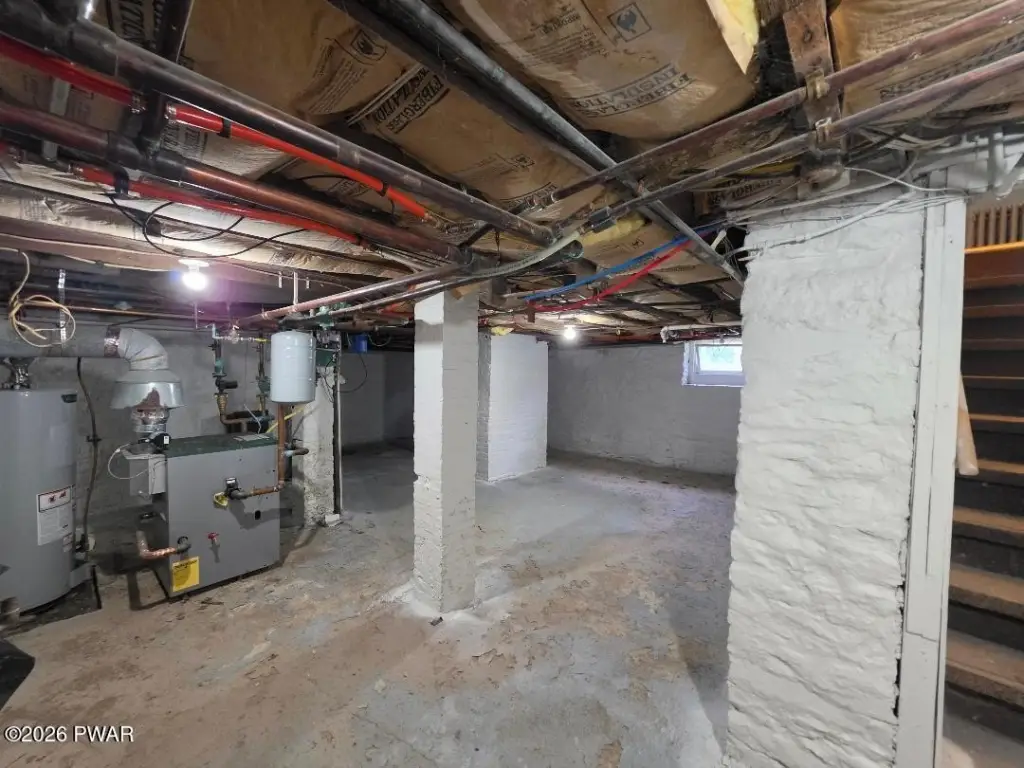
Basement
Block
Appliances
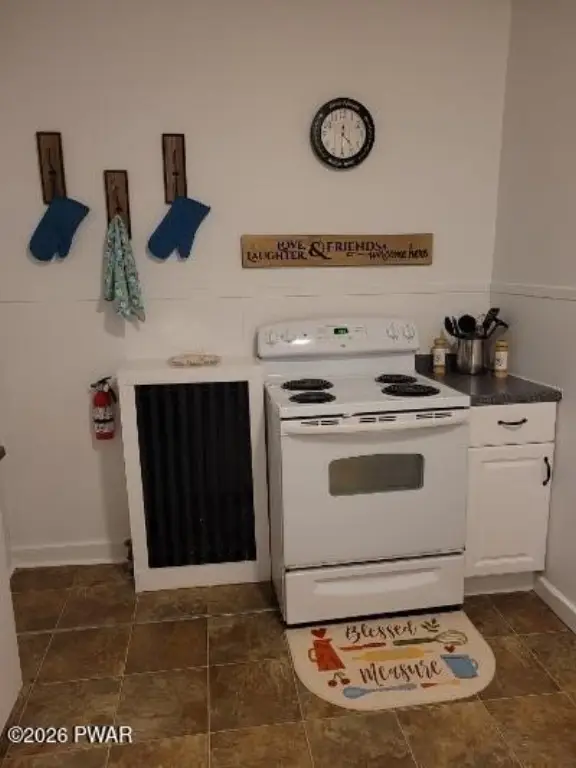
Dishwasher, Refrigerator, Free-Standing Electric Range, Free-Standing Electric Oven
Lot features
Corner Lot, Open Lot, Level
Elementary school district
Wayne Highlands
Middle school district
Wayne Highlands
High school district
Wayne Highlands
Directions
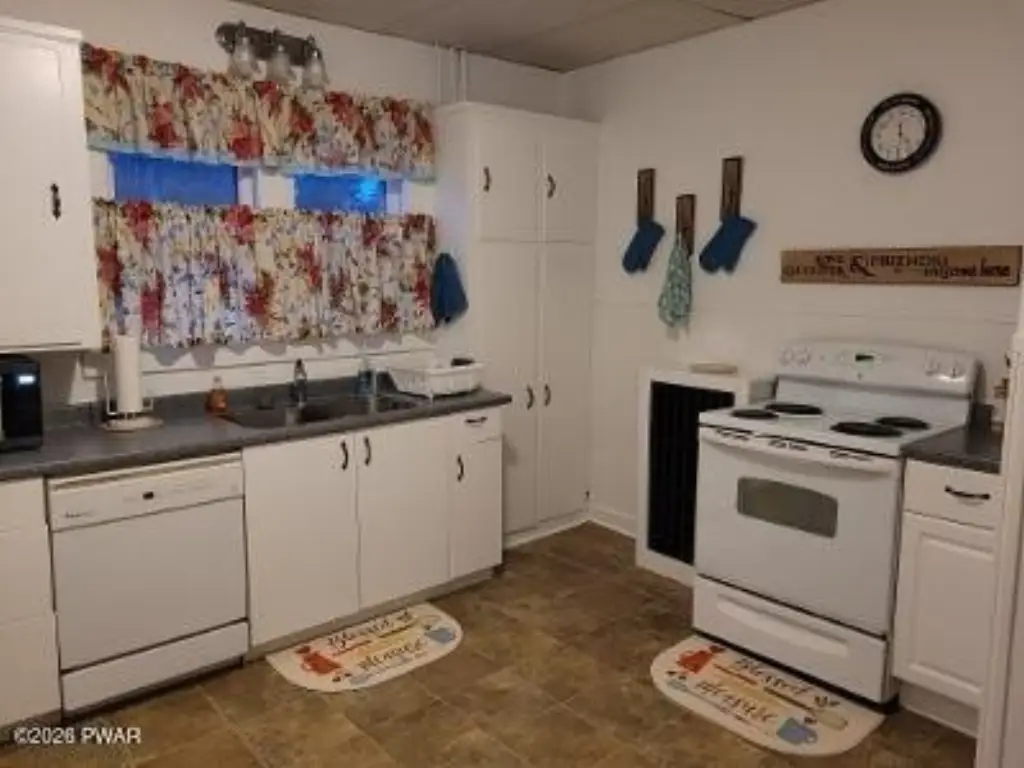
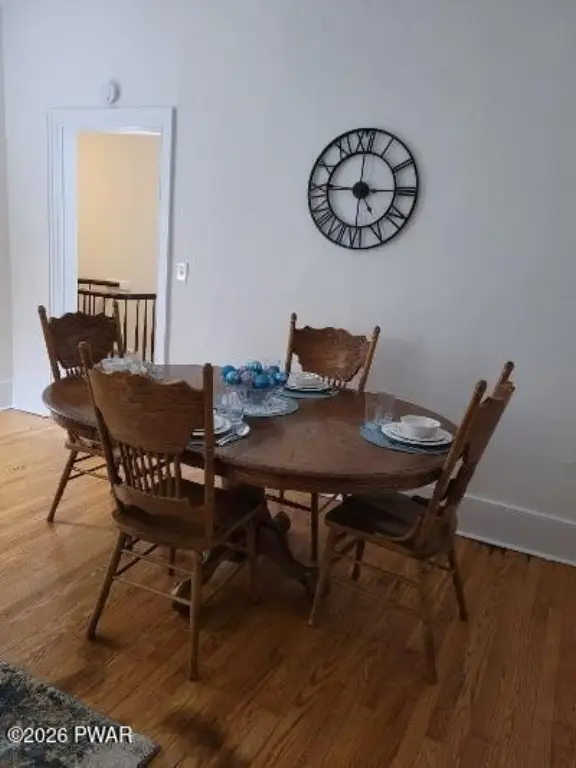
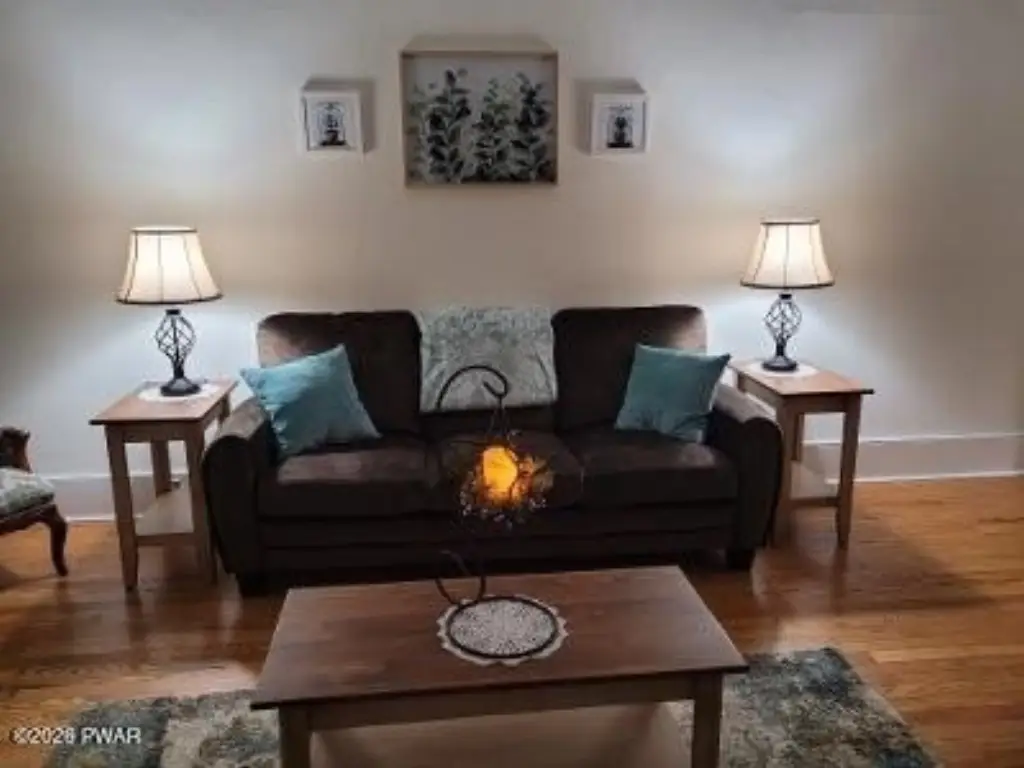
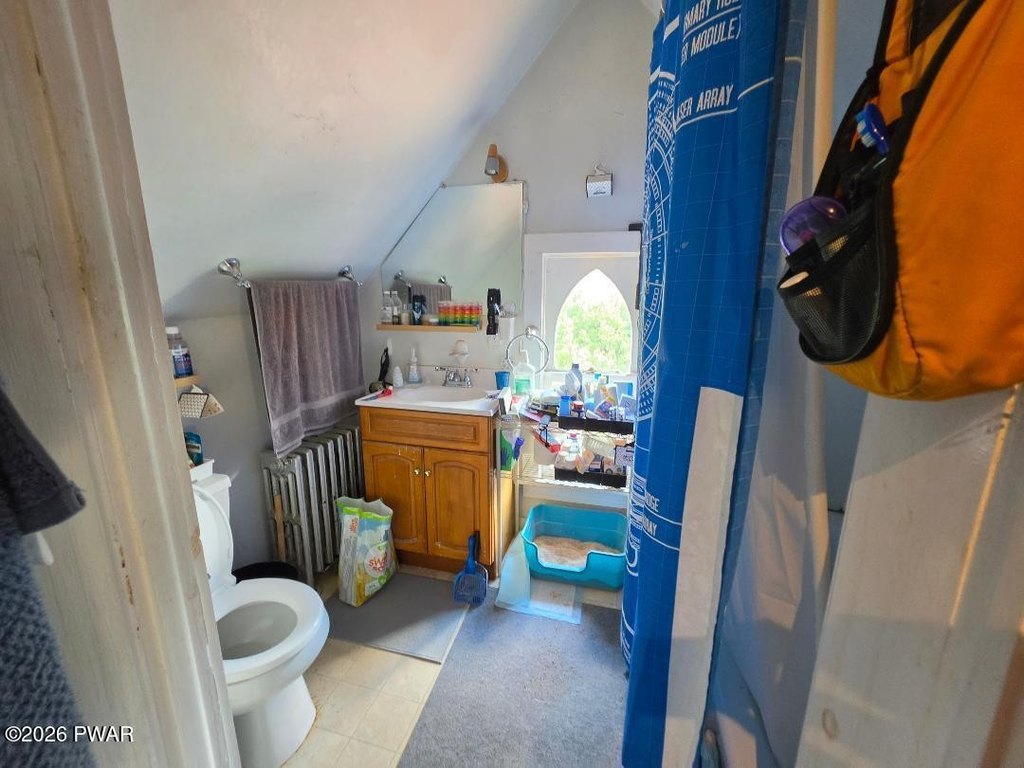
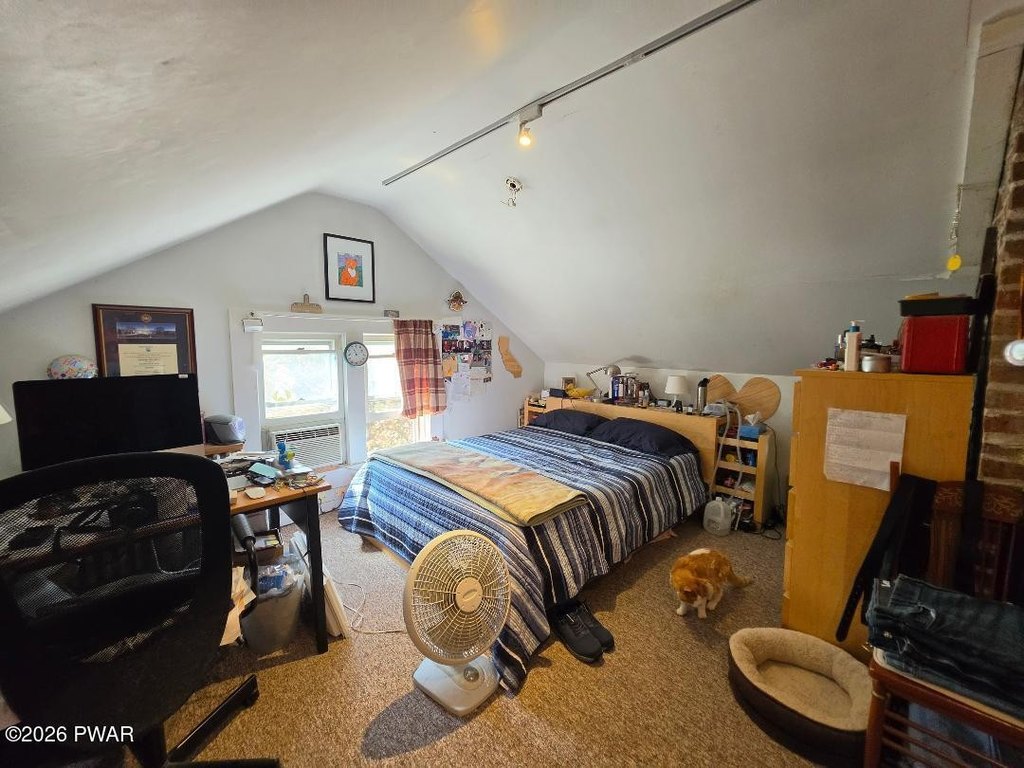
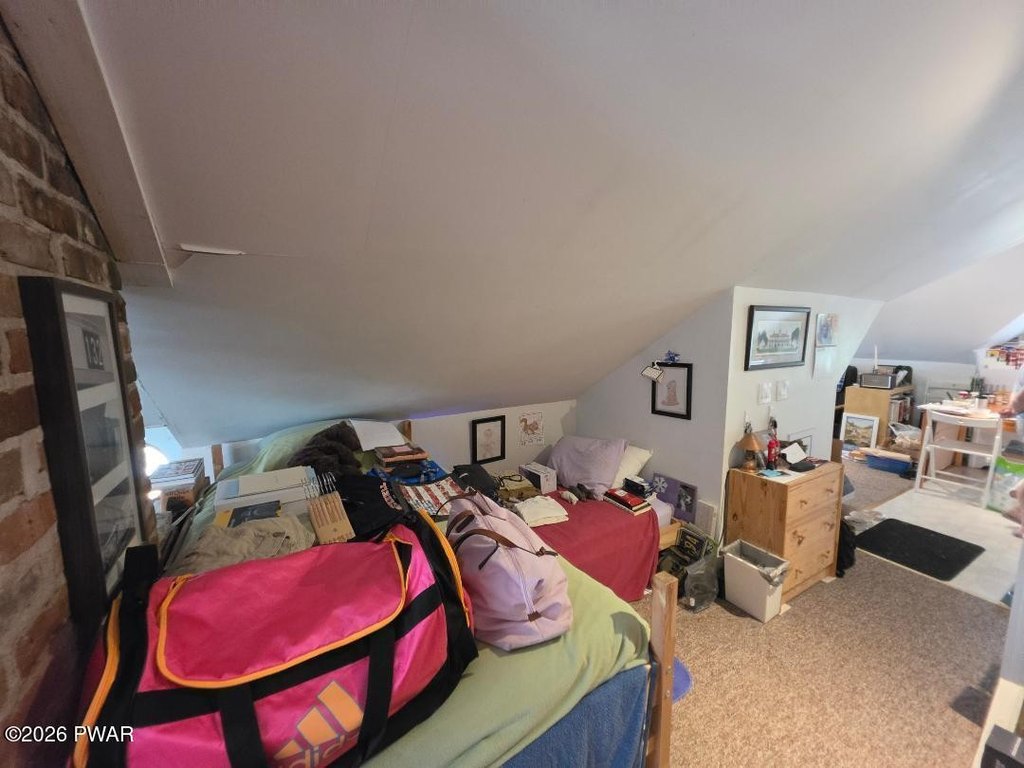
Through honesdale to north main heading towards fair grounds home on right corner of north main (191) and 15th street2nd floor apartment can only be shown if the buyers fully intend on purchasing. 1st and 3rd floor apts and basement wont be an issue.Please have your buyers look at pictures of 2nd floor which is exactly how it looks. They are major germ a phobes!
Standard status
Active
APN
11-0-0003-0084
Size
3,600 SF
Lot size
0.16 Acres
Taxes and HOA fees
Tax Annual Amount
5286
Utilities
Utilities
Cable Available
Sewer type
Public Sewer
Heating system
Hot Water(Heating), Radiant, Natural Gas
Water source
Public
Building Details
Year built
1869
Floors in Building
3
Number of units
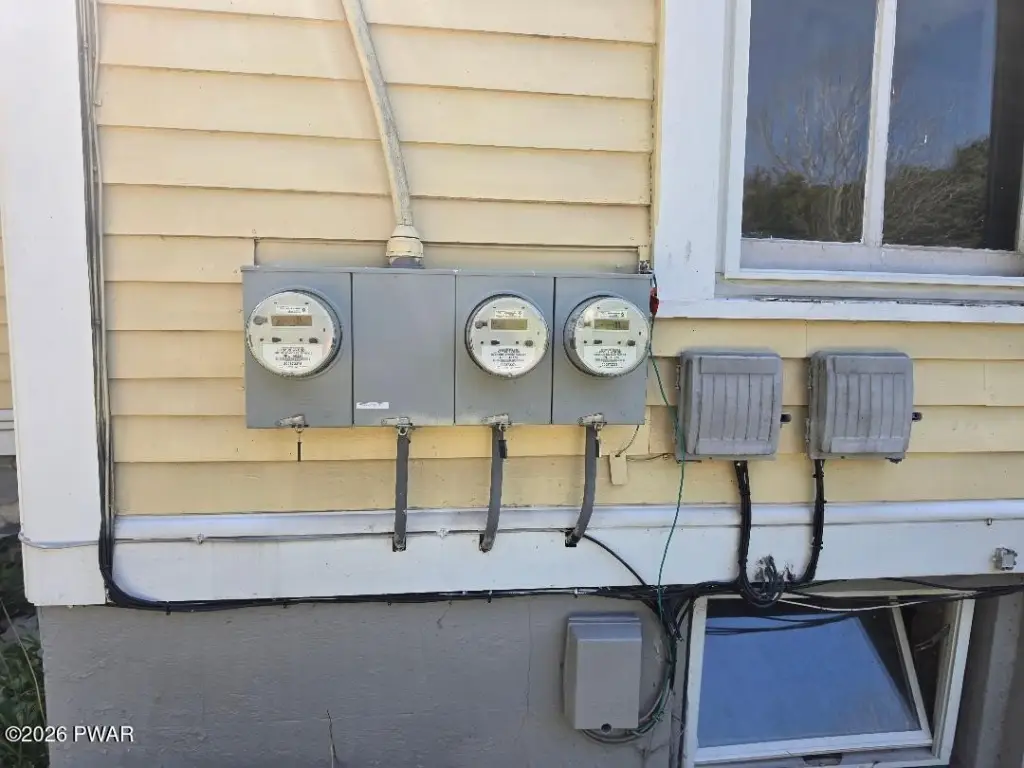
3
Flooring type
Vinyl, Hardwood
Building materials
Cedar
Roof type
Fiberglass
Architectural style
Victorian
Listing Agency:
Iron Valley R E Innovate
(570) 390-1500
Listed By:
Joseph A Scarpaci, E-PRO,SFR
(570) 499-0185
Added: Sep 3
Changed: Sep 17
Last Checked: Oct 20 at 7:06AM
MLS# PW-263077
Copyright © 2026 Pike/Wayne Association of Realtors MLS. All rights reserved. All information provided by the listing agent/broker is deemed reliable but is not guaranteed and should be independently verified.

Ask AI about this property
Review the available facts, identify missing information and prepare questions for the agent.
Investment Insights
Based on property information with market context.
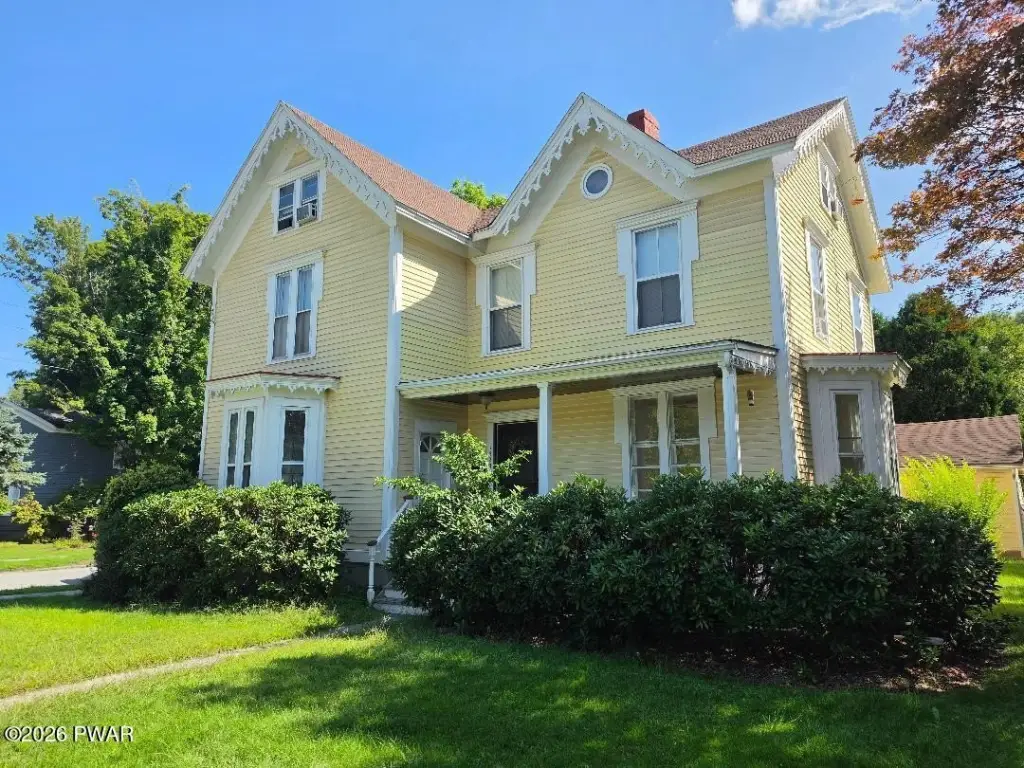
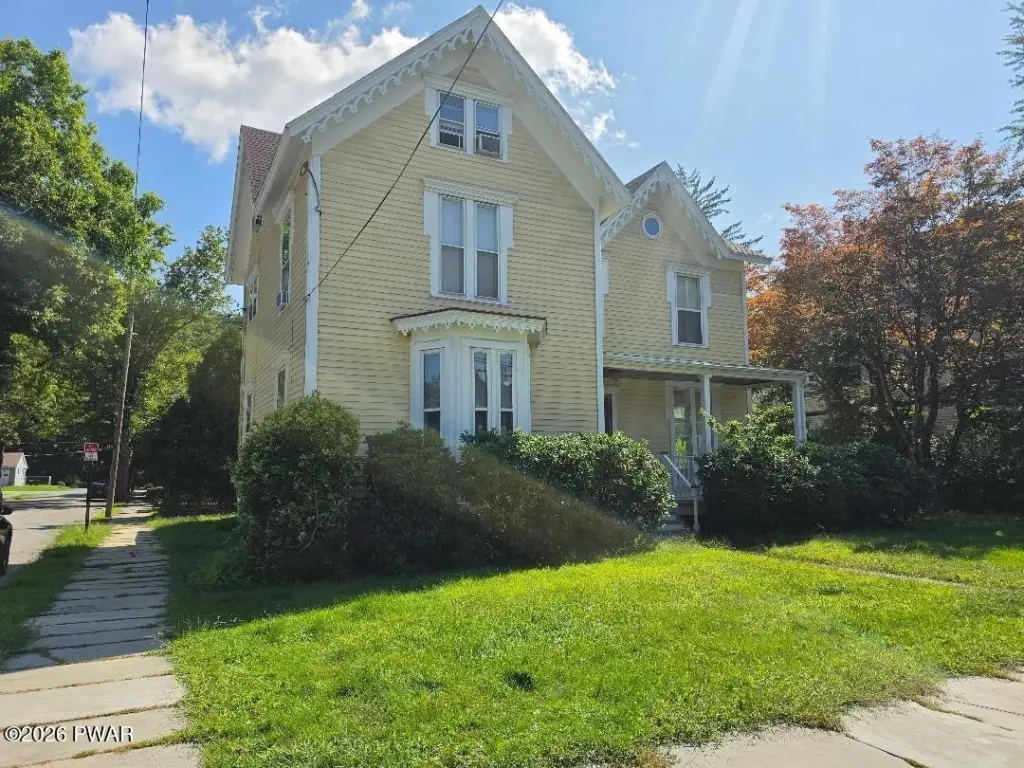
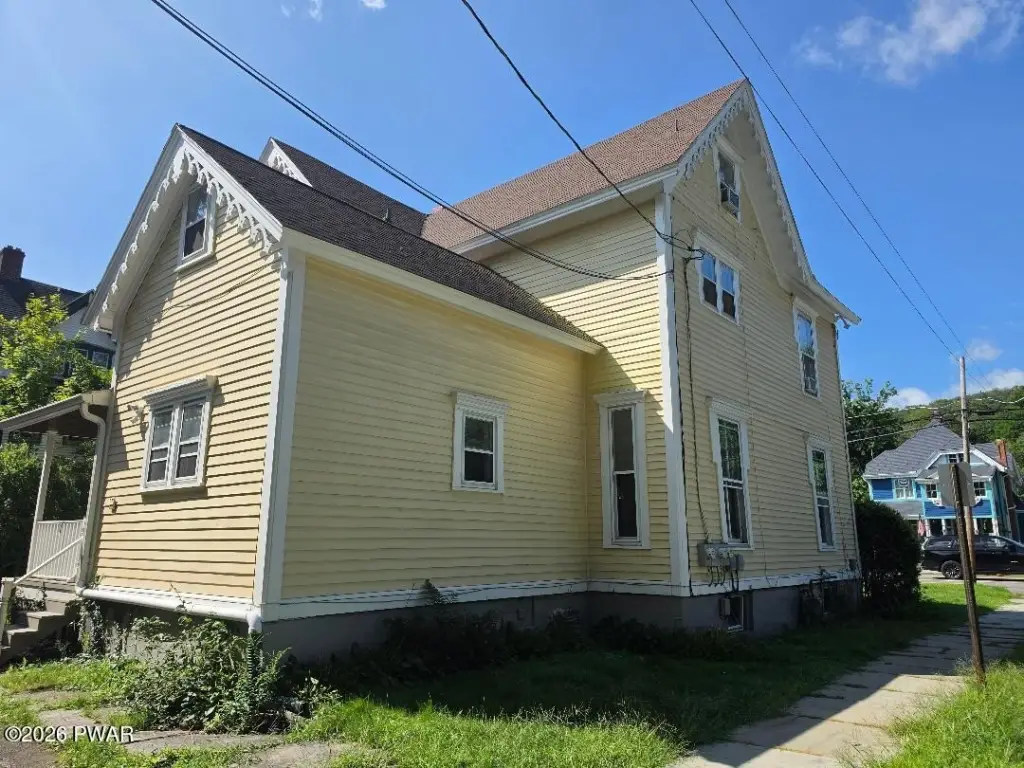
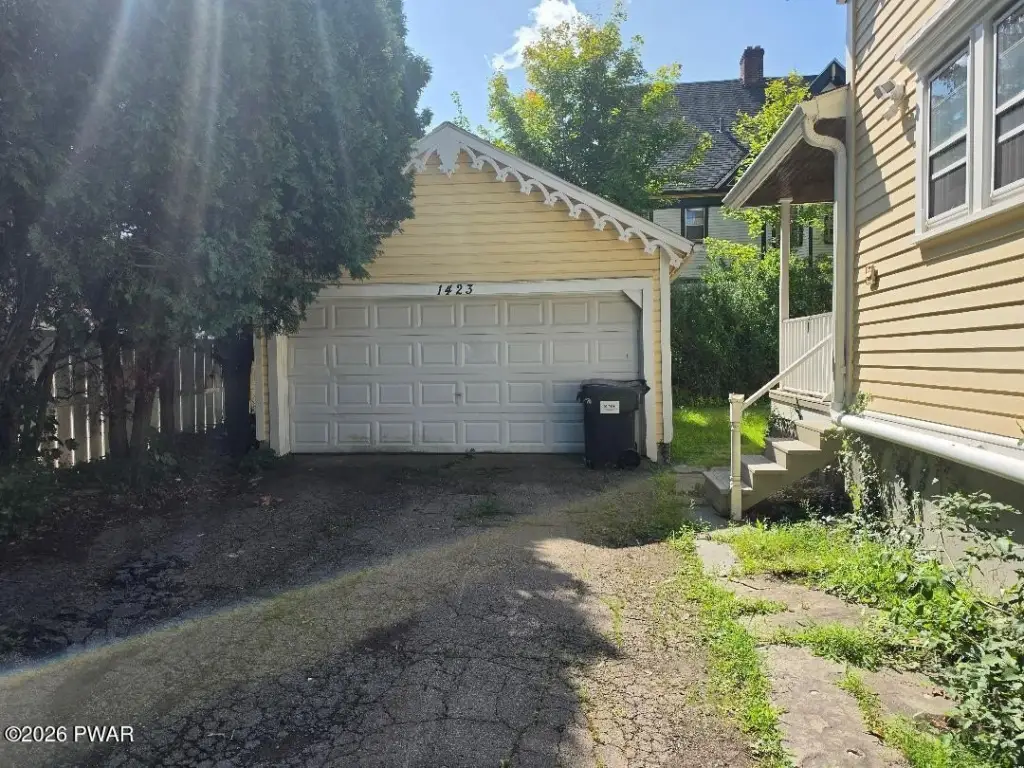
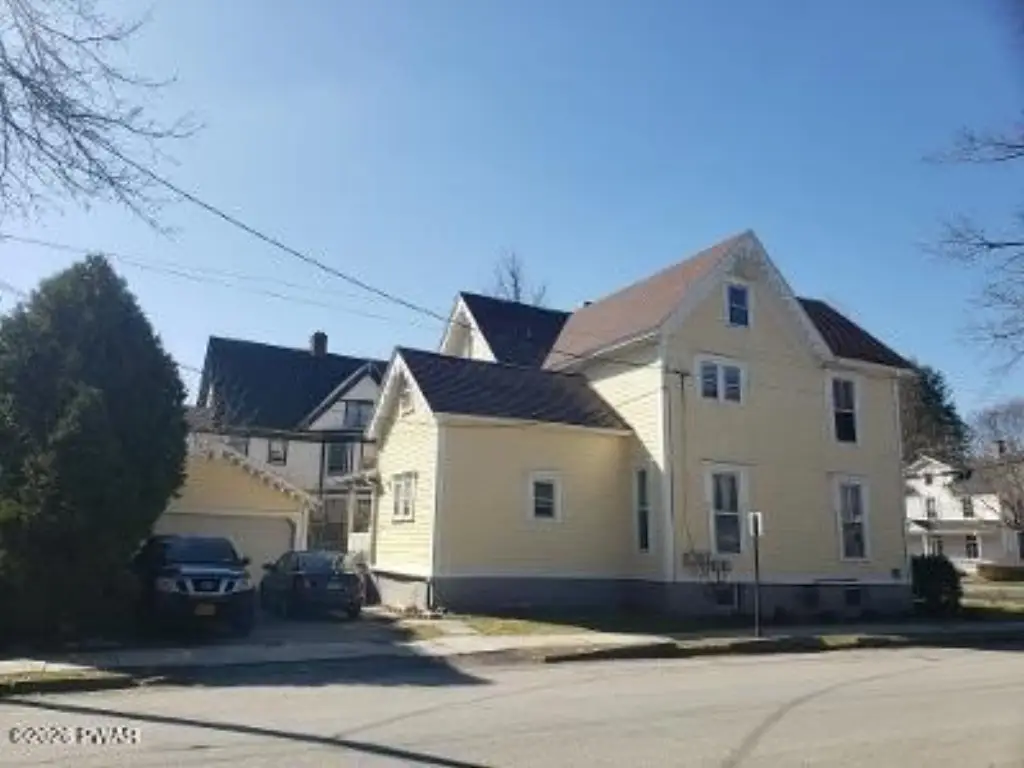
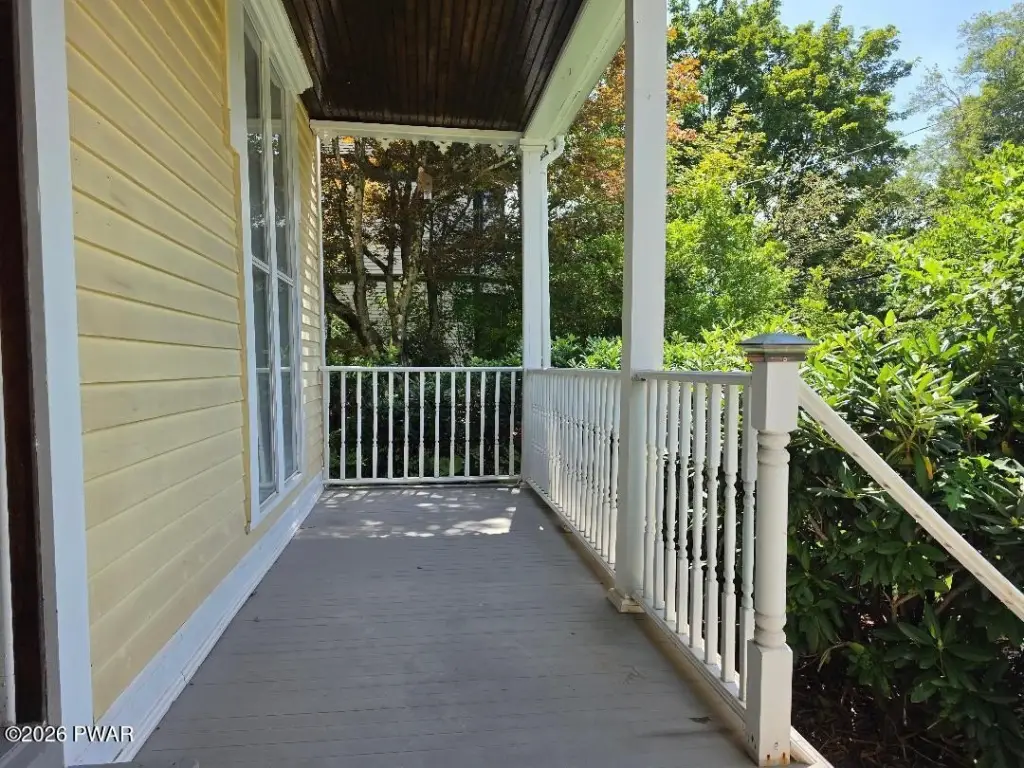
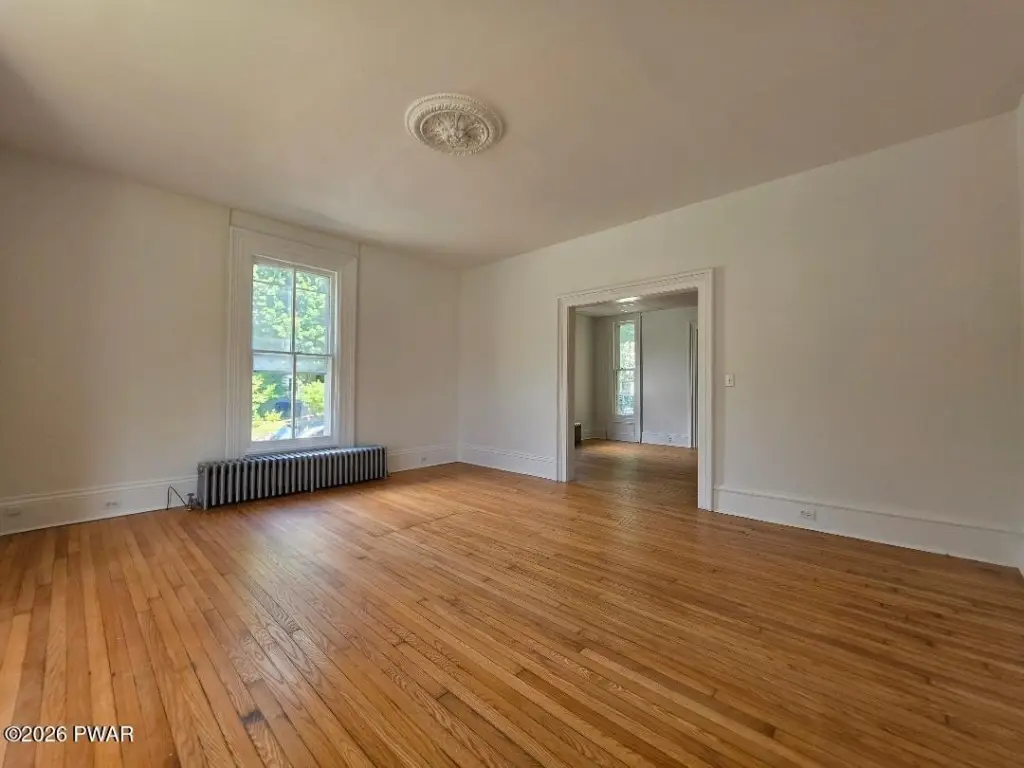
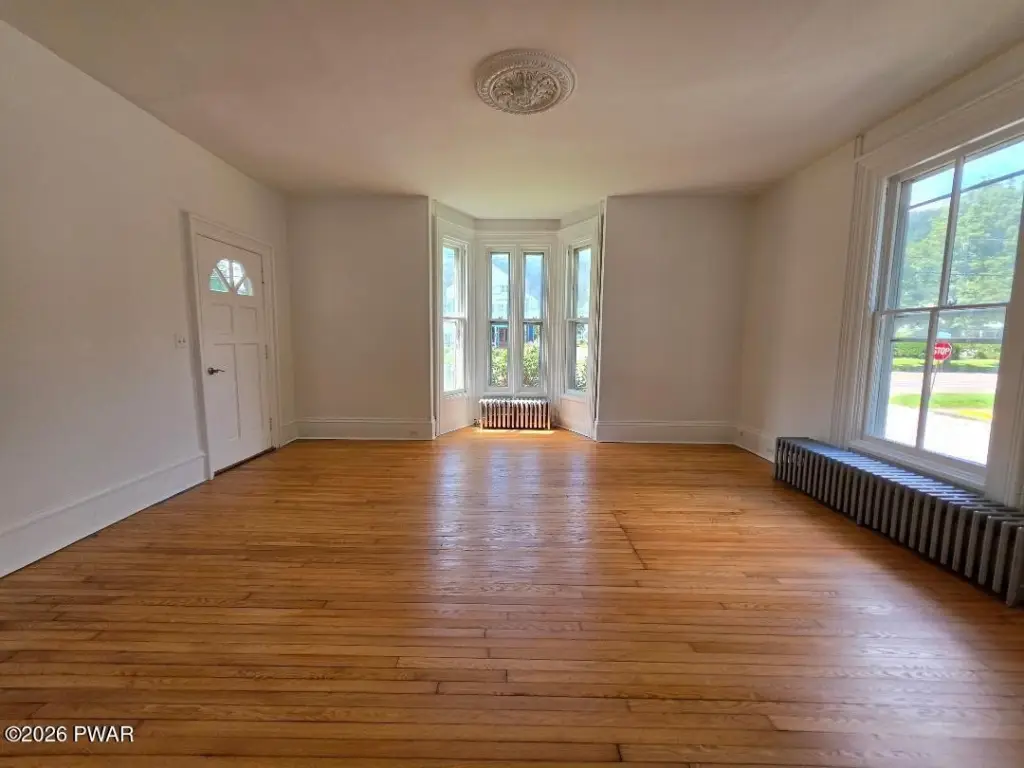
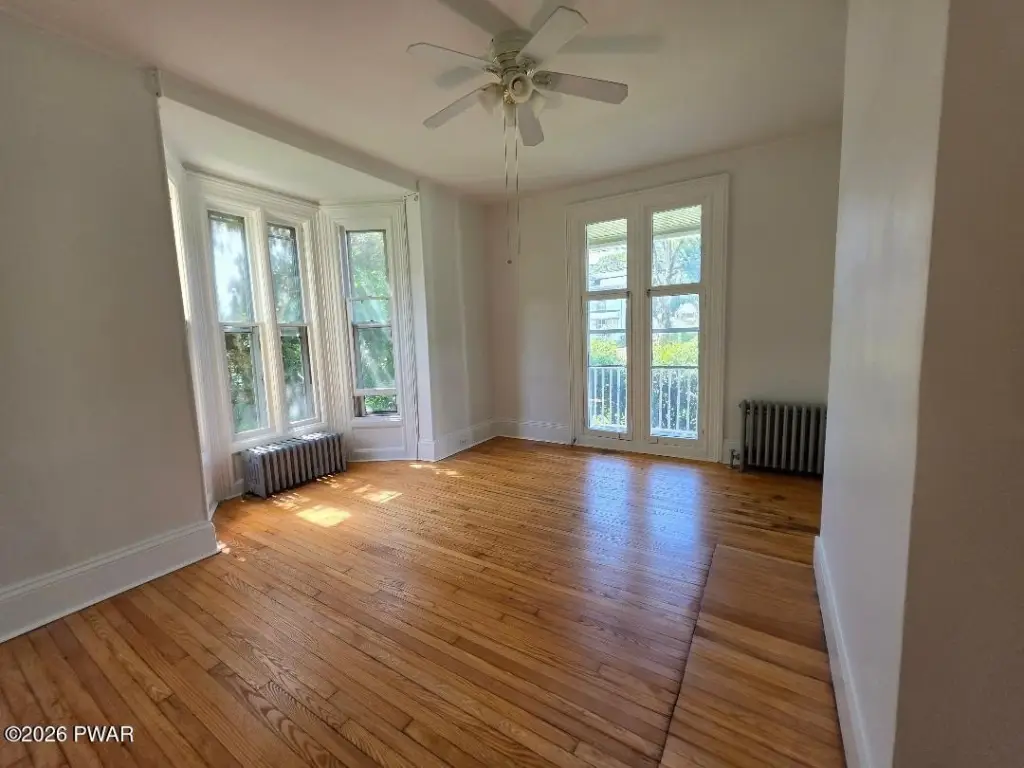
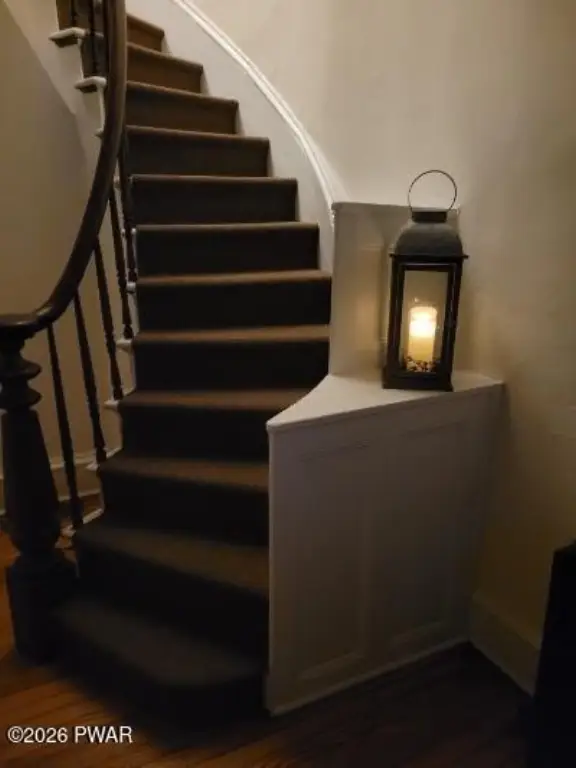
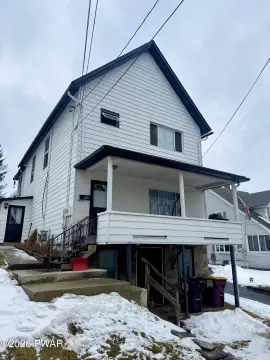
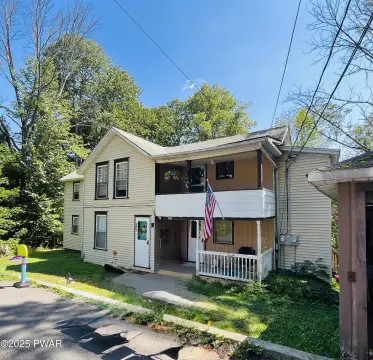
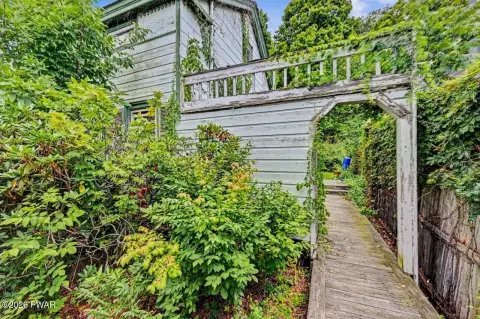
Built in 1869, this Victorian triplex contains 3 apartments within approximately 3,600 square feet on a 0.16-acre lot. Exterior character includes cedar siding, decorative bric-a-brac trim, high ceilings, original hardwood floors, and a sweeping staircase. A new boiler and hot water heater provide updated mechanical infrastructure, while the detached 2-car garage adds parking and storage.
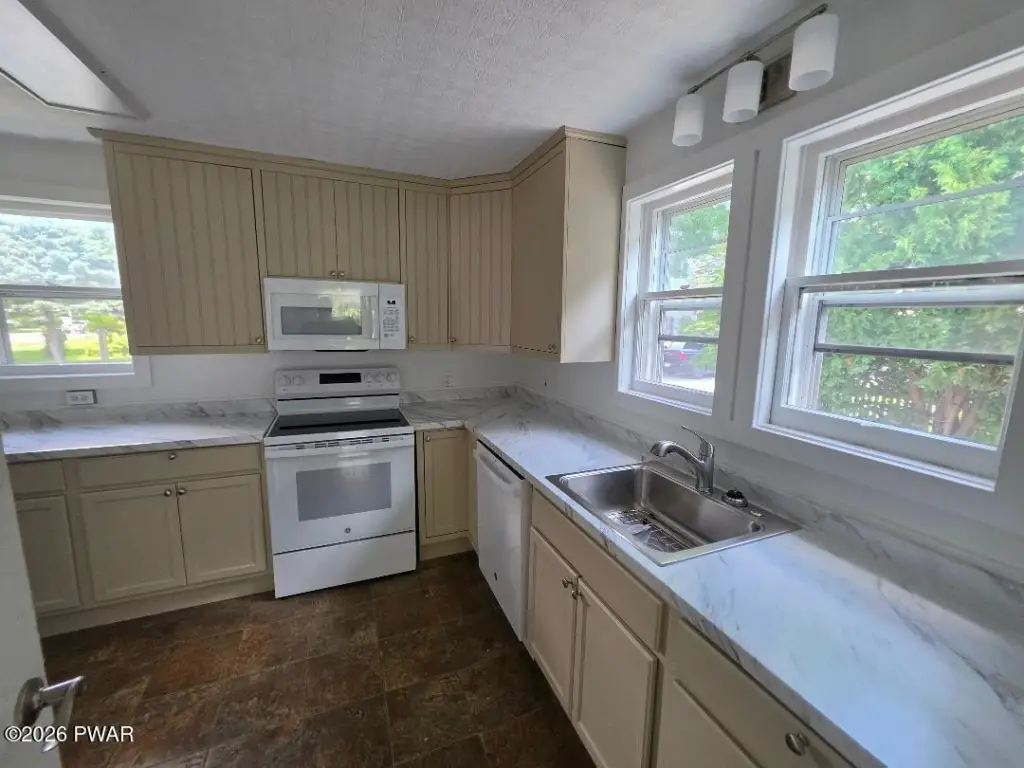
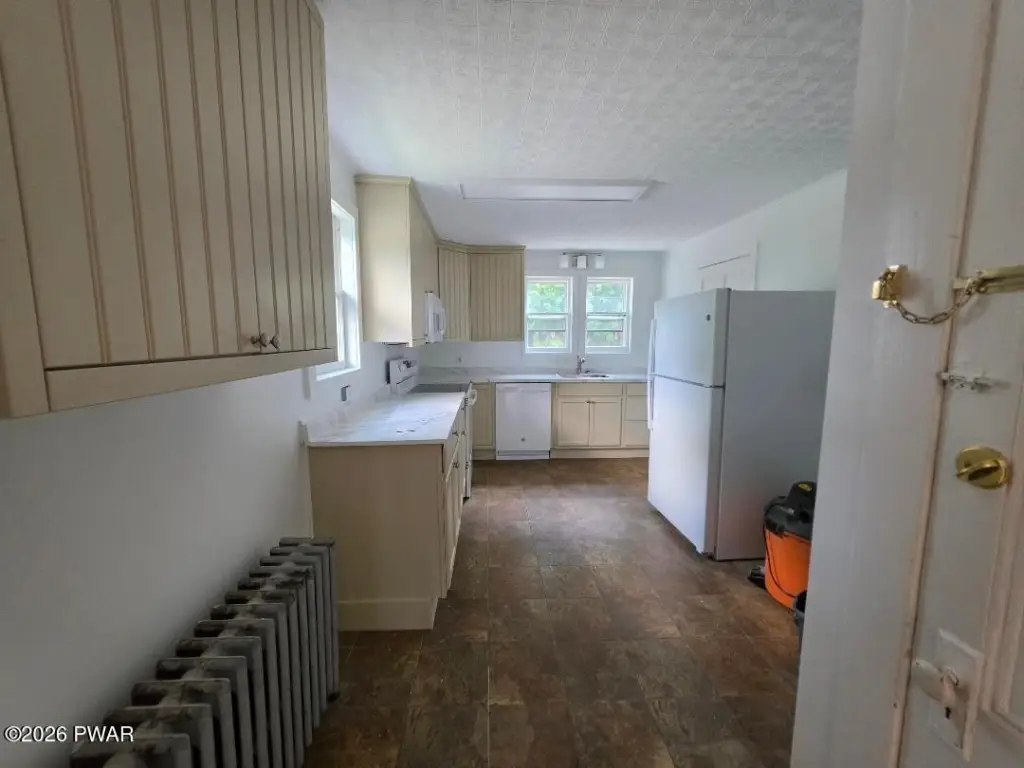
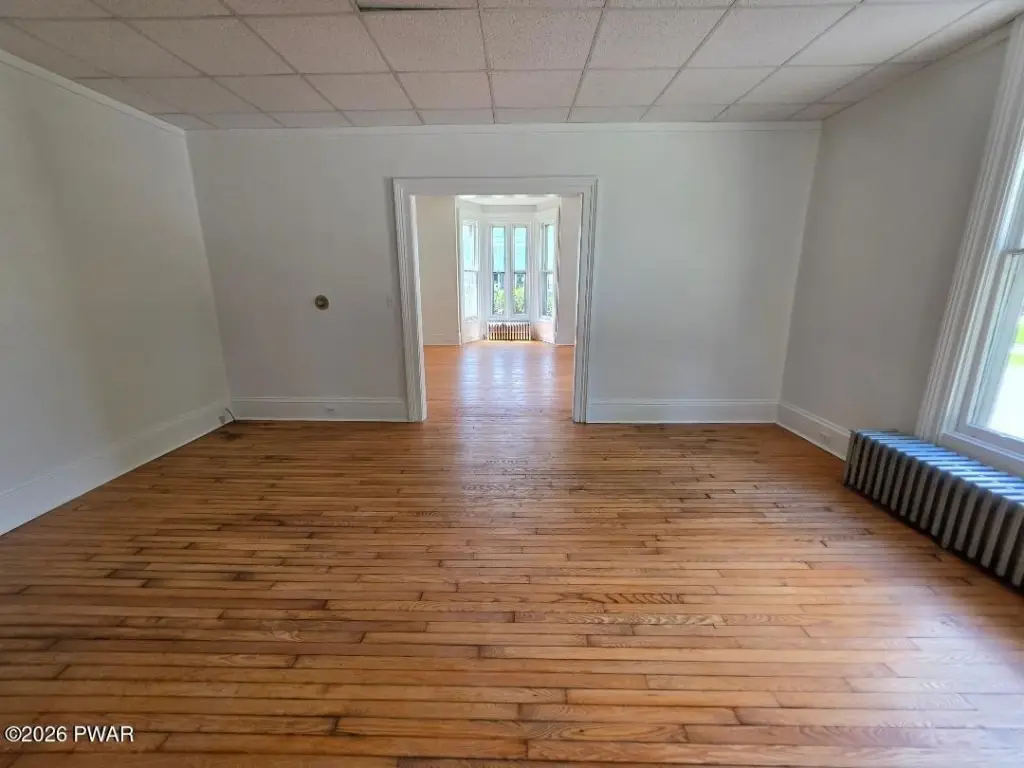
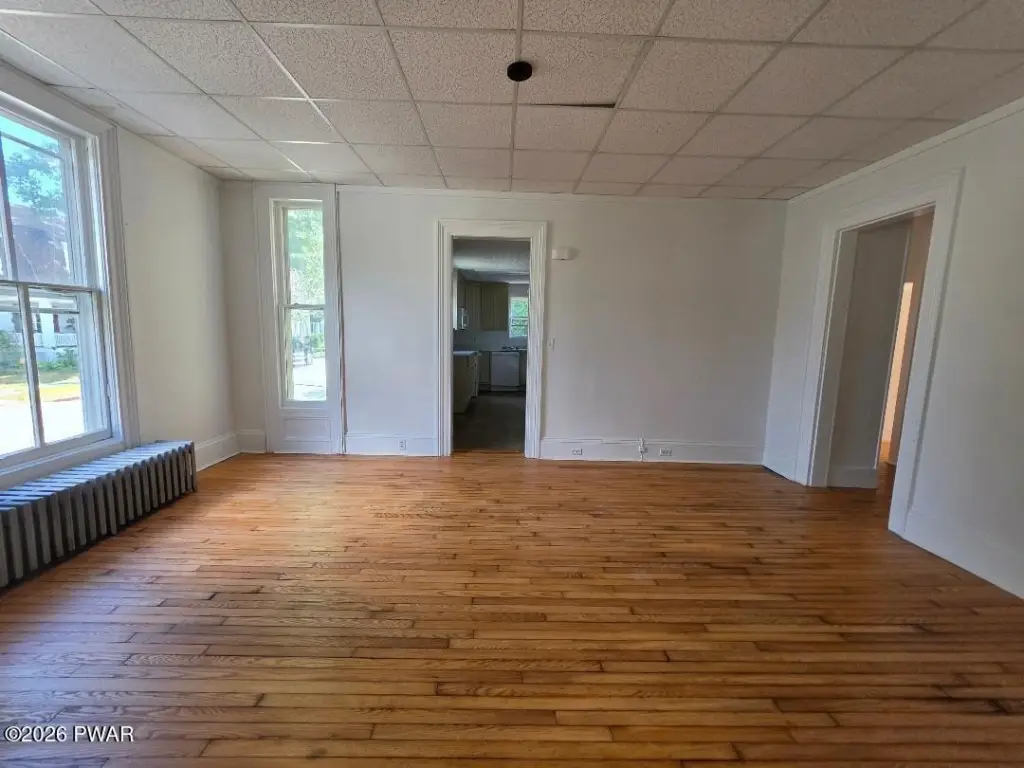
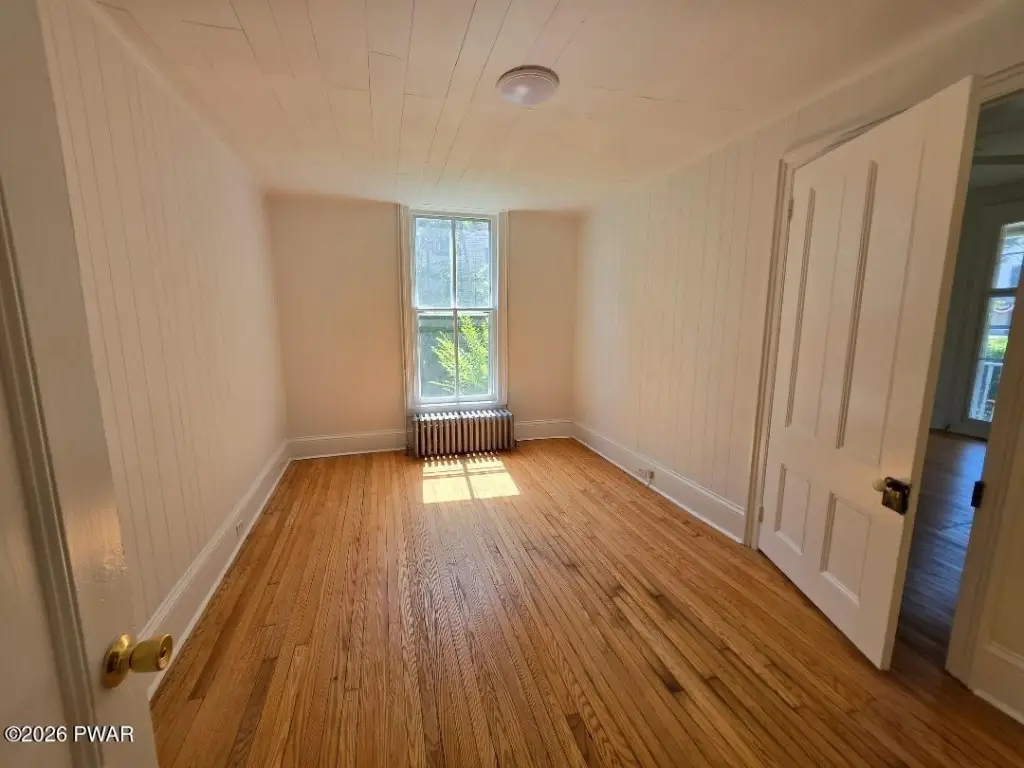
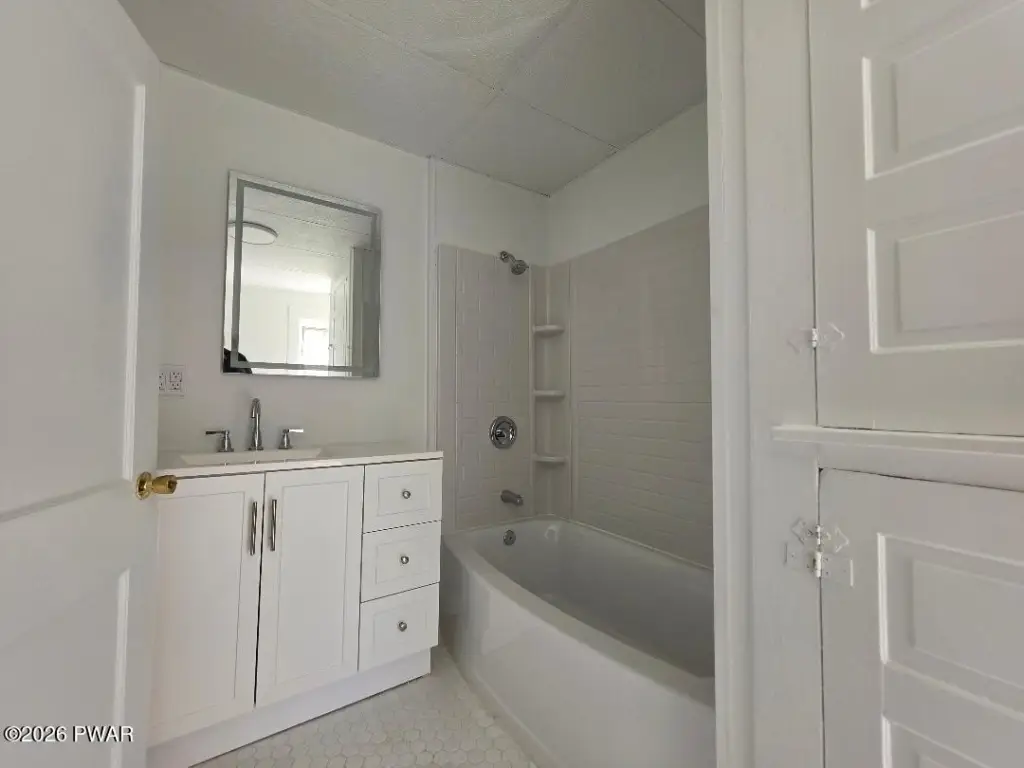
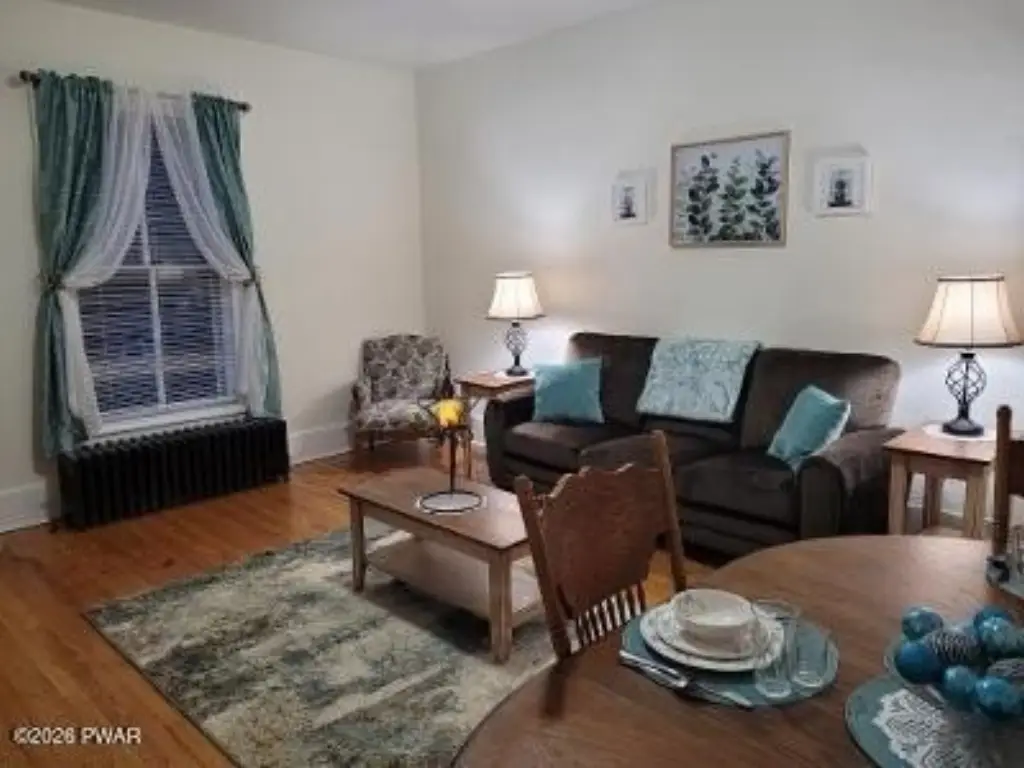
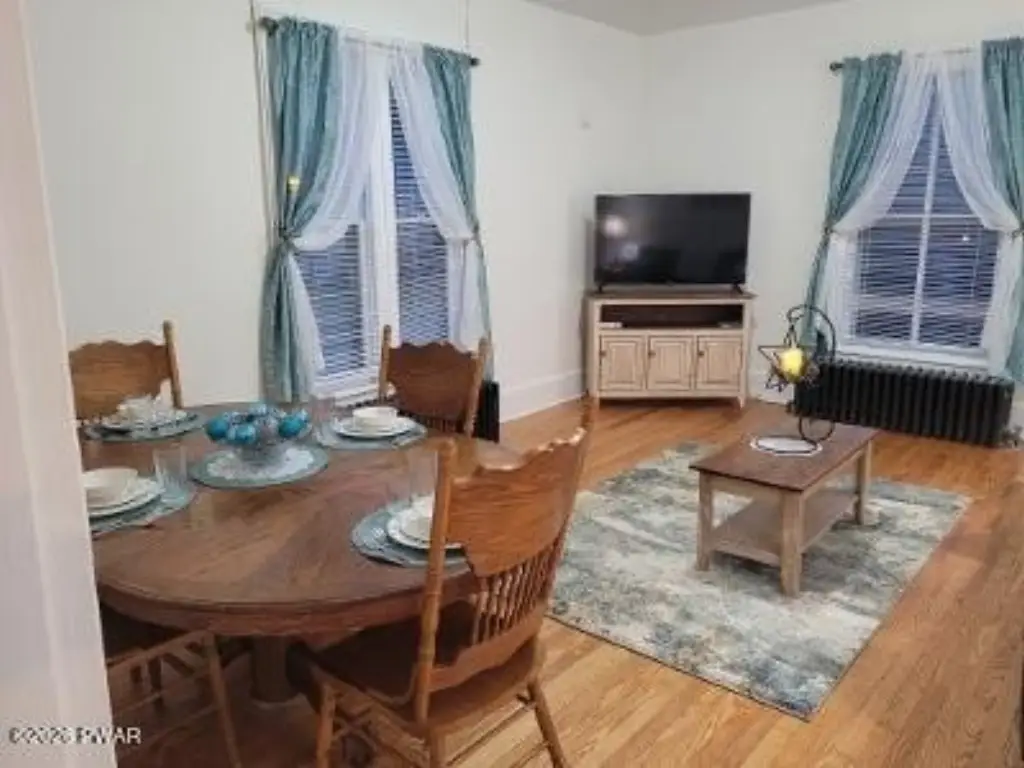
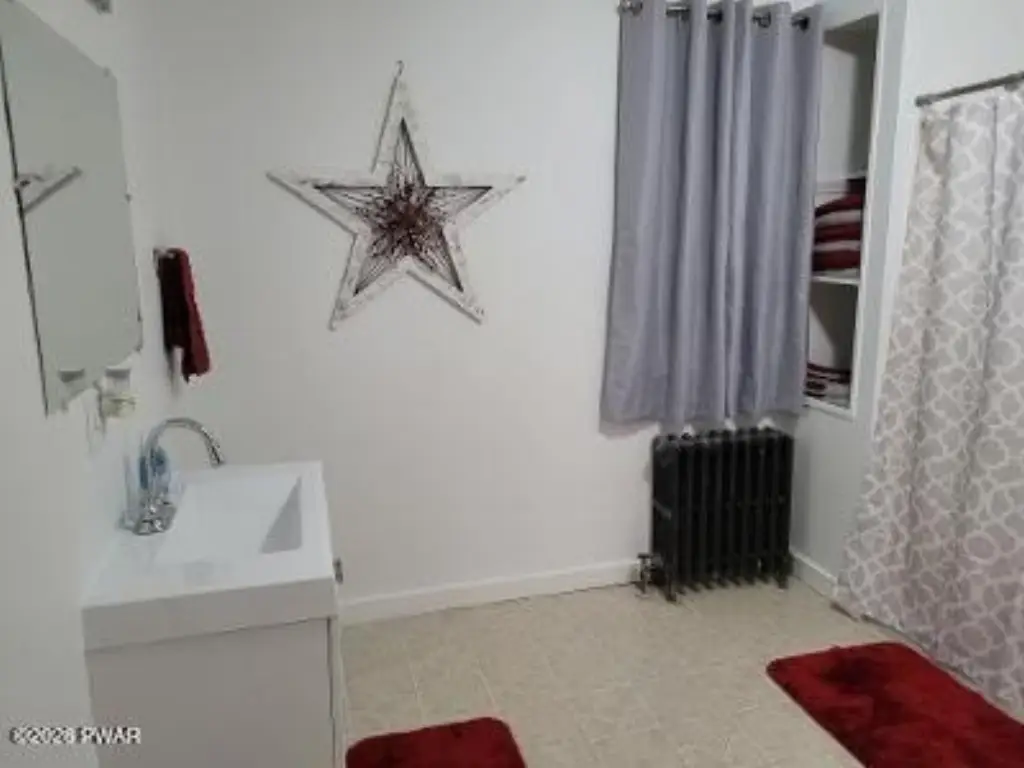
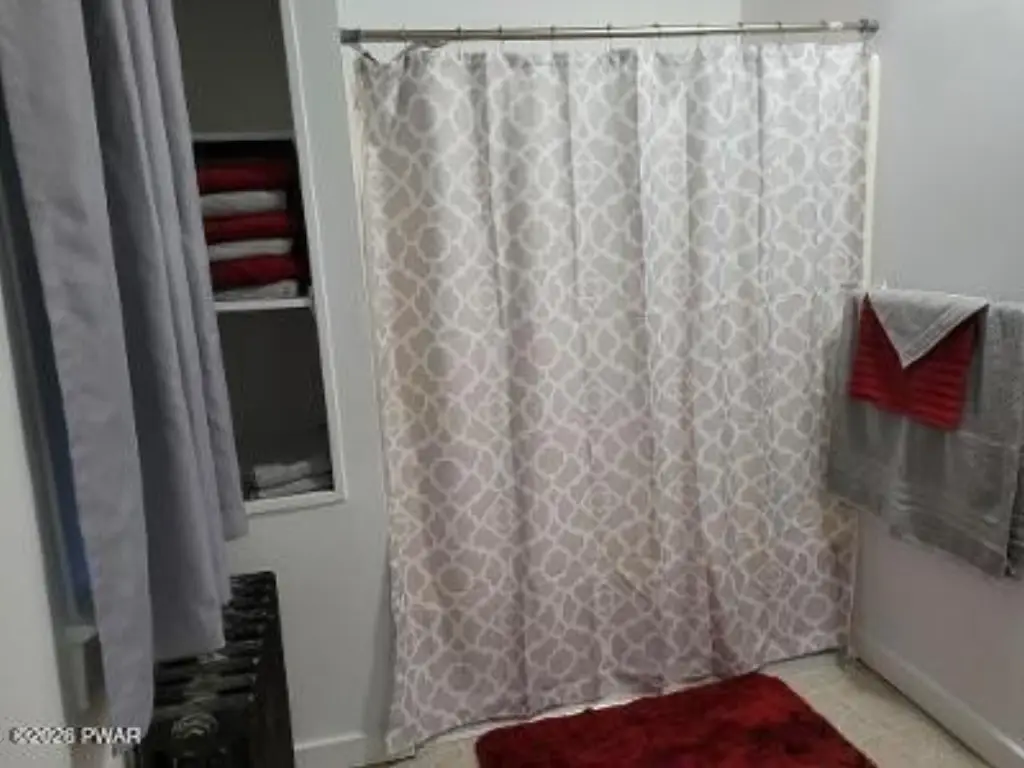
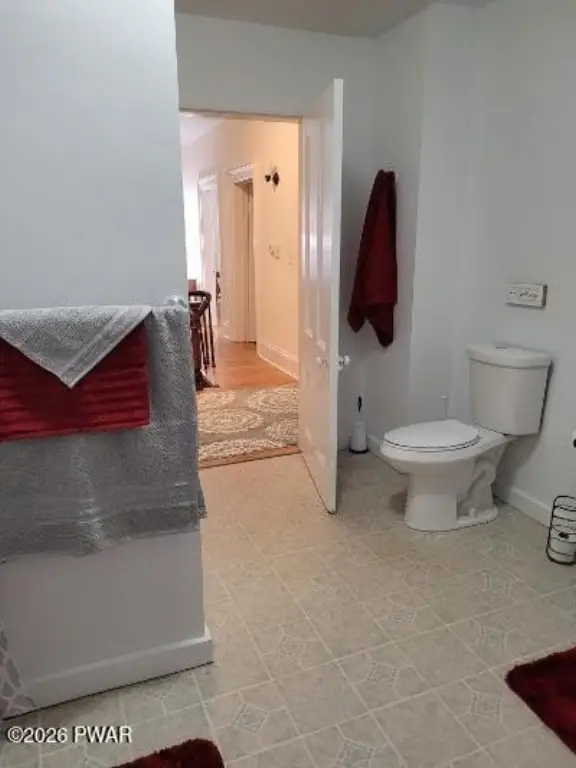
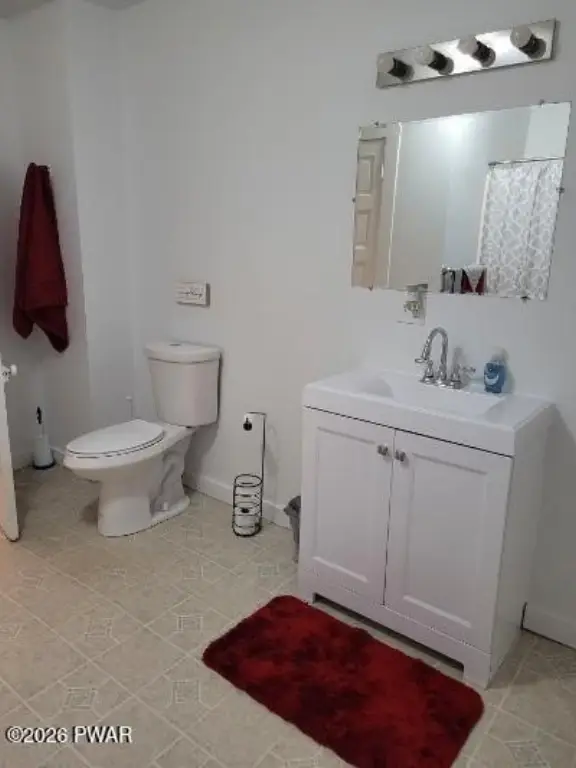
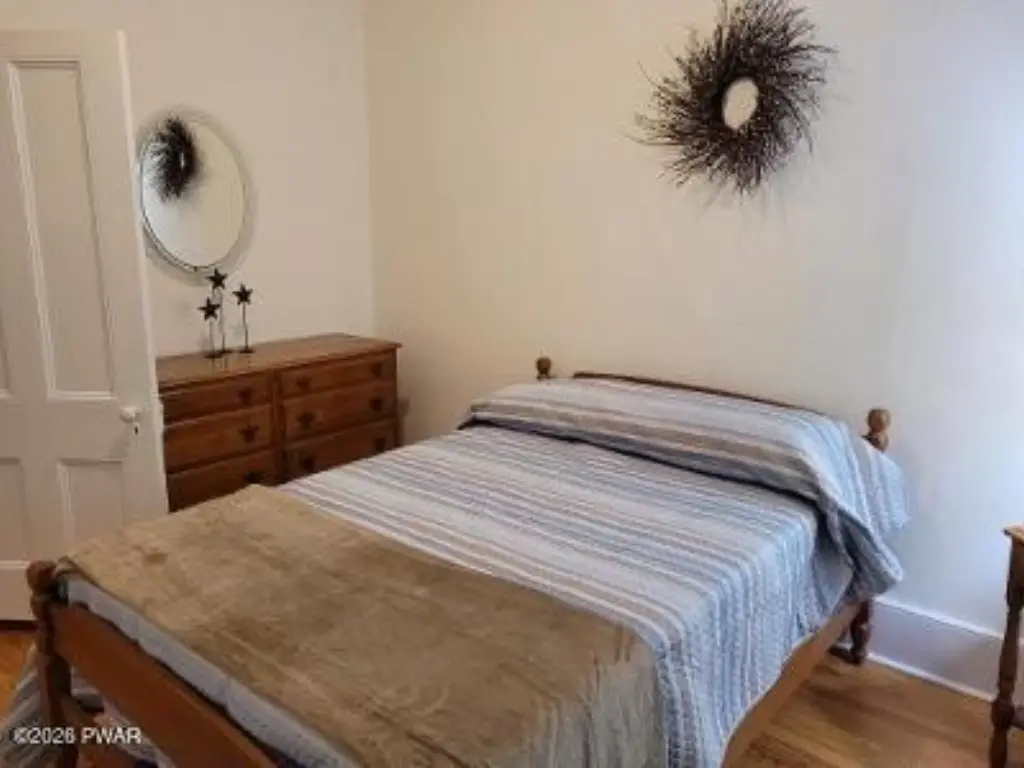
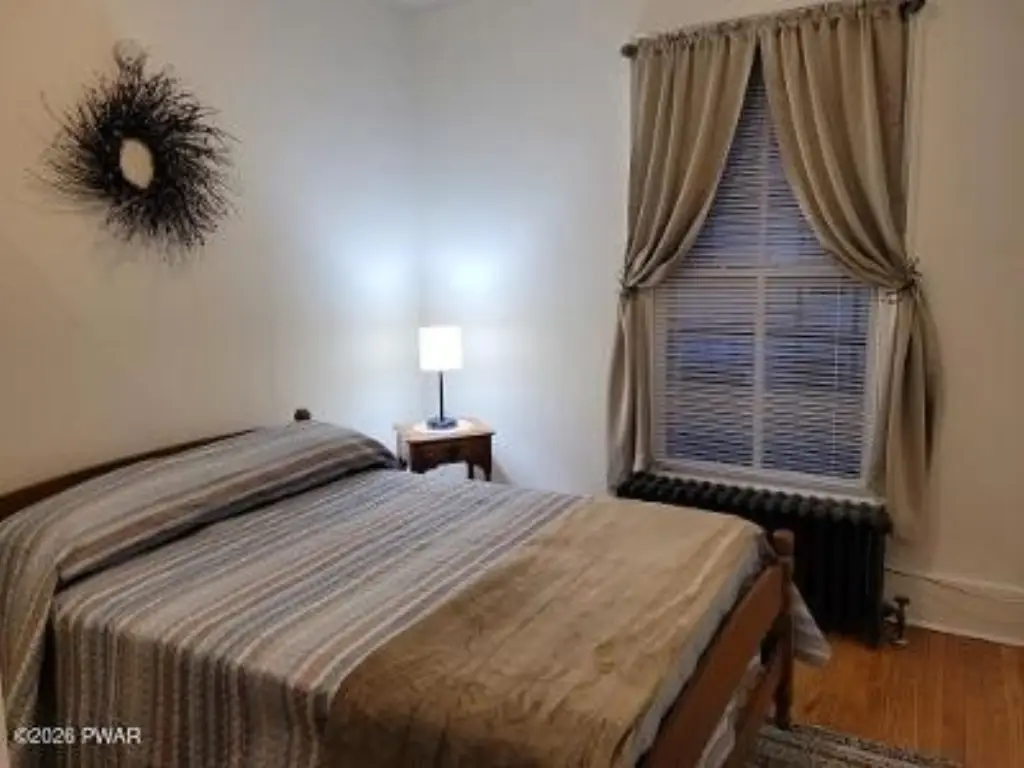
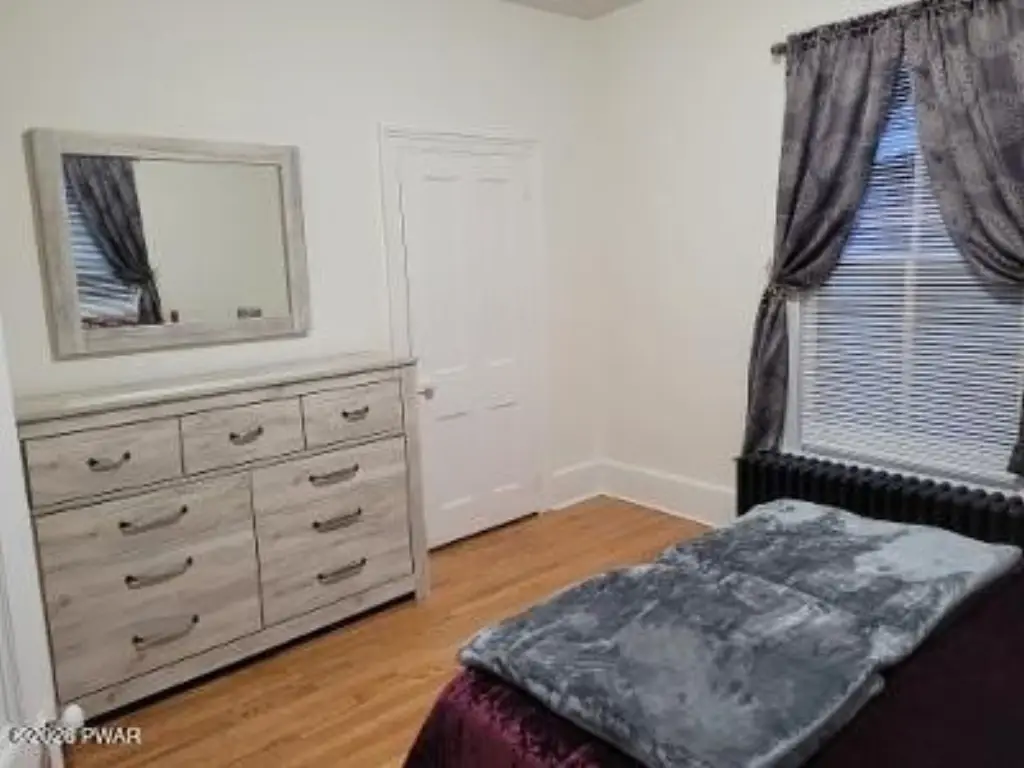
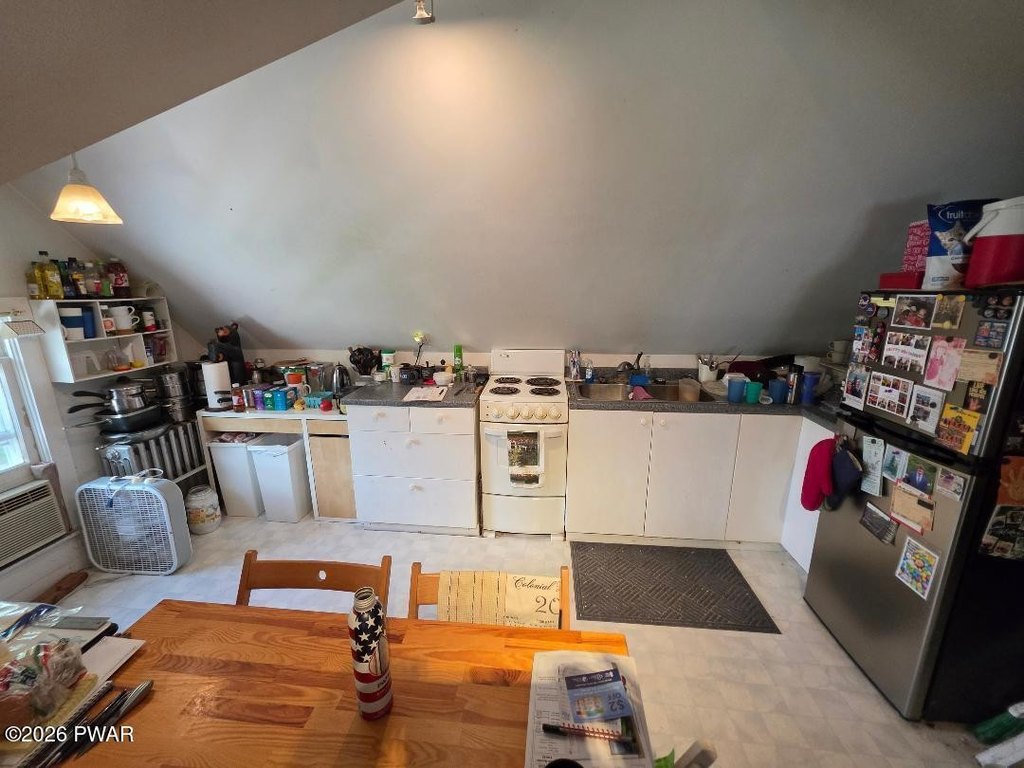
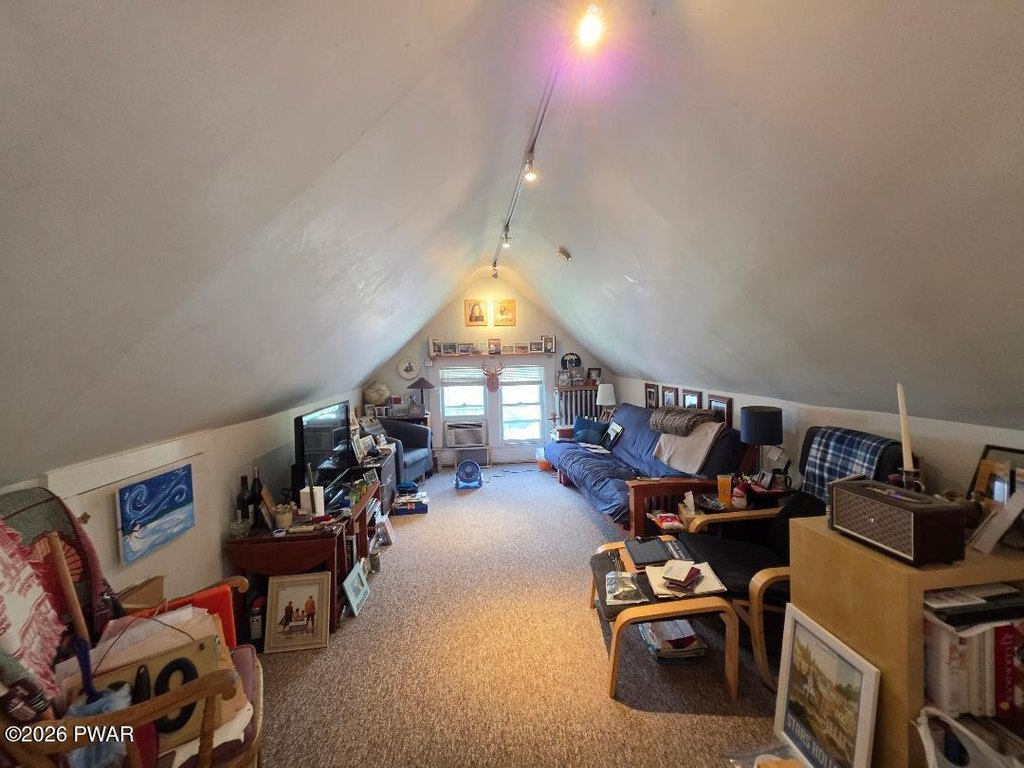
The first-floor residence includes a living room, formal dining room, remodeled kitchen and bath, hardwood flooring, and fresh paint. The second-floor apartment has 2 bedrooms, a large living room, hardwood floors, and an updated bath. The third unit offers 1 bedroom, 1 bath, a living room, and an eat-in kitchen. Public water and sewer serve the property, with natural gas hot-water and radiant heating.
Located at 1423 N Main Street in Honesdale, the property is near restaurants, shopping, boutiques, and antique shops. The configuration supports occupying one apartment while leasing the other two or renting all three units.
The first-floor residence includes a living room, formal dining room, remodeled kitchen and bath, hardwood flooring, and fresh paint. The second-floor apartment has 2 bedrooms, a large living room, hardwood floors, and an updated bath. The third unit offers 1 bedroom, 1 bath, a living room, and an eat-in kitchen. Public water and sewer serve the property, with natural gas hot-water and radiant heating.
Located at 1423 N Main Street in Honesdale, the property is near restaurants, shopping, boutiques, and antique shops. The configuration supports occupying one apartment while leasing the other two or renting all three units.
Key Highlights
- Three apartments in a 3,600‑square‑foot Victorian property built in 1869
- 0.16‑acre lot with a detached 2‑car garage and off‑street parking
- First‑floor unit has a remodeled kitchen and bath, formal dining room, and fresh paint
Financial Insights
Estimated NOI and Cap Rate
NOI / Yr
$39,161
Cap Rate
8.72%
Suggested Prices Based on Cap Rates
Cap Rate 5%
$783,220
$783.2K
Cap Rate 7%
$559,443
$559.4K
Cap Rate 9%
$435,122
$435.1K
Market Conditions
NOI Build-Up for 3,600 SF
Gross rent
$60.5K $16.80/SF
− Vacancy
−$4.5K −$1.26/SF
EGI
$55.9K $15.54/SF
− OpEx
−$16.8K −$4.66/SF
NOI
$39.2K $10.88/SF
Area
Wayne County, PA
Vacancy
7.50%
Lease Rate
$16.80 /SF/Yr
Expense Ratio
30.00%
Simulate Cap Rate and NOI
Suggested Prices Based on Cap Rates
Cap Rate 5%
$783,220
Cap Rate 7%
$559,443
Cap Rate 9%
$435,122
Alternative Uses
Best Use
Multifamily LT 5
$559.4K
$489.5K – $652.7K
NOI $39,161 @ 7.0% cap · market cap 8.72%
Second Best
Apartment 5plus
$484.6K
$424.0K – $565.3K
NOI $33,919 @ 7.0% cap · market cap 7.55%
Theoretical Best
Office A
$877.8K
$768.1K – $1.02M
NOI $61,448 @ 7.0% cap · market cap 13.69%
Zoning and permitted uses should be independently verified with authorities.
How Realmo checks its estimates
Property Analytics
Unlock full access to Insights
Subscribe to Realmo Intelligence
Open Analytics
Lease Details
3
Residential units
Location Intelligence
Trade Area within ½ mile
637
Businesses Nearby
Explore this area
Business Placement
Demographics for 18431, PA
12,602
Population
6,217
Households
2
Avg Household Size
47
Median Age
24%
College-Educated
90%
High-School Grad
134.8 sq mi
ZIP Area
93
Density / Sq Mi
$55,323
Median Household Income
$33,298
Median Earnings
$1,013
Median Rent
$222,000
Median Home Value
Check the figures for this property
Cap Rate, Value Estimation, Potential NOI and more
View Realmo Analytics
Market
Vacancy Rate% for Multifamily in Northeast region




Frequently Asked Questions
What type of property is this?
Triplex - Historic multifamily property with updated interiors, modern mechanical systems, and a detached garage for parking and storage.
Where is this triplex located?
The property is located at 1423 N Main Street Honesdale, PA.
What is the asking price?
The asking price for this property is $449,000.
What are key features of this property?
This property features: Three apartments in a 3,600‑square‑foot Victorian property built in 1869; 0.16‑acre lot with a detached 2‑car garage and off‑street parking; First‑floor unit has a remodeled kitchen and bath, formal dining room, and fresh paint


