Residential Income Property with Roof
For Sale
$235,000
1416 PARRISH STREET #3, Philadelphia, PA 19130
Third-floor condo with contemporary finishes, a private outdoor terrace, and transit access near Broad Street Line stops.
Property Size718 SF
Price / SF$327.30
Days on Market56
Property Features for 1416 PARRISH STREET #3
General Information
Standard status
Active
Size
718 SF
Property subtype
Apartment
Site & Location
Neighborhood
Francisville
Public Transit
Yes
Additional Details
Multifamily Units
1
Amenities
private roof deck
Building Details
Year Built
2015
Listing Agency:
Compass Pennsylvania, LLC
(267) 435-8015
Listed By:
Terry Upshur · License #RS339817
(215) 530-6929
Source:
Cummingsrealtors
Added: Aug 30
Changed: Oct 23
Last Checked: Oct 23 at 8:42AM
Displayed information is deemed reliable but is not guaranteed and should be independently verified. All listing content including descriptions, pricing, images are the copyrighted material of Compass Pennsylvania, LLC

Ask AI about this property
Review the available facts, identify missing information and prepare questions for the agent.
Investment Insights
Based on property information with market context.
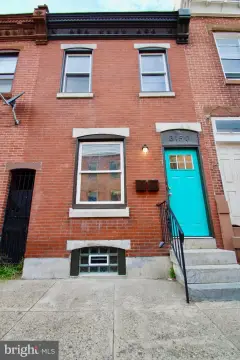
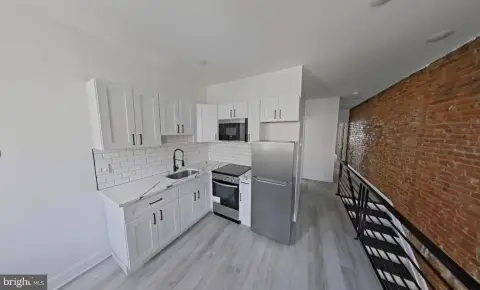
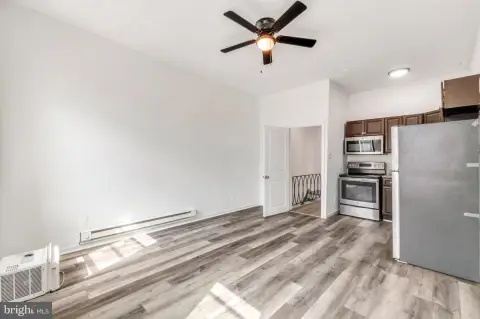
Located at 1416 Parrish Street #3, this 718-square-foot, third-floor condominium was built in 2015. The interior features an open living and kitchen arrangement, hardwood flooring, recessed lighting, high ceilings, stainless steel appliances, quartz countertops, and a glass-tile backsplash. The full bathroom includes a modern vanity, multi-head shower, river rock flooring, and glass enclosure. A full-size bedroom provides dedicated closet space, while an upper level opens to a private roof deck with downtown views.
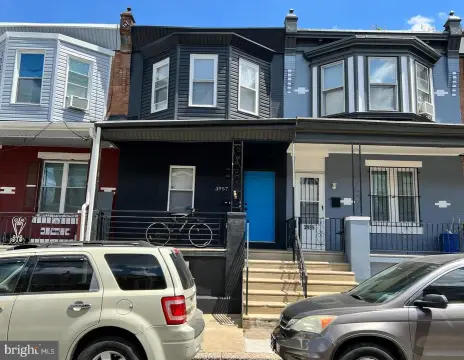
The residence is in Philadelphia’s Francisville neighborhood, close to Broad Street Line stops and major roadways. The Met, local dining, grocery shopping, entertainment, and Center City are all identified as nearby destinations, giving the property convenient access to urban amenities and transportation.
The residence is in Philadelphia’s Francisville neighborhood, close to Broad Street Line stops and major roadways. The Met, local dining, grocery shopping, entertainment, and Center City are all identified as nearby destinations, giving the property convenient access to urban amenities and transportation.
Key Highlights
- 718‑square‑foot third‑floor condominium at 1416 Parrish Street #3
- Private roof deck with downtown views
- Built in 2015
Financial Insights
Estimated NOI and Cap Rate
NOI / Yr
$11,294
Cap Rate
4.81%
Suggested Prices Based on Cap Rates
Cap Rate 5%
$225,880
$225.9K
Cap Rate 7%
$161,343
$161.3K
Cap Rate 9%
$125,489
$125.5K
Market Conditions
NOI Build-Up for 718 SF
Gross rent
$21.8K $30.36/SF
− Vacancy
−$1.3K −$1.76/SF
EGI
$20.5K $28.60/SF
− OpEx
−$9.2K −$12.87/SF
NOI
$11.3K $15.73/SF
Area
Philadelphia, PA
Vacancy
5.80%
Lease Rate
$30.36 /SF/Yr
Expense Ratio
45.00%
Simulate Cap Rate and NOI
Suggested Prices Based on Cap Rates
Cap Rate 5%
$225,880
Cap Rate 7%
$161,343
Cap Rate 9%
$125,489
Alternative Uses
Best Use
Apartment 5plus
$161.3K
$141.2K – $188.2K
NOI $11,294 @ 7.0% cap · market cap 4.81%
Second Best
—
—
no second resolved use
Theoretical Best
Multifamily LT 5
$175.0K
$153.2K – $204.2K
NOI $12,253 @ 7.0% cap · market cap 5.21%
Zoning and permitted uses should be independently verified with authorities.
How Realmo checks its estimates
Property Analytics
Contact the owner directly
Get the owner's phone numbers and email
Open Analytics
Lease Details
1
Residential units
Location Intelligence
Trade Area within ½ mile
2,508
Businesses Nearby
Explore this area
Business Placement
Demographics for 19130, PA
31,477
Population
18,178
Households
1.7
Avg Household Size
34
Median Age
78%
College-Educated
98%
High-School Grad
1.2 sq mi
ZIP Area
26,231
Density / Sq Mi
$110,436
Median Household Income
$76,051
Median Earnings
$1,836
Median Rent
$483,500
Median Home Value
Check the figures for this property
Cap Rate, Value Estimation, Potential NOI and more
View Realmo Analytics
Frequently Asked Questions
What type of property is this?
Residential income property - Third-floor condo with contemporary finishes, a private outdoor terrace, and transit access near Broad Street Line stops.
Where is this residential income property located?
The property is located at 1416 PARRISH STREET #3 Philadelphia, PA.
What is the asking price?
The asking price for this property is $235,000.
What are key features of this property?
This property features: 718‑square‑foot third‑floor condominium at 1416 Parrish Street #3; Private roof deck with downtown views; Built in 2015


