Fountain Square Multi-Tenant Commercial
For Sale
$1,300,000
1415 Shelby St, Indianapolis, IN 46203
Renovated 6,590 SF property with income and occupancy potential.
Property Size6,590 SF
Price / SF$197.27
Days on Market201
Property Features for 1415 Shelby St
General Information
Standard status
Active
Size
6,590 SF
Listing Agency:
Compass Indiana, LLC
Listed By:
Kendrick Davis
(317) 650-3214
Source:
Mcwatersrealestate
Added: Mar 27
Changed: Oct 13
Last Checked: Oct 5 at 10:56PM
Displayed information is deemed reliable but is not guaranteed and should be independently verified. All listing content including descriptions, pricing, images are the copyrighted material of Compass Indiana, LLC
Investment Insights
Based on property information with market context.
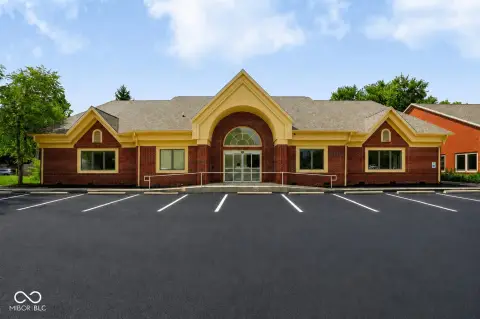
Located in historic Fountain Square, this newly renovated 6,590 SF multi-tenant commercial property presents an owner-occupant opportunity. The building is positioned along Shelby Street in an active mixed-use corridor. The property includes three suites: 1417 Shelby Street, totaling 3,640 SF and currently vacant; 1415A Shelby Street, totaling 1,250 SF and leased through July 31, 2028; and 1415B Shelby Street, totaling 1,700 SF and leased through June 30, 2027. The layout combines owner-user space and stabilized tenancy. The site includes two separate parking lots, providing flexibility for tenant and customer use. Direct access from Shelby Street, along with alley access to both parking areas, allows for convenient ingress and egress, service access, and efficient traffic flow. Recent renovations enhance the functionality and appearance of the building. The 3,640 SF suite is suited for retail, office, or service-oriented users seeking a presence in Fountain Square, with the flexibility to expand in the future as leases expire. The property offers immediate occupancy, established tenancy, dedicated parking, and accessibility in an urban submarket.
Key Highlights
- Largest suite offering 3,640 SF is vacant and ready for immediate owner occupancy.
- Income‑producing property with two existing tenants and leases.
- Located in the heart of historic Fountain Square, a highly desirable urban area.
Financial Insights
Estimated NOI and Cap Rate
NOI / Yr
$87,008
Cap Rate
6.69%
Suggested Prices Based on Cap Rates
Cap Rate 5%
$1,740,160
$1.7M
Cap Rate 7%
$1,242,971
$1.2M
Cap Rate 9%
$966,756
$966.8K
Market Conditions
NOI Build-Up for 6,590 SF
Gross rent
$142.3K $21.60/SF
− Vacancy
−$26.3K −$4.00/SF
EGI
$116.0K $17.60/SF
− OpEx
−$29.0K −$4.40/SF
NOI
$87.0K $13.20/SF
Area
Indianapolis, IN
Vacancy
18.50%
Lease Rate
$21.60 /SF/Yr
Expense Ratio
25.00%
Simulate Cap Rate and NOI
Suggested Prices Based on Cap Rates
Cap Rate 5%
$1,740,160
Cap Rate 7%
$1,242,971
Cap Rate 9%
$966,756
Alternative Uses
Best Use
Office B
$1.24M
$1.09M – $1.45M
NOI $87,008 @ 7.0% cap · market cap 6.69%
Second Best
—
—
no second resolved use
Theoretical Best
Office A
$1.64M
$1.44M – $1.91M
NOI $114,824 @ 7.0% cap · market cap 8.83%
Zoning and permitted uses should be independently verified with authorities.
How Realmo checks its estimates
Property Analytics
Unlock full access to Insights
Subscribe to Realmo Intelligence
Open Analytics
Current Use
Location Intelligence
Trade Area within ½ mile
838
Businesses Nearby
Explore this area
Business Placement
Demographics for 46203, IN
38,224
Population
18,057
Households
2.1
Avg Household Size
34
Median Age
26%
College-Educated
79%
High-School Grad
13.9 sq mi
ZIP Area
2,750
Density / Sq Mi
$55,375
Median Household Income
$40,620
Median Earnings
$1,022
Median Rent
$155,500
Median Home Value
Check the figures for this property
Cap Rate, Value Estimation, Potential NOI and more
View Realmo Analytics
Market
Vacancy Rate% for Office in Indianapolis, IN

Questions? Ask Rey
Realmo’s AI knows this listing — price, zoning, demand, history. Ask anything.




Frequently Asked Questions
What type of property is this?
Office building - Renovated 6,590 SF property with income and occupancy potential.
Where is this office building located?
The property is located at 1415 Shelby St Indianapolis, IN.
What is the asking price?
The asking price for this property is $1,300,000.
What are key features of this property?
This property features: Largest suite offering 3,640 SF is vacant and ready for immediate owner occupancy.; Income‑producing property with two existing tenants and leases.; Located in the heart of historic Fountain Square, a highly desirable urban area.