Caldwell Multifamily Property For
For Sale
Contact for pricing
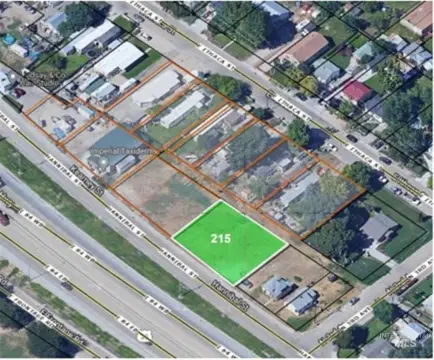
1413 Missoula Way, Caldwell, ID 83605
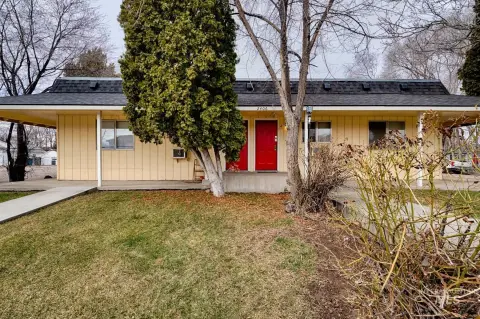
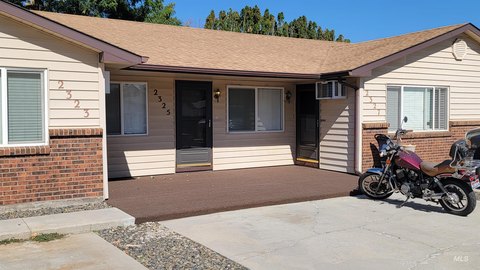
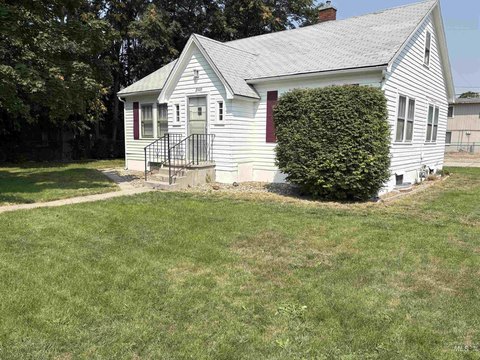
Multifamily property with four units near schools and local services.
Property Size3,456 SF
Price / SF$188.08
Days on Market246
Property Features for 1413 Missoula Way
General Information
Standard status
Active
Size
3,456 SF
Class
C
Property subtype
Multifamily
Building Details
Year Built
1978
Buildings
2
Units
4
Listing Agency:
Rallens Realty Consultants
Listed By:
Joshua Hadder · License #SP49400
(208) 870-7091
Source:
Crexi
Added: Feb 12
Changed: Oct 14
Last Checked: Oct 14 at 10:47PM
Displayed information is deemed reliable but is not guaranteed and should be independently verified. All listing content including descriptions, pricing, images are the copyrighted material of Rallens Realty Consultants

Ask AI about this property
Review the available facts, identify missing information and prepare questions for the agent.
Investment Insights
Based on property information with market context.
Constructed in 1978, this multifamily property contains four units. Each unit features 2 bedrooms and 1.5 bathrooms, with an approximate area of 864 square feet, totaling a property size of 3456 square feet. The property is situated in an established residential area, conveniently located near schools and local services. It offers convenient access to I-84, Highway 20/26, and Highway 19, providing easy connectivity throughout the Treasure Valley. The property is located minutes from Indian Creek Plaza, a year-round community hub in Caldwell that hosts events, seasonal attractions, and frequent markets and festivals. The surrounding downtown area features an active and growing food and beverage scene connected to the Plaza's programming. Residents have access to city parks, including Memorial Park, which spans 15 acres and offers courts and playgrounds. Nearby public schools include Washington Elementary, Jefferson Middle School, and Caldwell Senior High.
Key Highlights
- Four 2‑bedroom/1.5‑bath units at ±864 SF each.
- Convenient access to I‑84, Hwy 20/26, and Hwy 19.
- Minutes to Indian Creek Plaza, a year‑round community hub.
Financial Insights
Estimated NOI and Cap Rate
NOI / Yr
$49,663
Cap Rate
7.64%
Suggested Prices Based on Cap Rates
Cap Rate 5%
$993,260
$993.3K
Cap Rate 7%
$709,471
$709.5K
Cap Rate 9%
$551,811
$551.8K
Market Conditions
NOI Build-Up for 3,456 SF
Gross rent
$93.7K $27.12/SF
− Vacancy
−$3.4K −$0.99/SF
EGI
$90.3K $26.13/SF
− OpEx
−$40.6K −$11.76/SF
NOI
$49.7K $14.37/SF
Area
Canyon County, ID
Vacancy
3.66%
Lease Rate
$27.12 /SF/Yr
Expense Ratio
45.00%
Simulate Cap Rate and NOI
Suggested Prices Based on Cap Rates
Cap Rate 5%
$993,260
Cap Rate 7%
$709,471
Cap Rate 9%
$551,811
Alternative Uses
Best Use
Apartment 5plus
$709.5K
$620.8K – $827.7K
NOI $49,663 @ 7.0% cap · market cap 7.64%
Second Best
Multifamily LT 5
$296.2K
$259.2K – $345.6K
NOI $20,735 @ 7.0% cap · market cap 3.19%
Theoretical Best
Office A
$920.5K
$805.5K – $1.07M
NOI $64,436 @ 7.0% cap · market cap 9.91%
Zoning and permitted uses should be independently verified with authorities.
How Realmo checks its estimates
Property Analytics
Unlock full access to Insights
Subscribe to Realmo Intelligence
Open Analytics
Current Use
Location Intelligence
Trade Area within ½ mile
155
Businesses Nearby
Explore this area
Business Placement
Demographics for 83605, ID
38,561
Population
14,197
Households
2.7
Avg Household Size
32
Median Age
14%
College-Educated
80%
High-School Grad
24.6 sq mi
ZIP Area
1,568
Density / Sq Mi
$60,657
Median Household Income
$31,806
Median Earnings
$973
Median Rent
$300,900
Median Home Value
Check the figures for this property
Cap Rate, Value Estimation, Potential NOI and more
View Realmo Analytics
Market
Vacancy Rate% for Multifamily in West region






Frequently Asked Questions
What type of property is this?
Quadplex - Multifamily property with four units near schools and local services.
Where is this quadplex located?
The property is located at 1413 Missoula Way Caldwell, ID.
What is the asking price?
The asking price for this property is $650,000.
What are key features of this property?
This property features: Four 2‑bedroom/1.5‑bath units at ±864 SF each.; Convenient access to I‑84, Hwy 20/26, and Hwy 19.; Minutes to Indian Creek Plaza, a year‑round community hub.


