Historic Two-Family
For Sale
$499,900
14 Pearl St, Hudson Falls, NY 12839
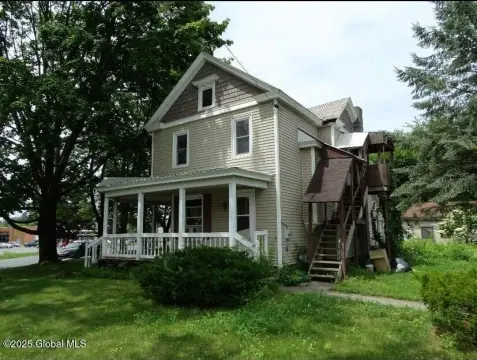
Distinctive duplex with preserved architectural details, two updated kitchens, private porches, and paved off-street parking.
Property Size3,982 SF
Price / SF$125.54
Days on Market52
Property Features for 14 Pearl St
General Information
Standard status
Active
Size
3,982 SF
Total Parking Spaces
5
Property subtype
Residential Income
Units
Unit Mix
1 x 4BR/2BA, 1 x 3BR/1.5BA
Multifamily Units
2
Taxes and HOA fees
Annual Taxes
$6,131
Amenities
belvedere
private covered porches
English-style garden
slate pathways
Building Details
Year Built
1890
Buildings
1
Construction
Second Empire Italianate Victorian
Listing Agency:
eXp Realty
(888) 276-0630
Listed By:
Angela Cugini-Girard · License #40CU0937069
(518) 232-1460
Source:
Exprealty
Added: Sep 1
Changed: Oct 19
Last Checked: Oct 20 at 8:50PM
Displayed information is deemed reliable but is not guaranteed and should be independently verified. All listing content including descriptions, pricing, images are the copyrighted material of eXp Realty

Ask AI about this property
Review the available facts, identify missing information and prepare questions for the agent.
Investment Insights
Based on property information with market context.
Built in 1890, this two-family duplex contains 3,982 square feet of living space with a total of 7 bedrooms and 3.5 baths. The front residence spans three floors and approximately 2,353 square feet, offering 4 bedrooms, 2 full baths, generous living and dining rooms, an updated kitchen, and flexible bonus areas. The rear residence measures approximately 1,665 square feet and includes 3 bedrooms, 1.5 baths, an updated kitchen, laundry room, formal dining room, and additional sitting or office space.
Original character includes a slate mansard roof, belvedere, ornate woodwork, hardwood floors, coffered ceilings, built-ins, and an interior curved staircase. Each unit has a private covered porch. Exterior features include an English-style garden, slate walkways, and paved parking for approximately five vehicles. The property is near the Village Green, Main Street, and the Hudson Falls Historic District, with access to Glens Falls, Lake George, Saratoga Springs, and Vermont.
Original character includes a slate mansard roof, belvedere, ornate woodwork, hardwood floors, coffered ceilings, built-ins, and an interior curved staircase. Each unit has a private covered porch. Exterior features include an English-style garden, slate walkways, and paved parking for approximately five vehicles. The property is near the Village Green, Main Street, and the Hudson Falls Historic District, with access to Glens Falls, Lake George, Saratoga Springs, and Vermont.
Key Highlights
- 1890‑built duplex with 3,982 square feet of living space
- Two residences totaling 7 bedrooms and 3.5 baths
- Front unit: approximately 2,353 square feet, 4 bedrooms, and 2 full baths
Financial Insights
Estimated NOI and Cap Rate
NOI / Yr
$41,109
Cap Rate
8.22%
Suggested Prices Based on Cap Rates
Cap Rate 5%
$822,180
$822.2K
Cap Rate 7%
$587,271
$587.3K
Cap Rate 9%
$456,767
$456.8K
Market Conditions
NOI Build-Up for 3,982 SF
Gross rent
$78.8K $19.80/SF
− Vacancy
−$4.1K −$1.03/SF
EGI
$74.7K $18.77/SF
− OpEx
−$33.6K −$8.45/SF
NOI
$41.1K $10.32/SF
Area
Washington County, NY
Vacancy
5.20%
Lease Rate
$19.80 /SF/Yr
Expense Ratio
45.00%
Simulate Cap Rate and NOI
Suggested Prices Based on Cap Rates
Cap Rate 5%
$822,180
Cap Rate 7%
$587,271
Cap Rate 9%
$456,767
Alternative Uses
Best Use
Multifamily LT 5
$658.6K
$576.3K – $768.4K
NOI $46,105 @ 7.0% cap · market cap 9.22%
Second Best
Apartment 5plus
$587.3K
$513.9K – $685.2K
NOI $41,109 @ 7.0% cap · market cap 8.22%
Theoretical Best
Office A
$987.9K
$864.4K – $1.15M
NOI $69,153 @ 7.0% cap · market cap 13.83%
Zoning and permitted uses should be independently verified with authorities.
How Realmo checks its estimates
Property Analytics
Contact the owner directly
Get the owner's phone numbers and email
Open Analytics
Lease Details
2
Residential units
Location Intelligence
Trade Area within ½ mile
360
Businesses Nearby
Explore this area
Business Placement
Demographics for 12839, NY
13,618
Population
6,515
Households
2.1
Avg Household Size
41
Median Age
16%
College-Educated
90%
High-School Grad
31.0 sq mi
ZIP Area
439
Density / Sq Mi
$70,006
Median Household Income
$41,545
Median Earnings
$1,018
Median Rent
$161,300
Median Home Value
Check the figures for this property
Cap Rate, Value Estimation, Potential NOI and more
View Realmo Analytics
Market
Vacancy Rate% for Multifamily in Northeast region



Frequently Asked Questions
What type of property is this?
Duplex - Distinctive duplex with preserved architectural details, two updated kitchens, private porches, and paved off-street parking.
Where is this duplex located?
The property is located at 14 Pearl St Hudson Falls, NY.
What is the asking price?
The asking price for this property is $499,900.
What are key features of this property?
This property features: 1890‑built duplex with 3,982 square feet of living space; Two residences totaling 7 bedrooms and 3.5 baths; Front unit: approximately 2,353 square feet, 4 bedrooms, and 2 full baths


