Mixed-Use Property with Restored
For Sale
$899,999
133135 133-135 Broadway, Bangor, ME 04401
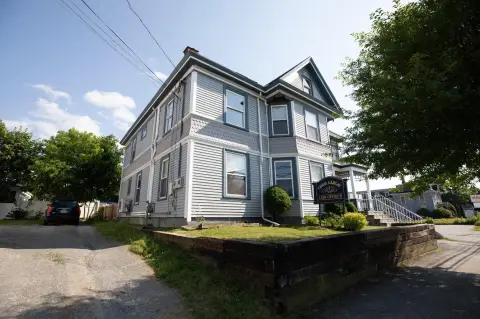
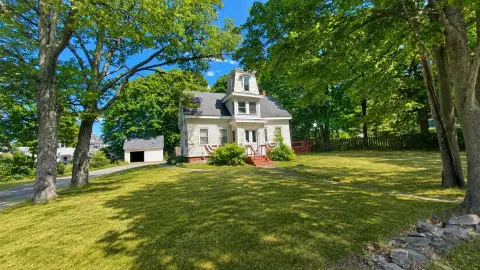
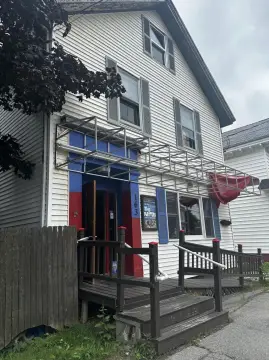
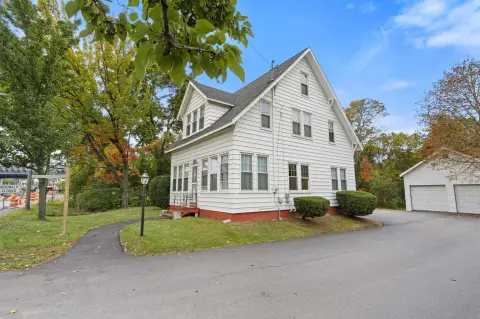
Historic downtown building combining professional office amenities with a licensed Airbnb apartment and private parking.
Property Size7,000 SF
Price / SF$121.26
Days on Market55
Property Features for 133135 133-135 Broadway
General Information
Standard status
Active
Size
7,000 SF
Amenities
conference rooms
private bathrooms
Building Details
Year Built
1870
Buildings
1
Building Size
7,000 SF
Tenancy
Multi
Listing Agency:
Realty of Maine
Listed By:
Jennifer Herbold
(207) 478-4230
Source:
Lawanaandcompany
Added: Aug 22
Changed: Oct 13
Last Checked: Oct 7 at 2:01PM
Displayed information is deemed reliable but is not guaranteed and should be independently verified. All listing content including descriptions, pricing, images are the copyrighted material of Realty of Maine
Investment Insights
Based on property information with market context.
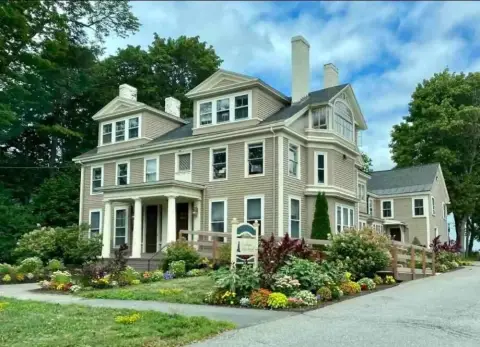
Built in 1870, this mixed-use property in downtown Bangor combines commercial office space with a licensed Airbnb apartment. The building retains original hardwood floors and restored woodwork, creating a distinctive interior character suited to professional occupancy and residential use.
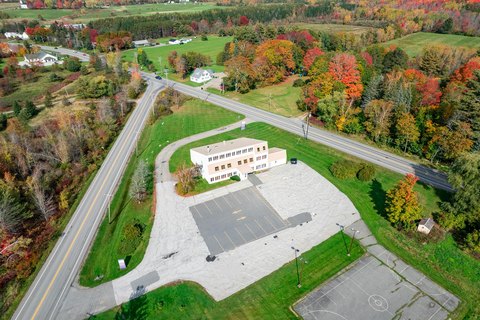
The office component includes multiple private offices, conference rooms, and private bathrooms. A private parking lot provides 20+ parking spots, while building systems include a new HVAC system, a backup boiler, and new heat pumps throughout. The property is located at 133-135 Broadway in Bangor, Maine.
The office component includes multiple private offices, conference rooms, and private bathrooms. A private parking lot provides 20+ parking spots, while building systems include a new HVAC system, a backup boiler, and new heat pumps throughout. The property is located at 133-135 Broadway in Bangor, Maine.
Key Highlights
- 20+ parking spots in a private lot
- Built in 1870 with original hardwood floors and restored woodwork
- Multiple private offices and conference rooms
Financial Insights
Estimated NOI and Cap Rate
NOI / Yr
$62,559
Cap Rate
6.95%
Suggested Prices Based on Cap Rates
Cap Rate 5%
$1,251,180
$1.3M
Cap Rate 7%
$893,700
$893.7K
Cap Rate 9%
$695,100
$695.1K
Market Conditions
NOI Build-Up for 7,422 SF
Gross rent
$120.2K $16.20/SF
− Vacancy
−$6.5K −$0.87/SF
EGI
$113.7K $15.33/SF
− OpEx
−$51.2K −$6.90/SF
NOI
$62.6K $8.43/SF
Area
Penobscot County, ME
Vacancy
5.40%
Lease Rate
$16.20 /SF/Yr
Expense Ratio
45.00%
Simulate Cap Rate and NOI
Suggested Prices Based on Cap Rates
Cap Rate 5%
$1,251,180
Cap Rate 7%
$893,700
Cap Rate 9%
$695,100
Alternative Uses
Best Use
Office B
$1.50M
$1.31M – $1.75M
NOI $104,918 @ 7.0% cap · market cap 11.66%
Second Best
Apartment 5plus
$893.7K
$782.0K – $1.04M
NOI $62,559 @ 7.0% cap · market cap 6.95%
Theoretical Best
Office A
$2.40M
$2.10M – $2.80M
NOI $167,797 @ 7.0% cap · market cap 18.64%
Zoning and permitted uses should be independently verified with authorities.
How Realmo checks its estimates
Property Analytics
Current Use
Lease Details
Multi-tenant
Tenancy
Location Intelligence
Trade Area within ½ mile
18
Businesses Nearby
Explore this area
Business Placement
Demographics for 04401, ME
44,608
Population
20,932
Households
2.1
Avg Household Size
40
Median Age
37%
College-Educated
96%
High-School Grad
100.1 sq mi
ZIP Area
446
Density / Sq Mi
$66,136
Median Household Income
$40,863
Median Earnings
$1,048
Median Rent
$229,600
Median Home Value
Market
Vacancy Rate% for Office in Northeast region

Questions? Ask Rey
Realmo’s AI knows this listing — price, zoning, demand, history. Ask anything.




Frequently Asked Questions
What type of property is this?
Mixed-use property - Historic downtown building combining professional office amenities with a licensed Airbnb apartment and private parking.
Where is this mixed-use property located?
The property is located at 133135 133-135 Broadway Bangor, ME.
What is the asking price?
The asking price for this property is $899,999.
What are key features of this property?
This property features: 20+ parking spots in a private lot; Built in 1870 with original hardwood floors and restored woodwork; Multiple private offices and conference rooms