Live-Work Building With Office And
1323 S Cass Street Traverse City, MI 49684
For Sale
$899,000
COMMERCIAL - Traverse City, MI
Property Size1,792 SF
Lot Size0.28 Acres
Price / SF$501.67
Days on Market80
Property Features for 1323 S Cass Street
General Information
- Property type
- Commercial Sale
- Property subtype
- Other
- Parking features
- Parking Lot
- Exterior features
- Vinyl, Wood, Steel
- Standard status
- Active
- Size
- 1,792 SF
- Lot size
- 0.28 Acres
Taxes and HOA fees
- Tax Description
- LOTS 16-17-18 BLK 6 WILHELM'S ADDITION
Building Details
- Building materials
- Frame
- Roof type
- Metal
Listing Agency:
REMAX Bayshore - Union St TC
(231) 941-4500
Listed By:
Troy Daily · License #6501442788
(231) 288-7676
Added: May 7
Changed: Jul 15
Last Checked: Jul 25 at 12:06AM
MLS# 1944758
Copyright © 2026 Northern Great Lakes Realtors MLS. All rights reserved. All information provided by the listing agent/broker is deemed reliable but is not guaranteed and should be independently verified.
Investment Insights
Based on property information with market context.
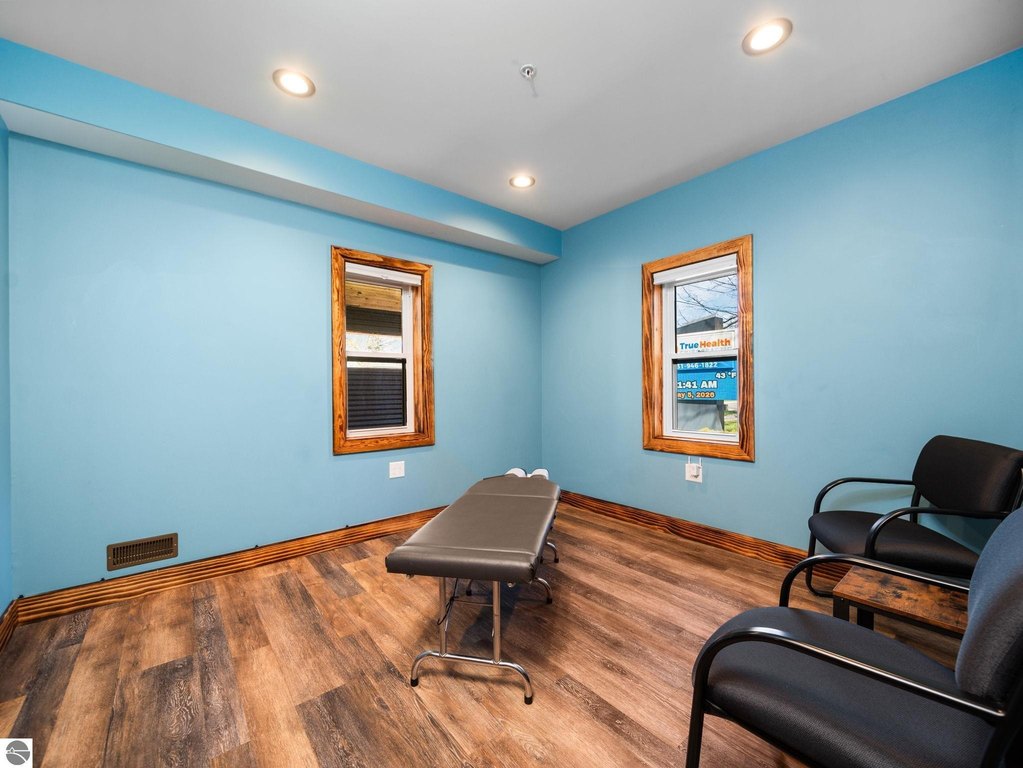
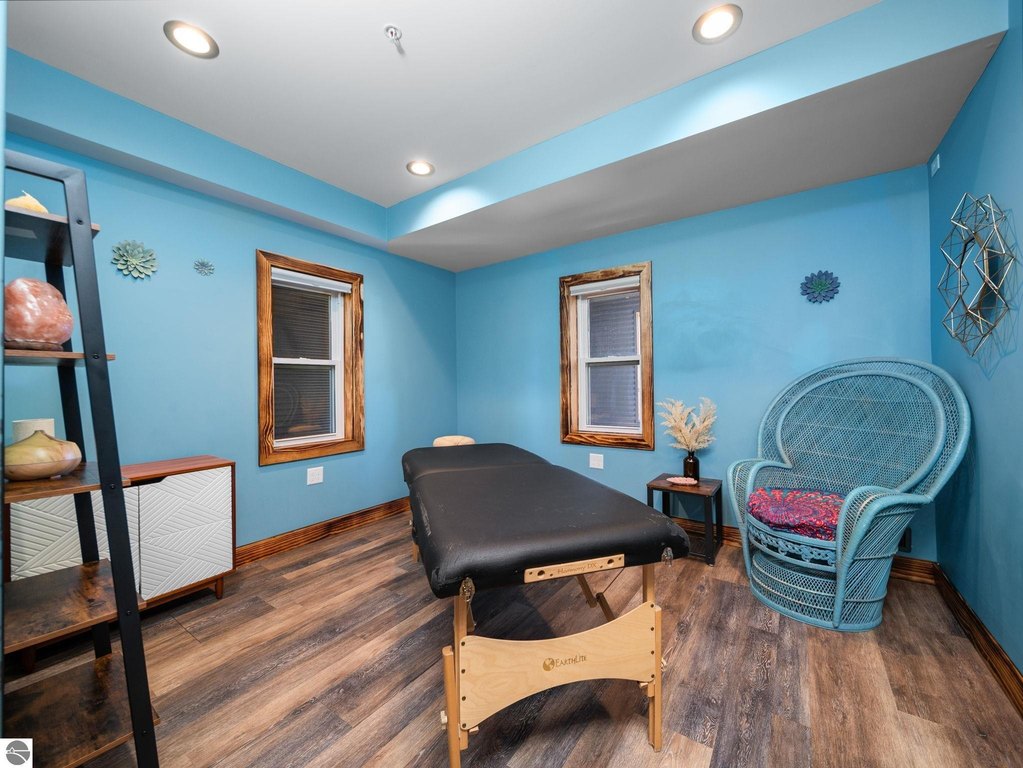
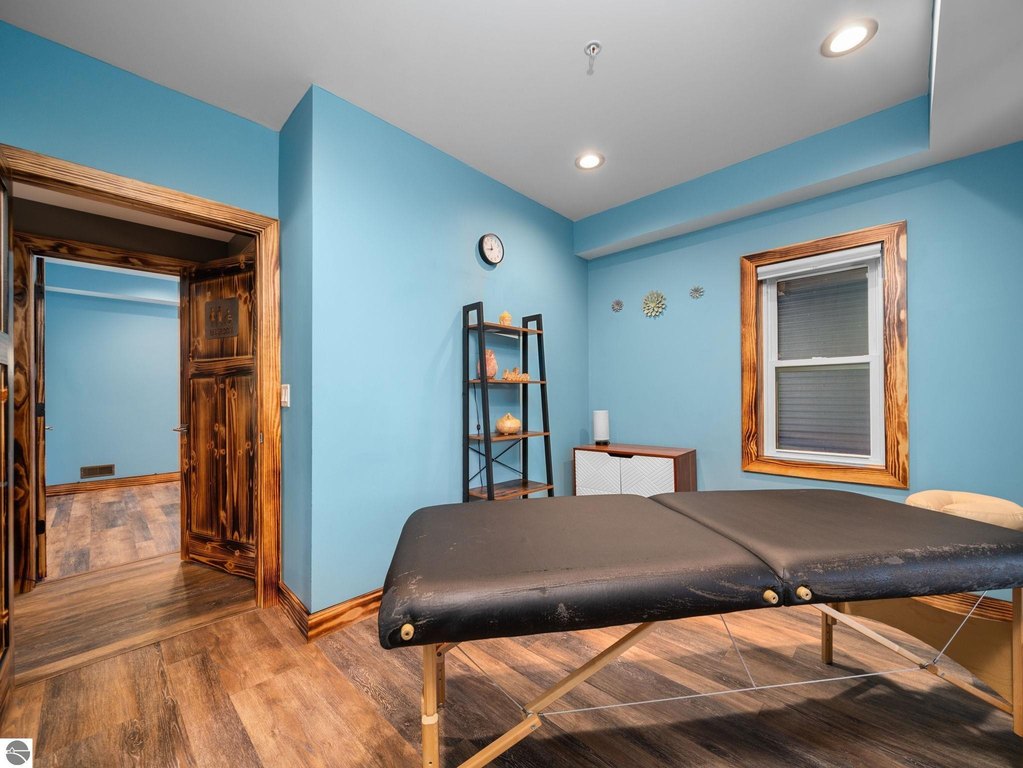
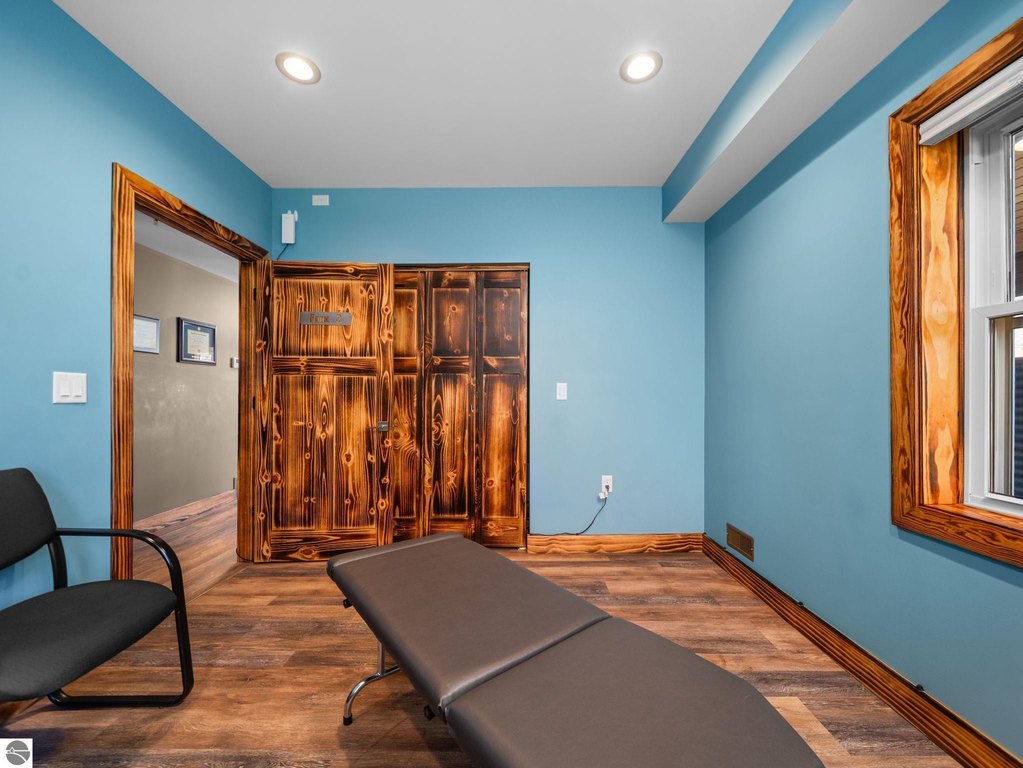
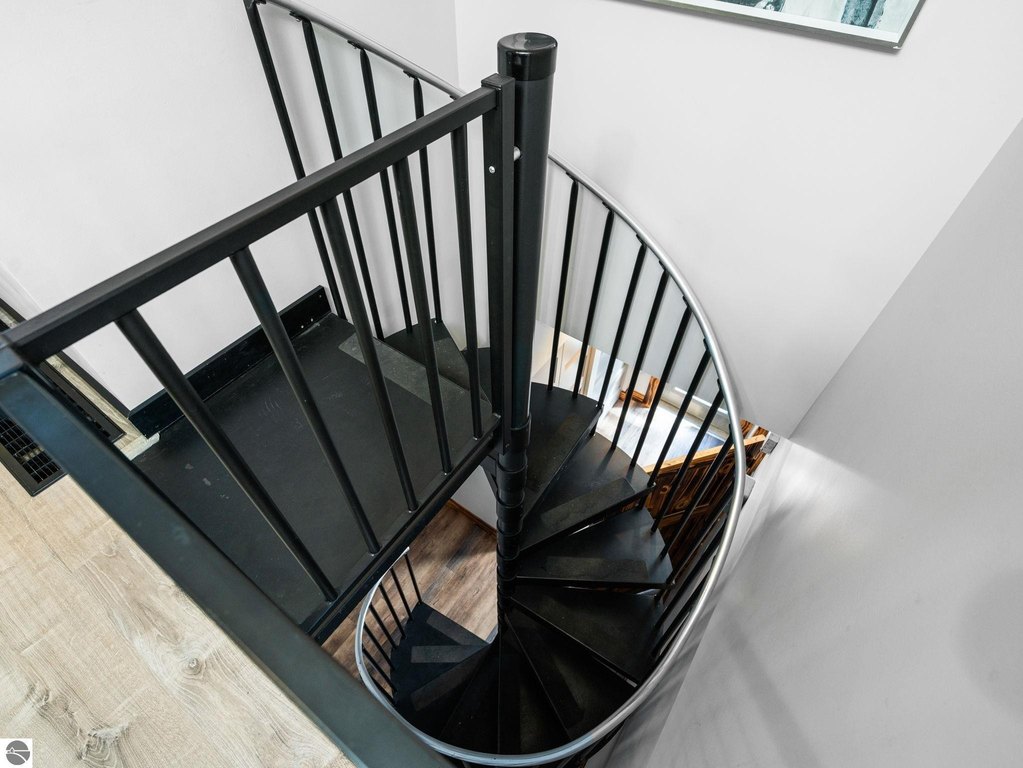
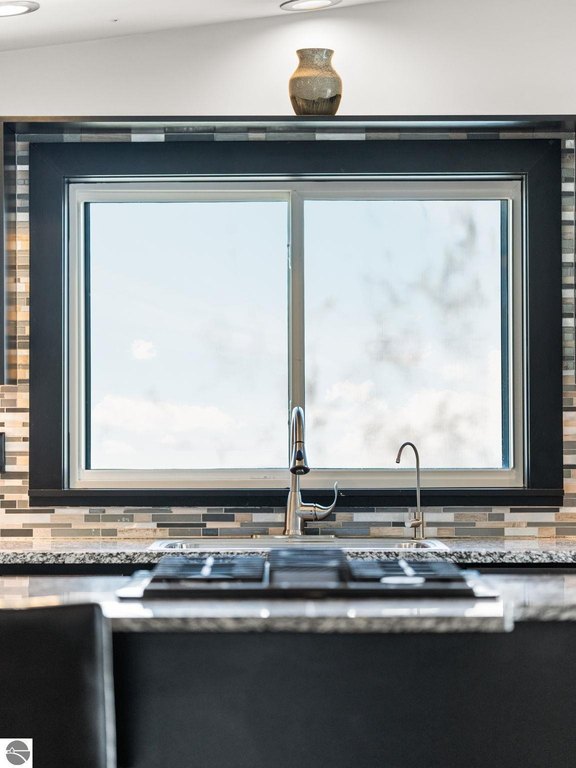
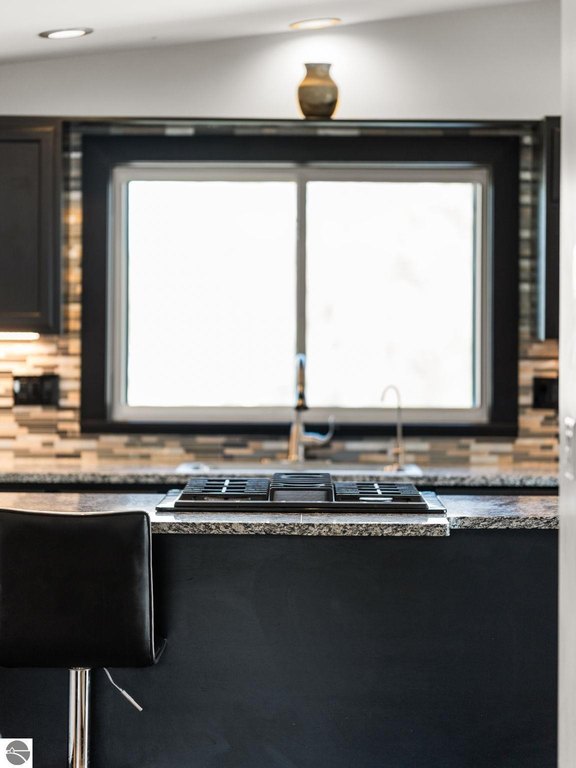
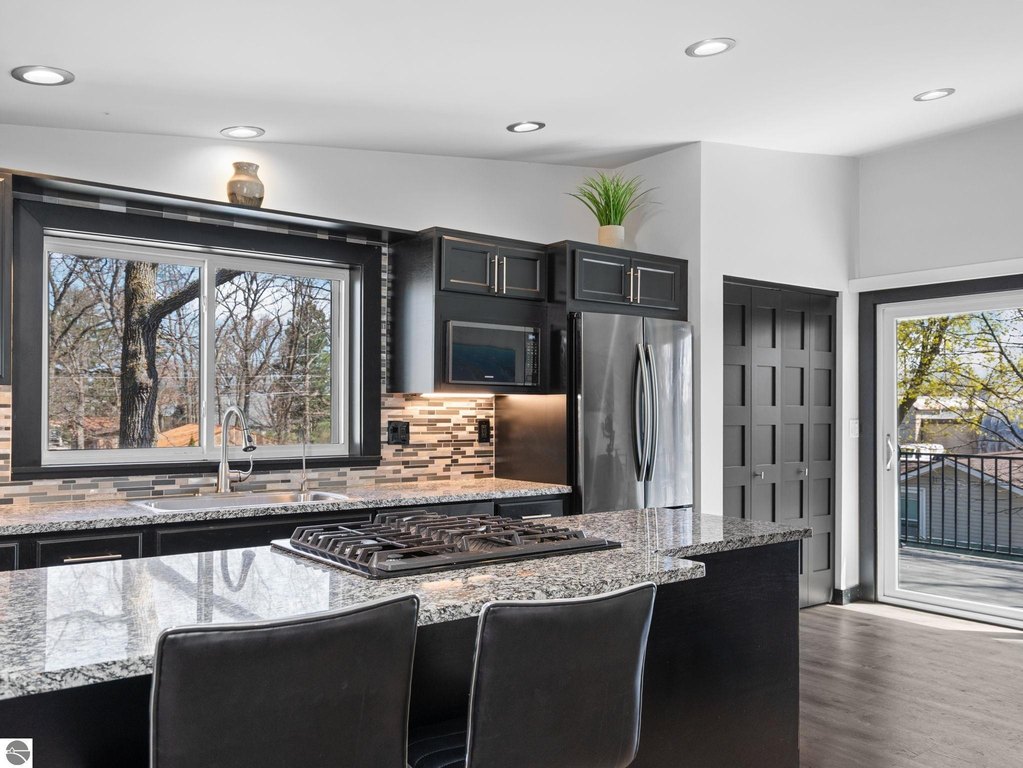
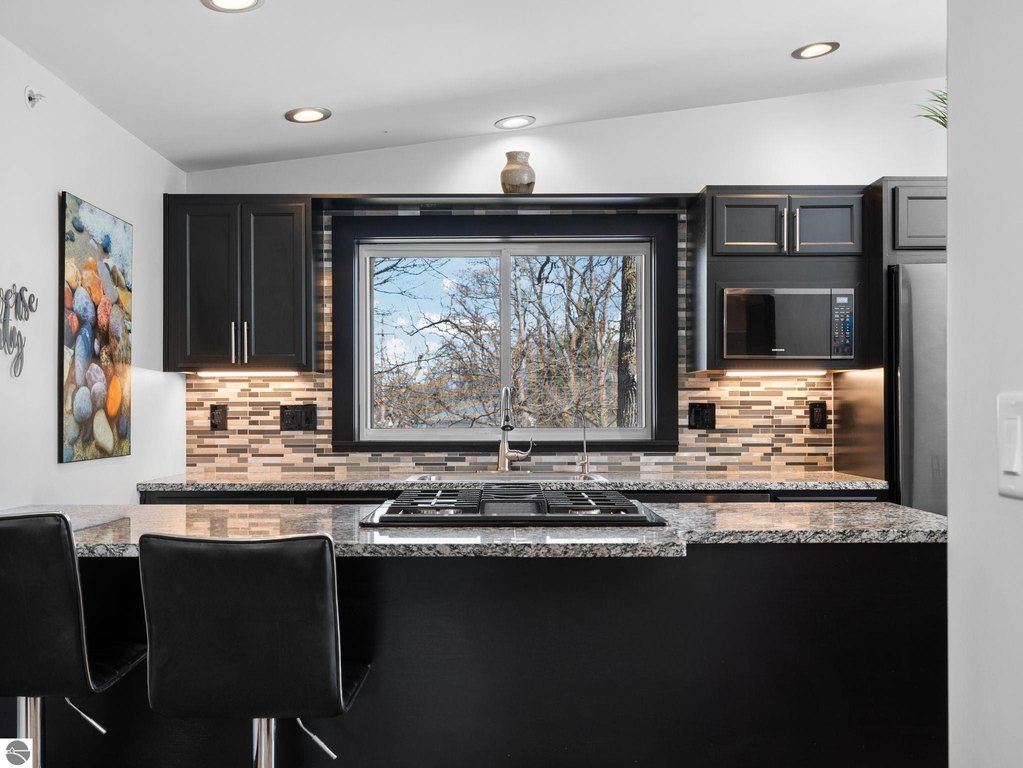
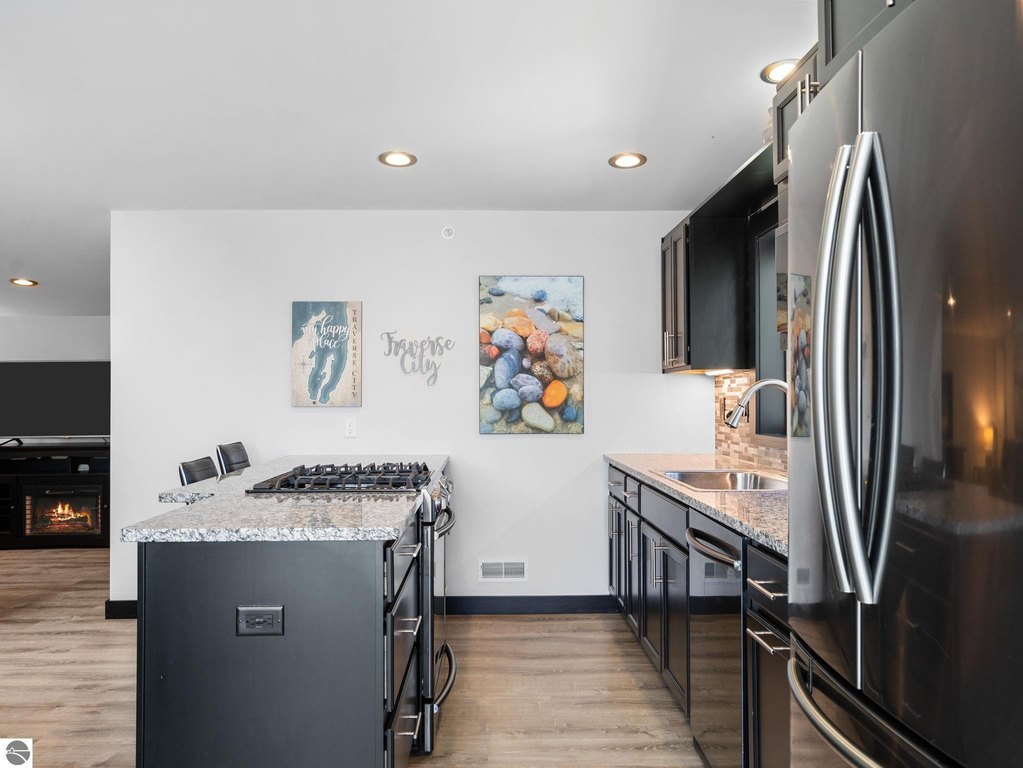
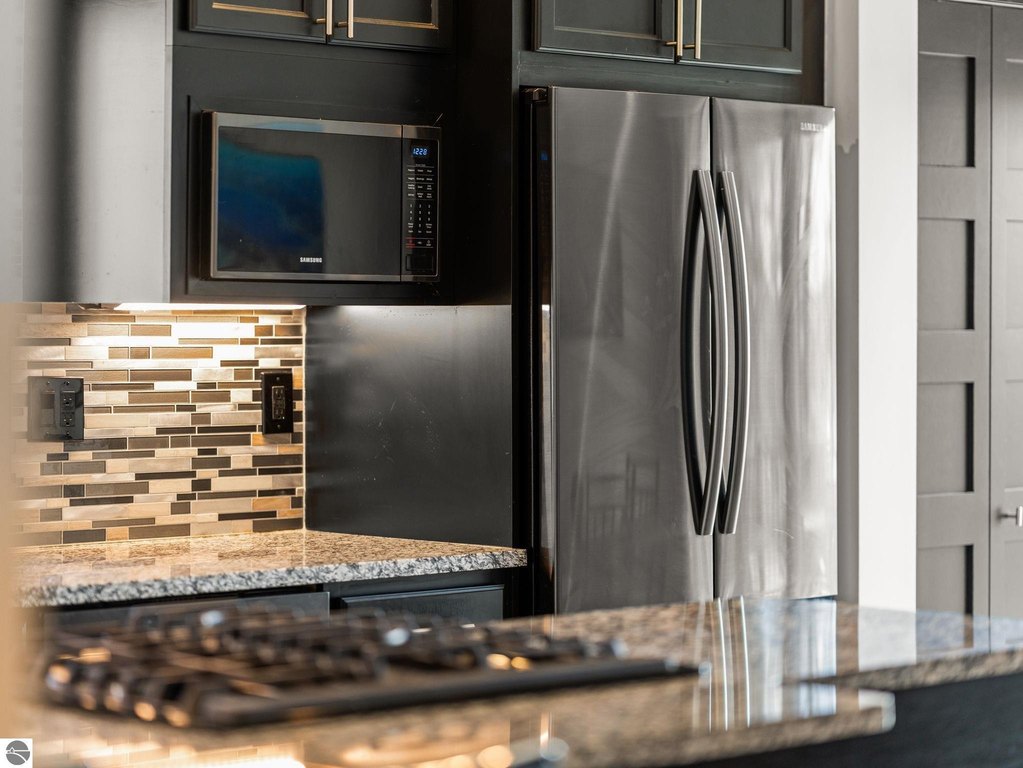
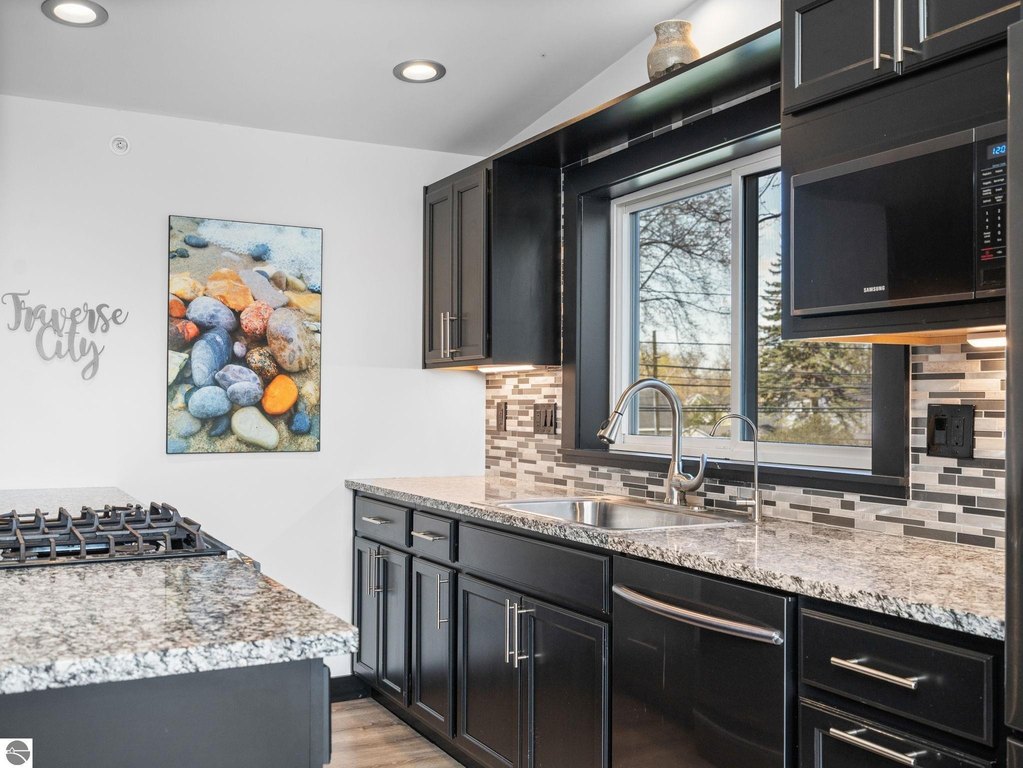
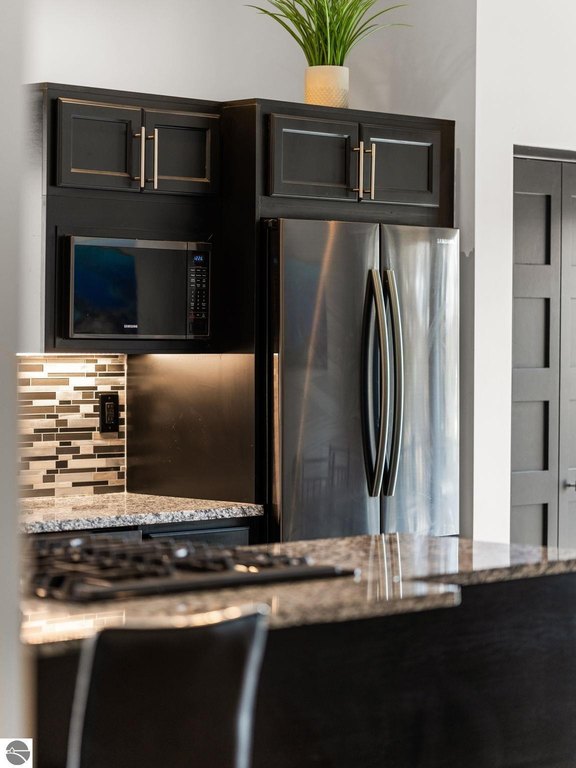
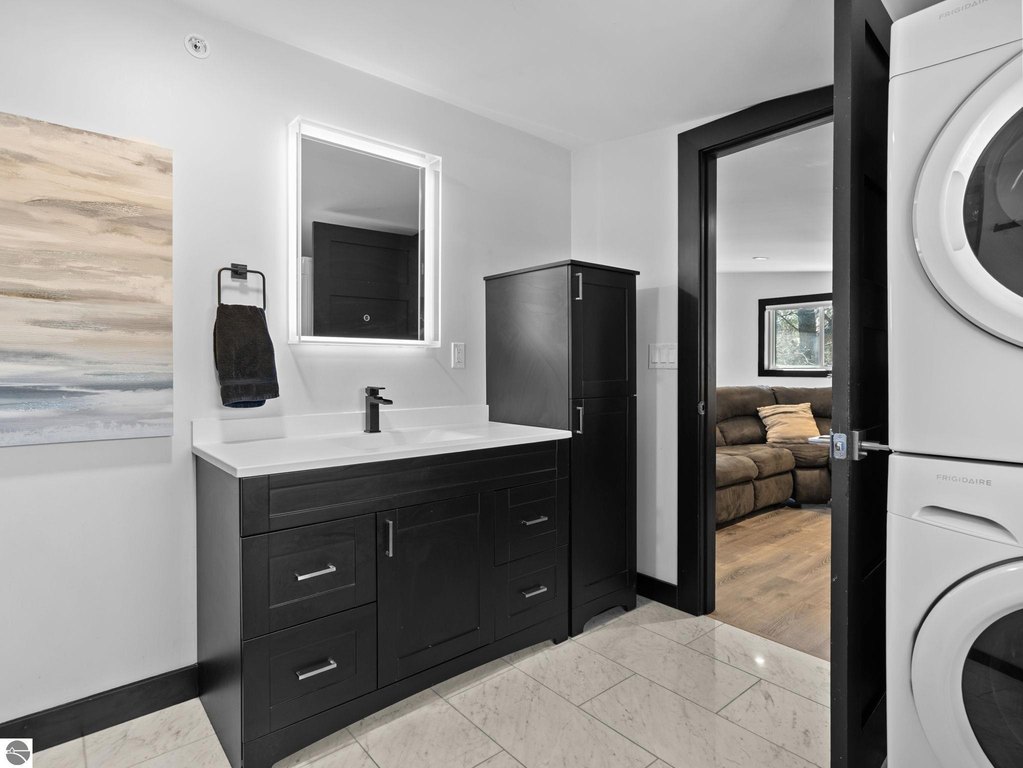
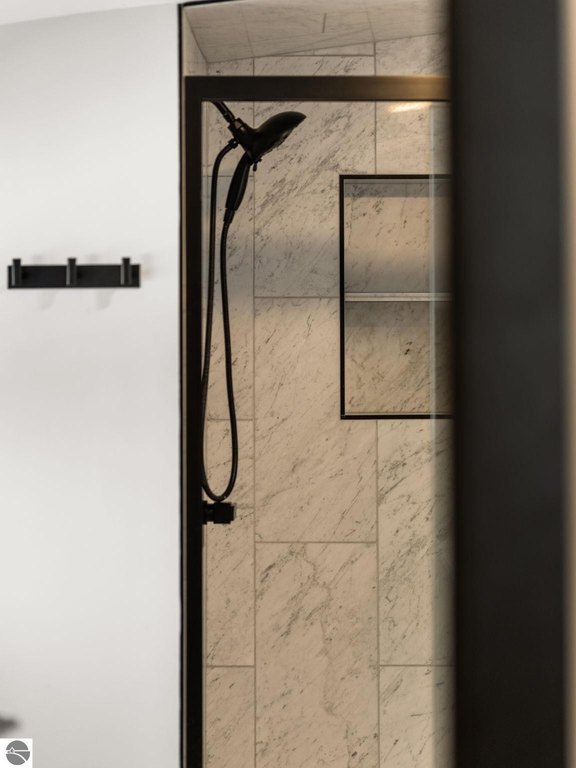
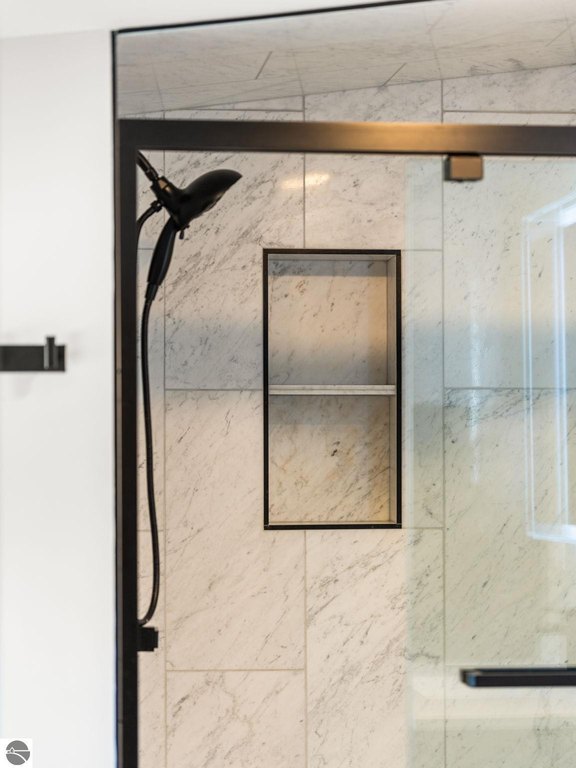
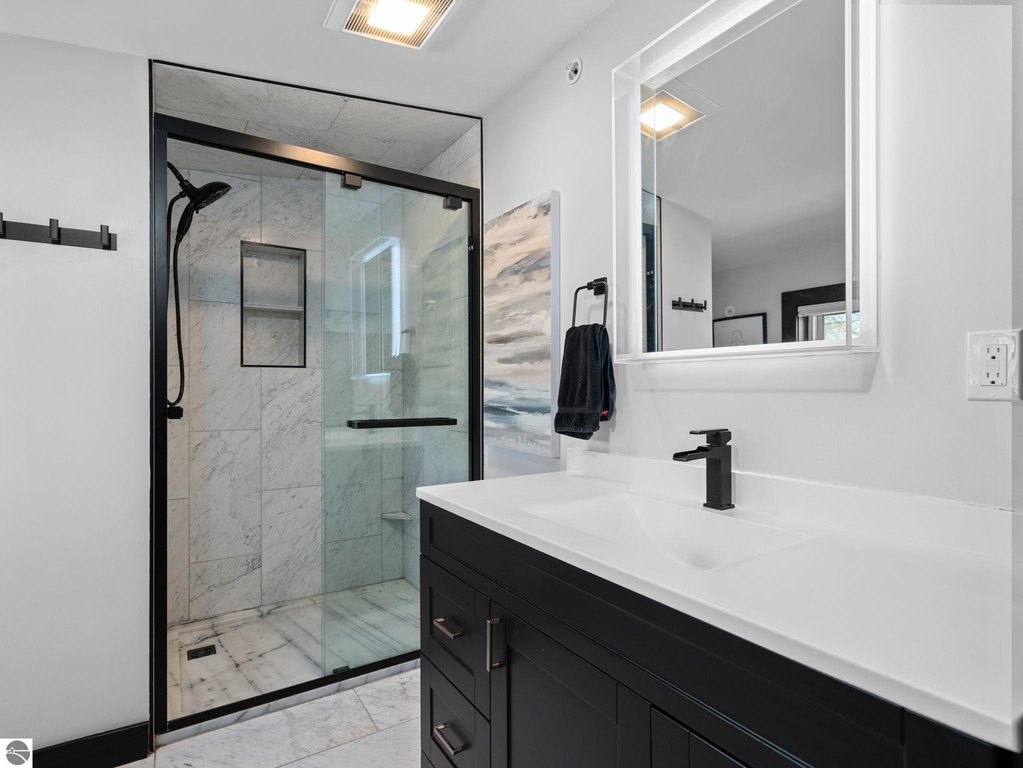
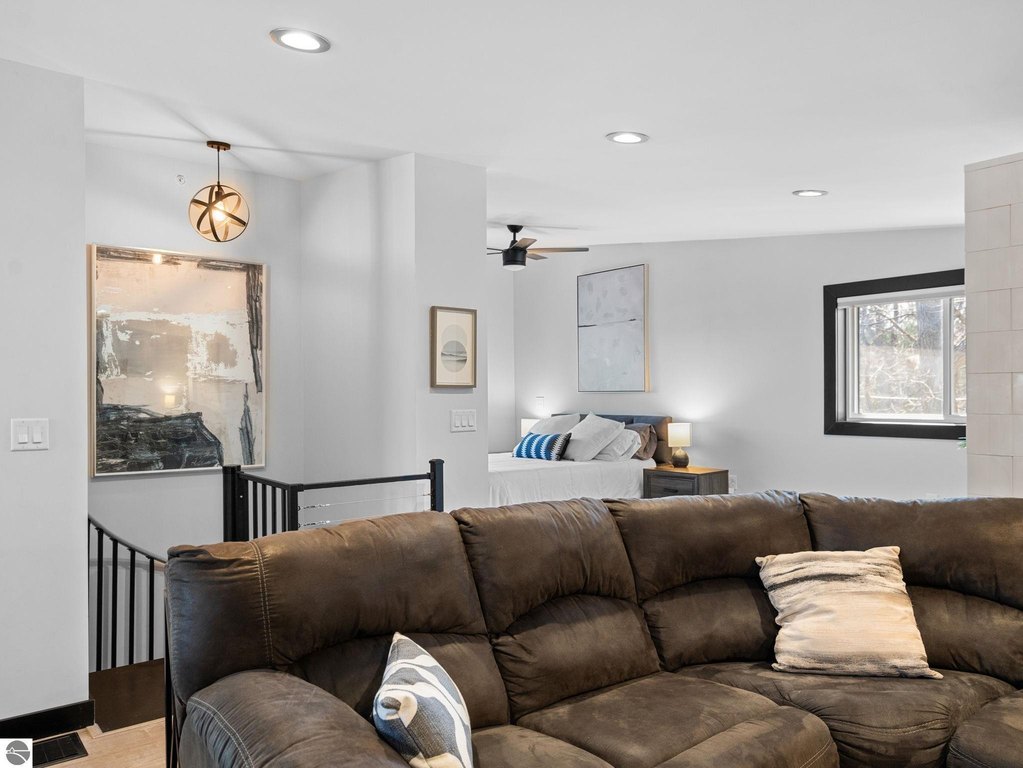
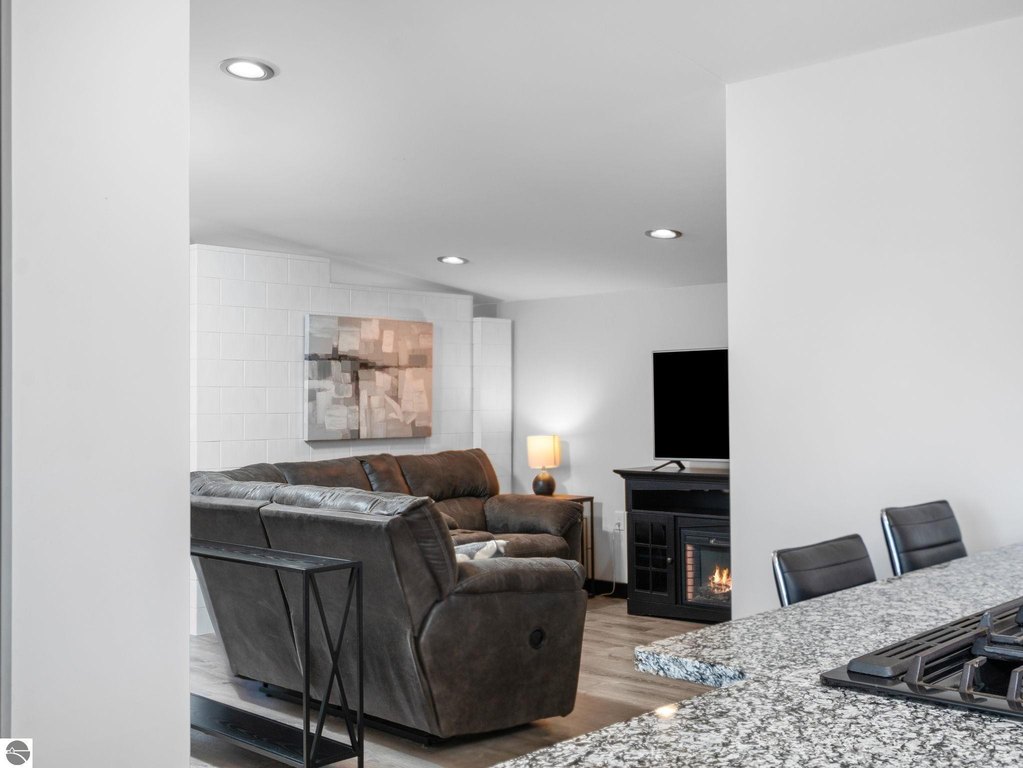
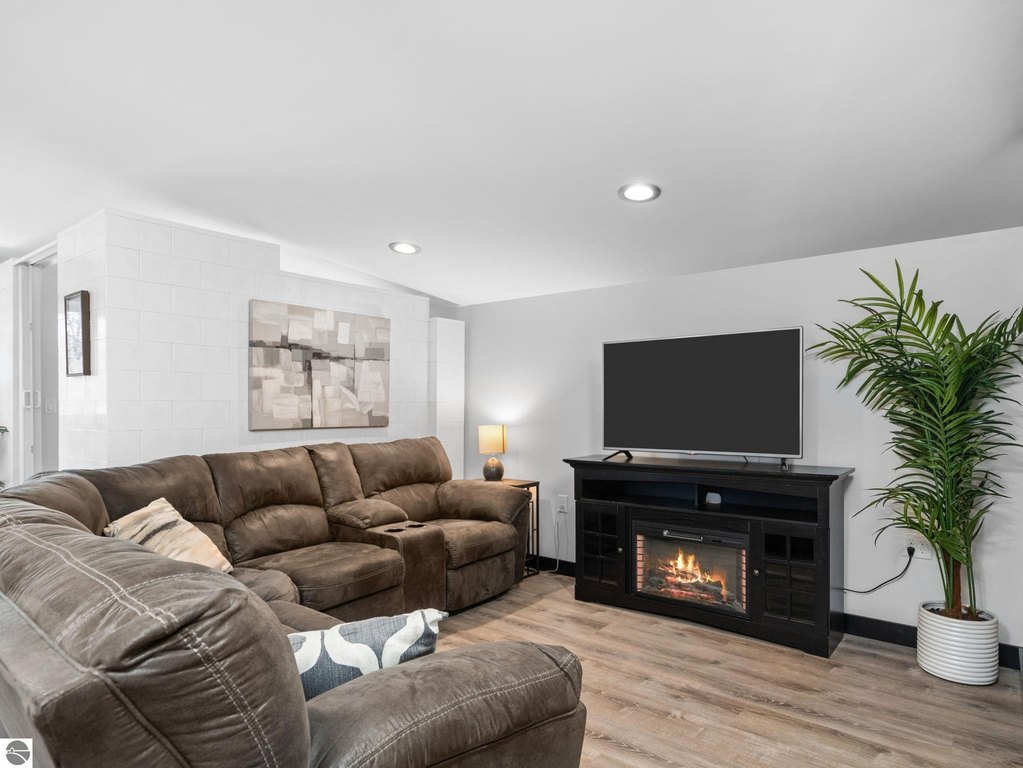
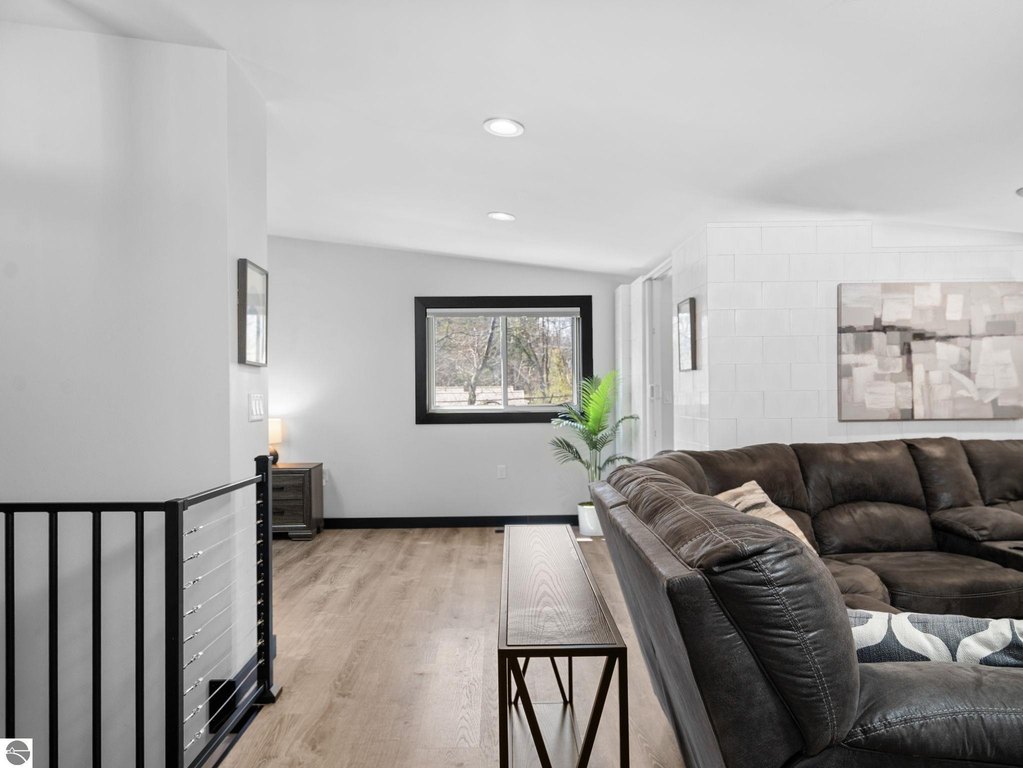
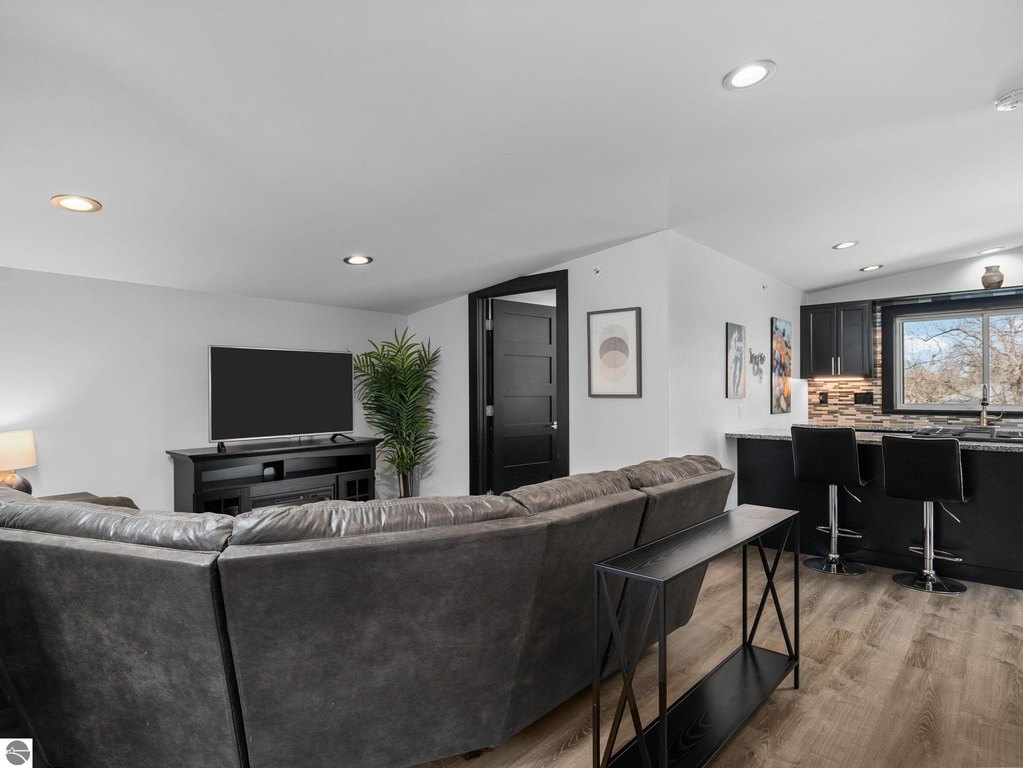
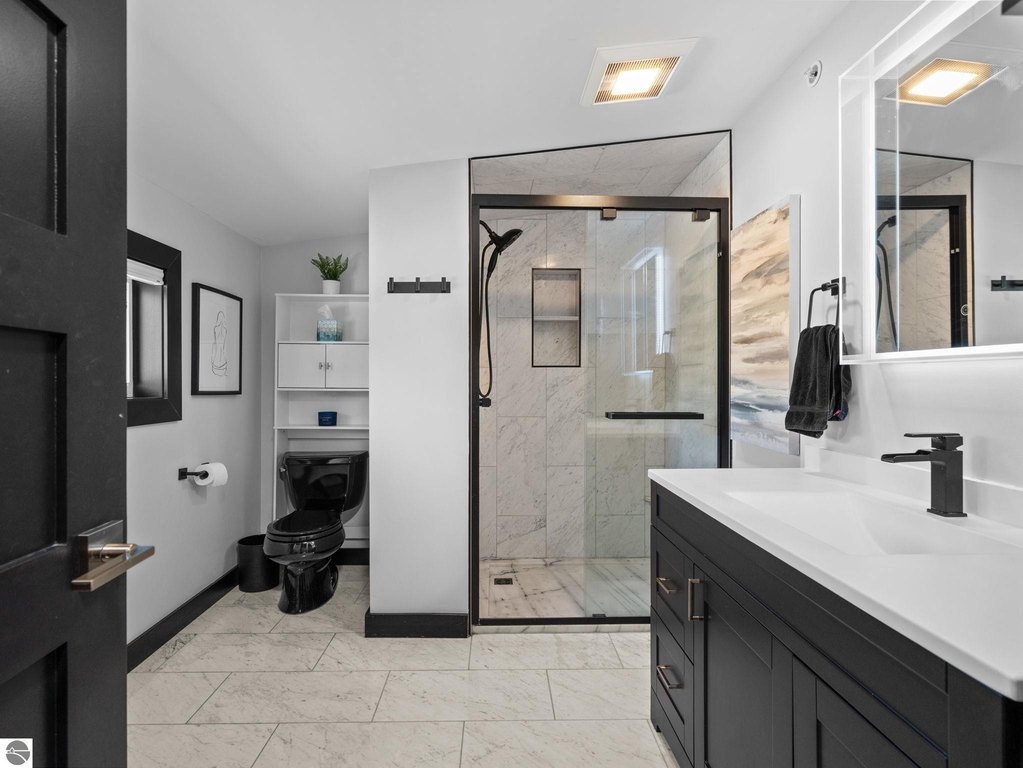
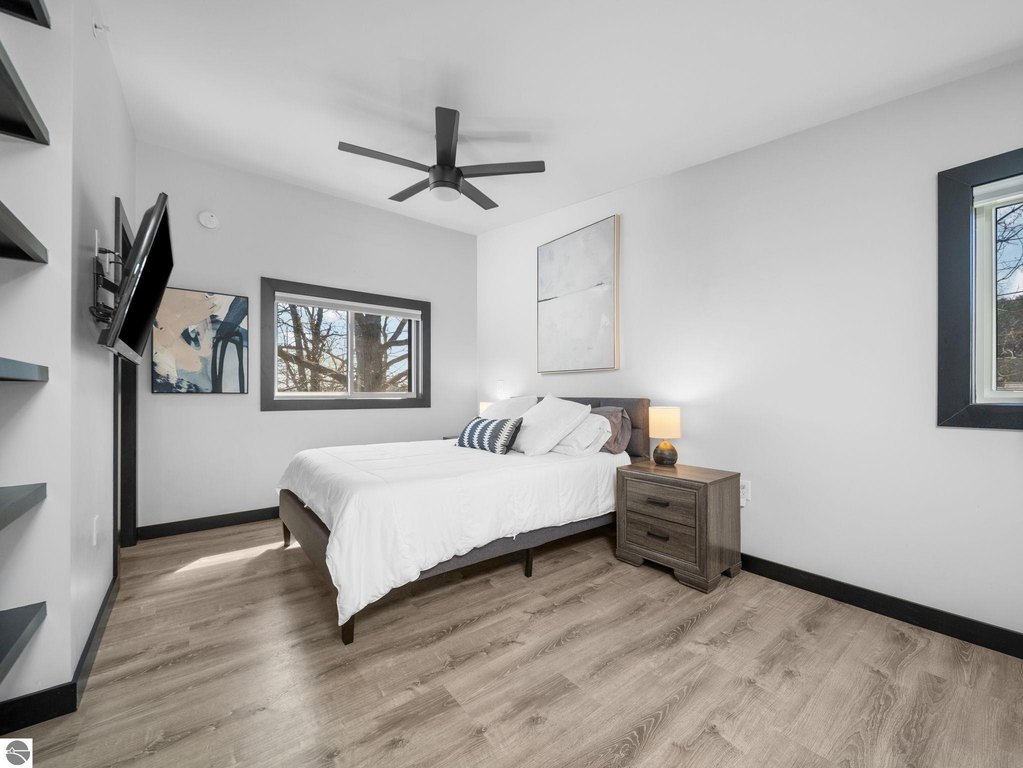
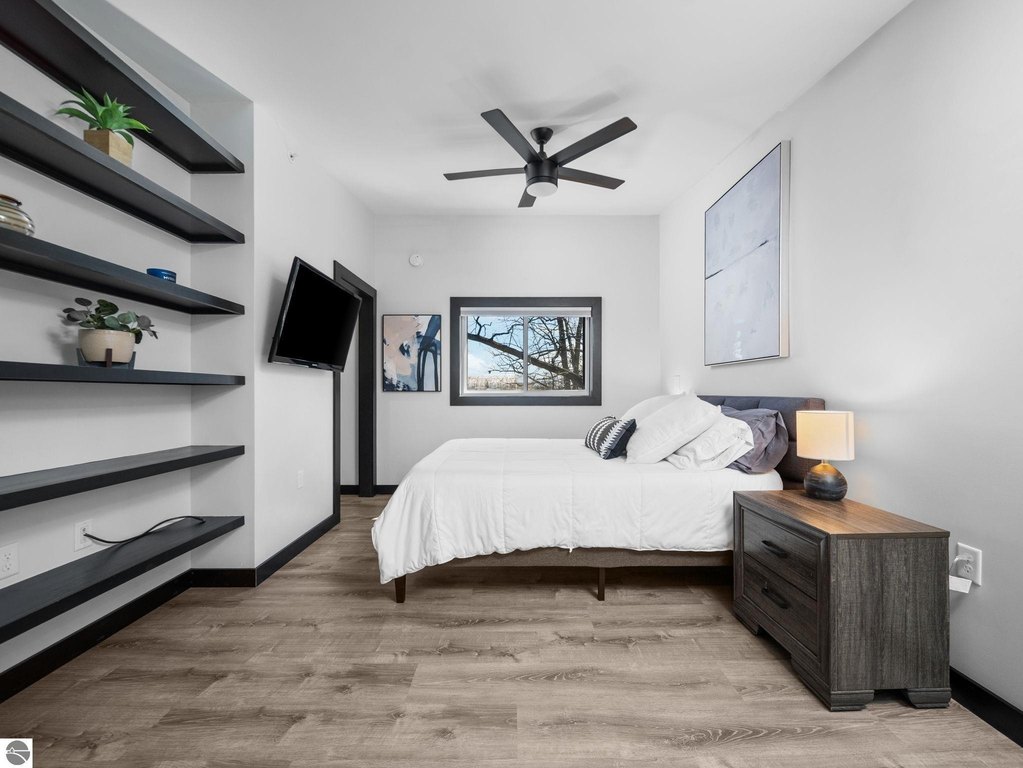
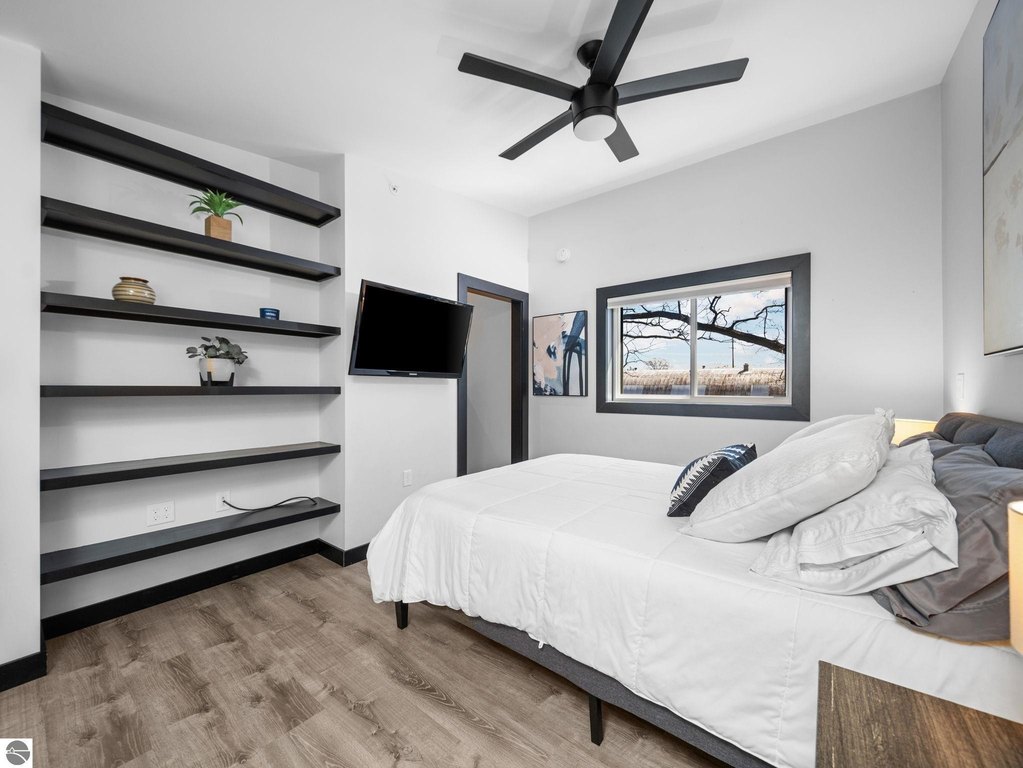
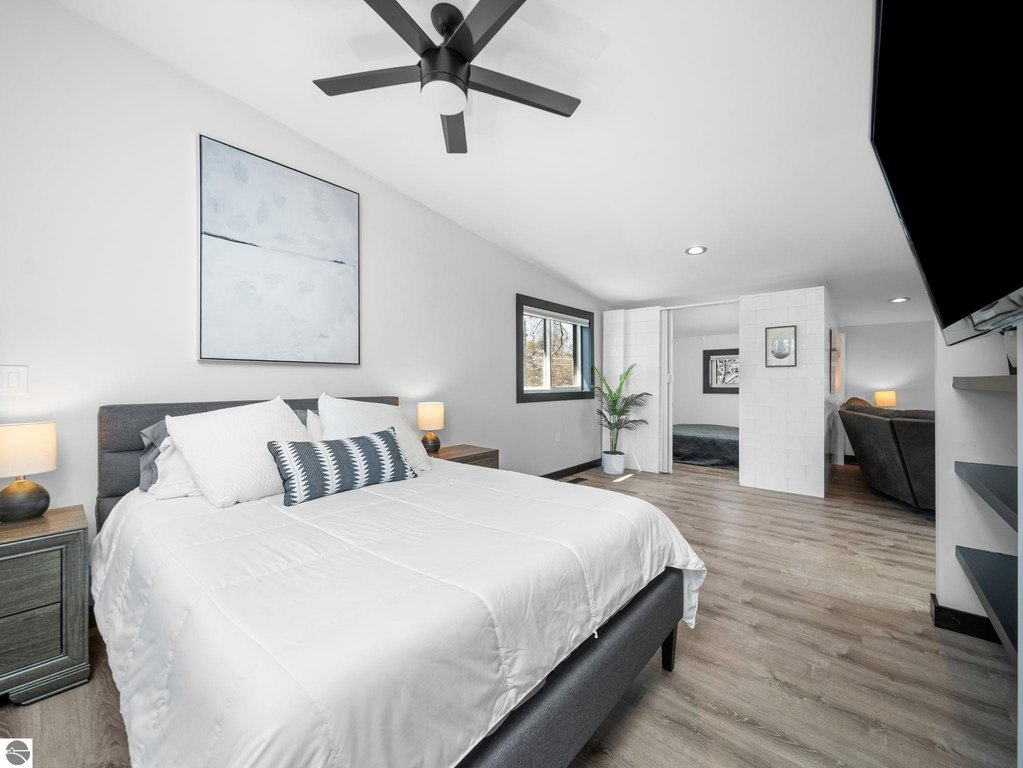
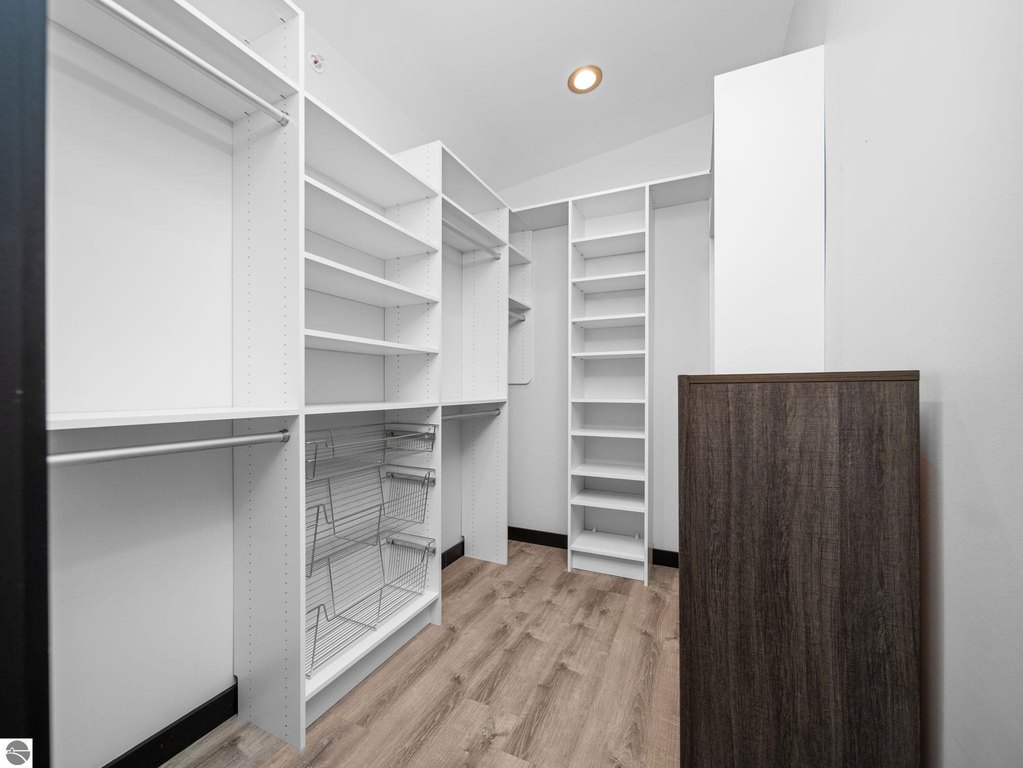
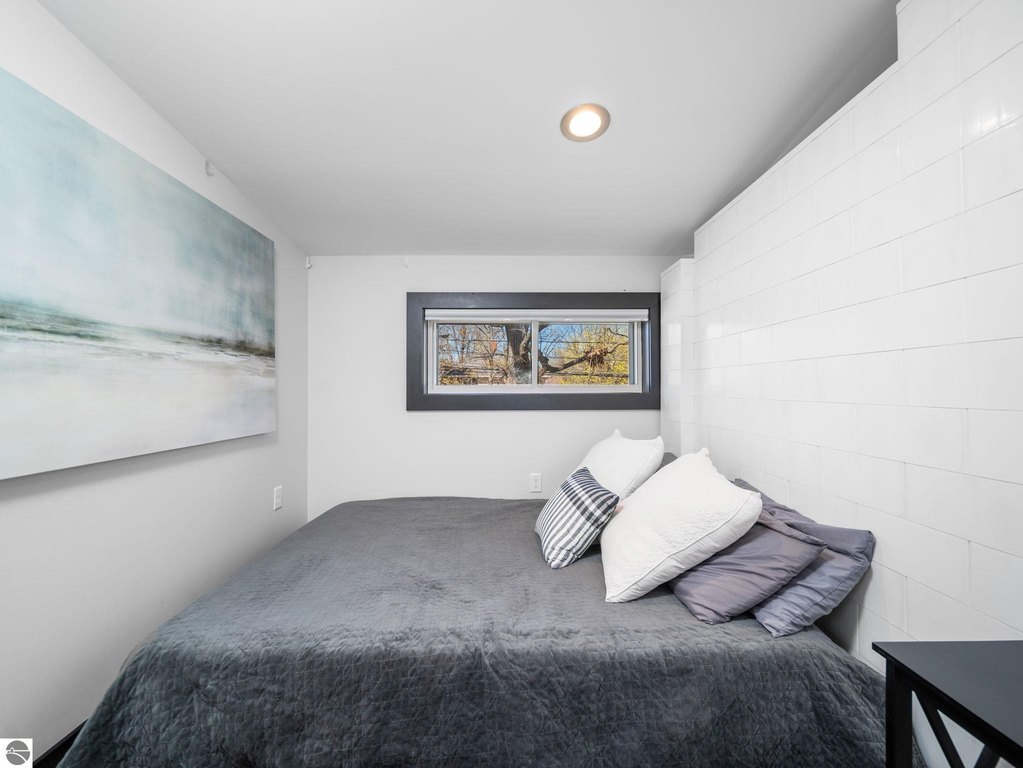
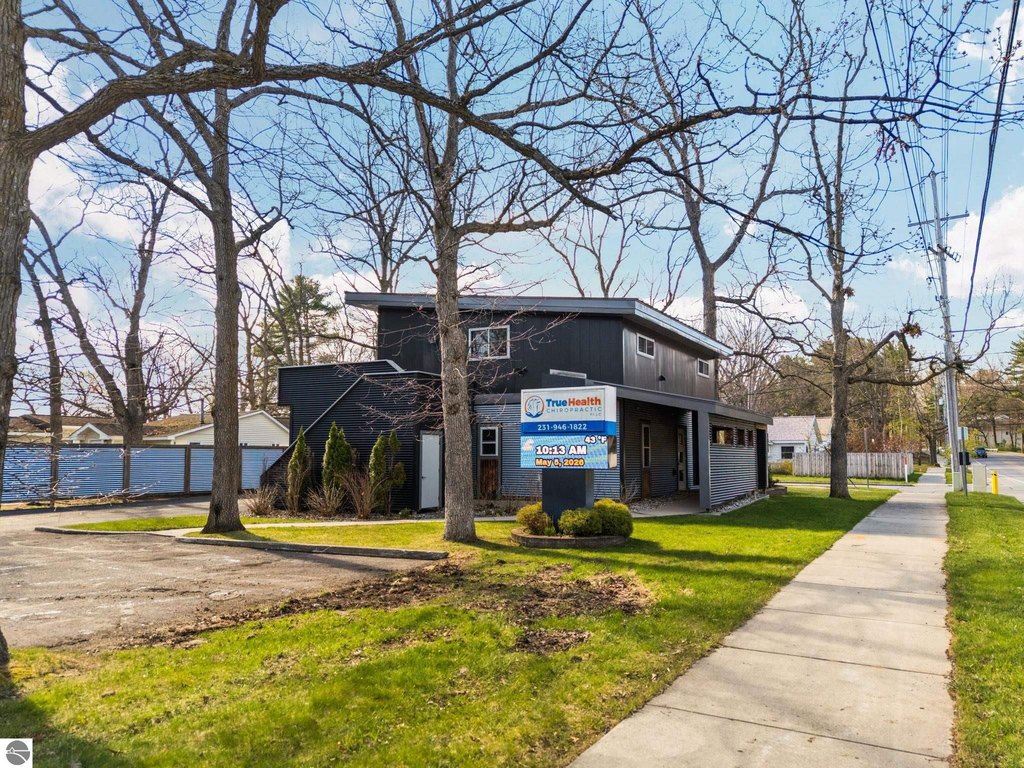
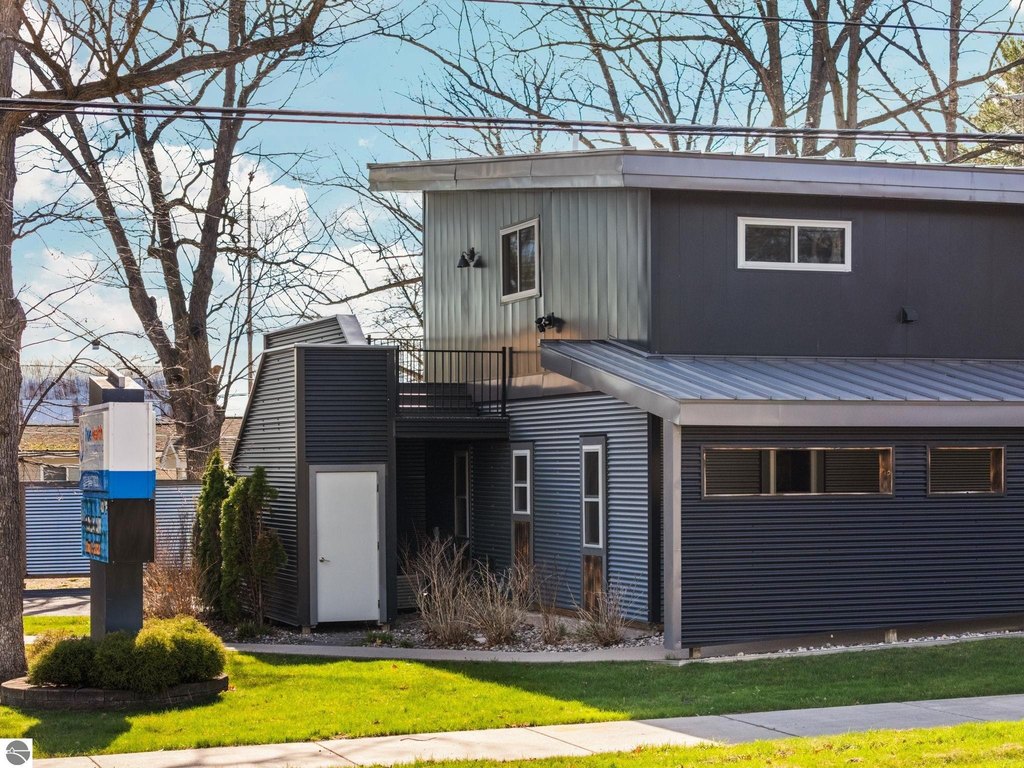
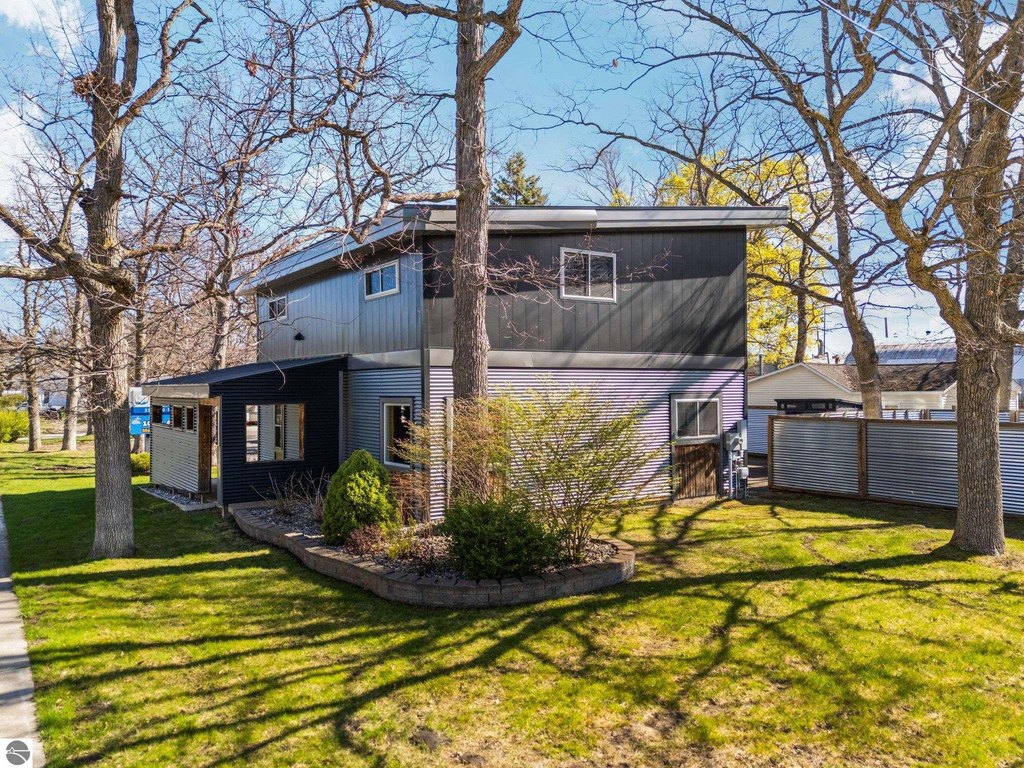
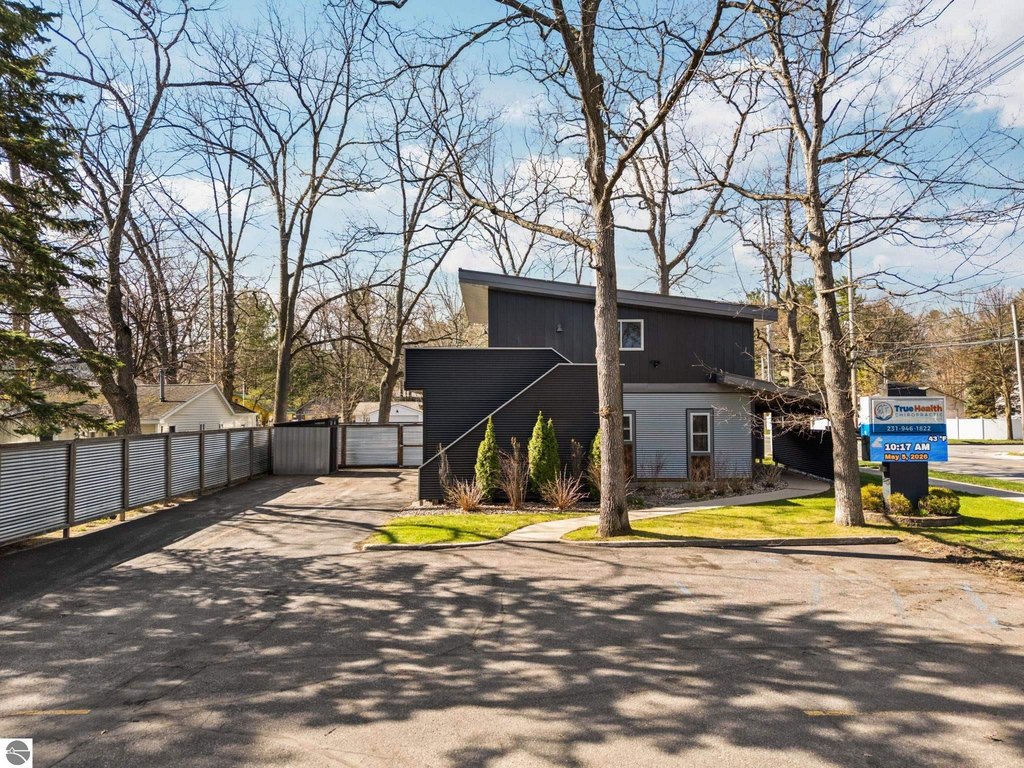
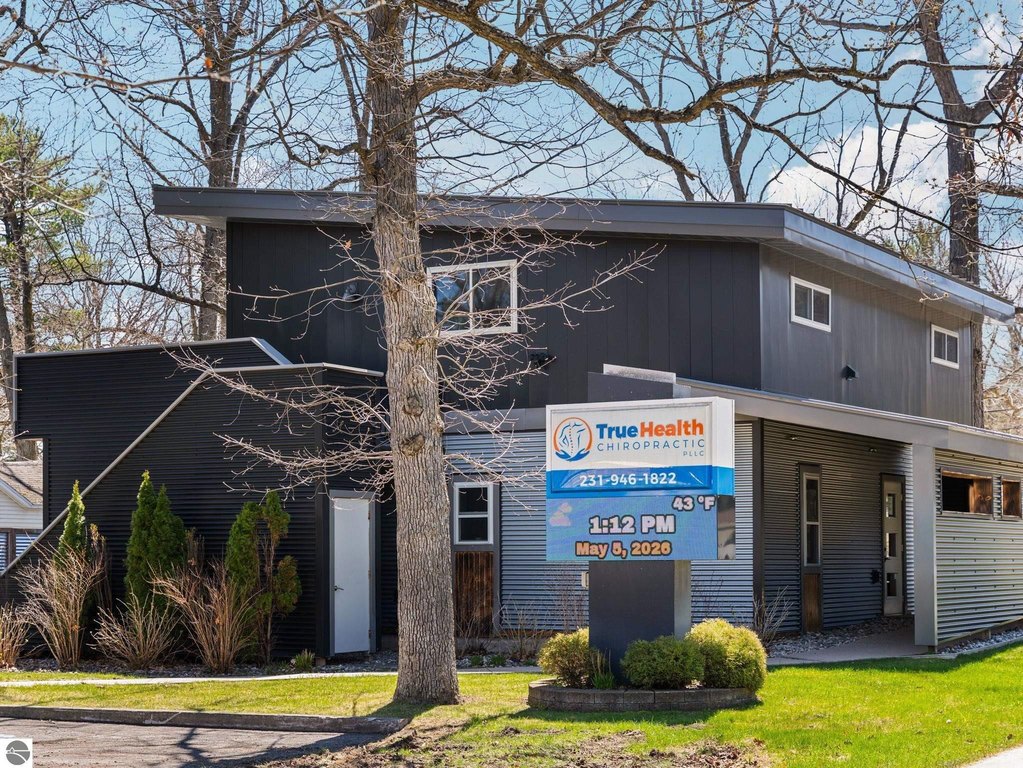
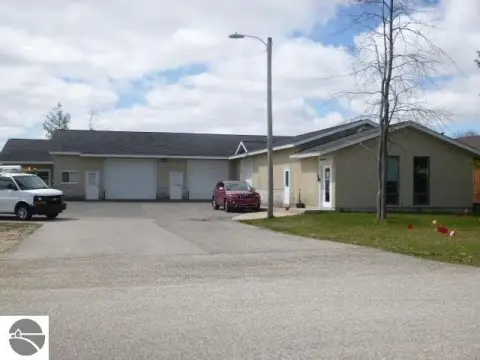
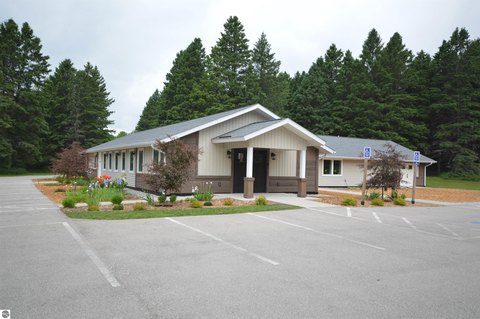
This live-work building offers a turnkey professional office on the main level and a renovated studio apartment on the second level. The property was gut-renovated down to the framing in 2018, including new electrical, plumbing, and flooring, and it now includes a second level added as part of the renovation. The main floor is ADA compliant and configured for professional use with three treatment/private rooms, a half bath, and a reception area with a built-in wooden desk. The second level features a furnished studio apartment with in-floor radiant heat, a custom shower with marble tile, a fully equipped kitchen, and a walk-in closet with built-in storage. A PVC block wall creates a defined private sleeping area, and washer and dryer are included.
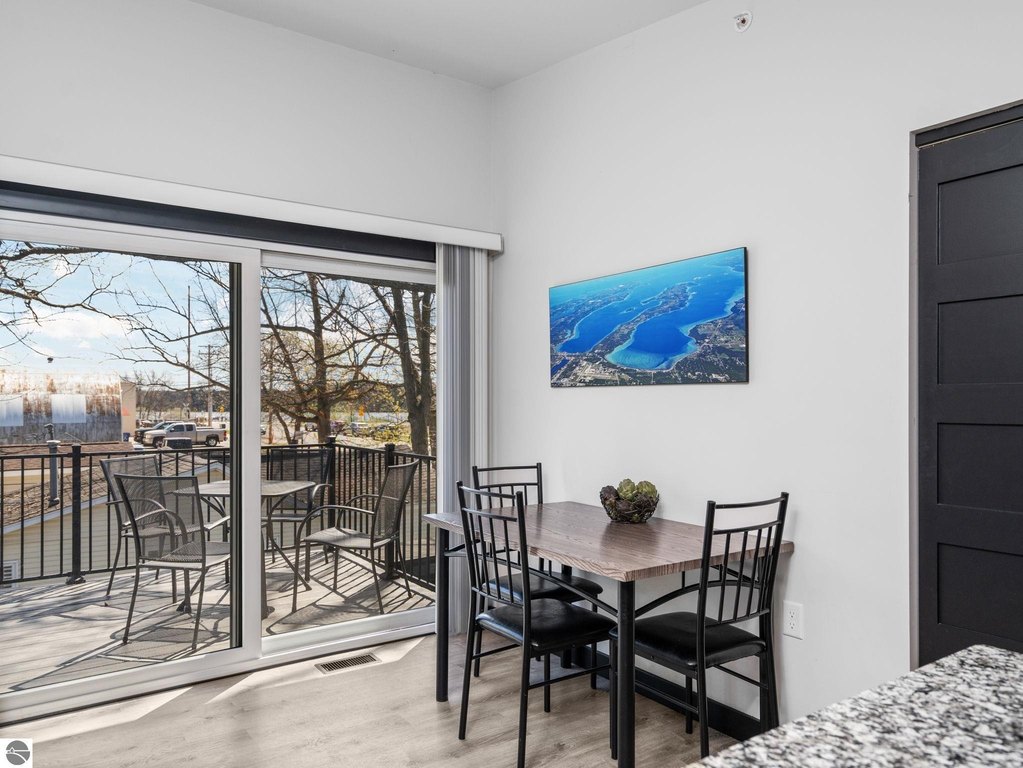
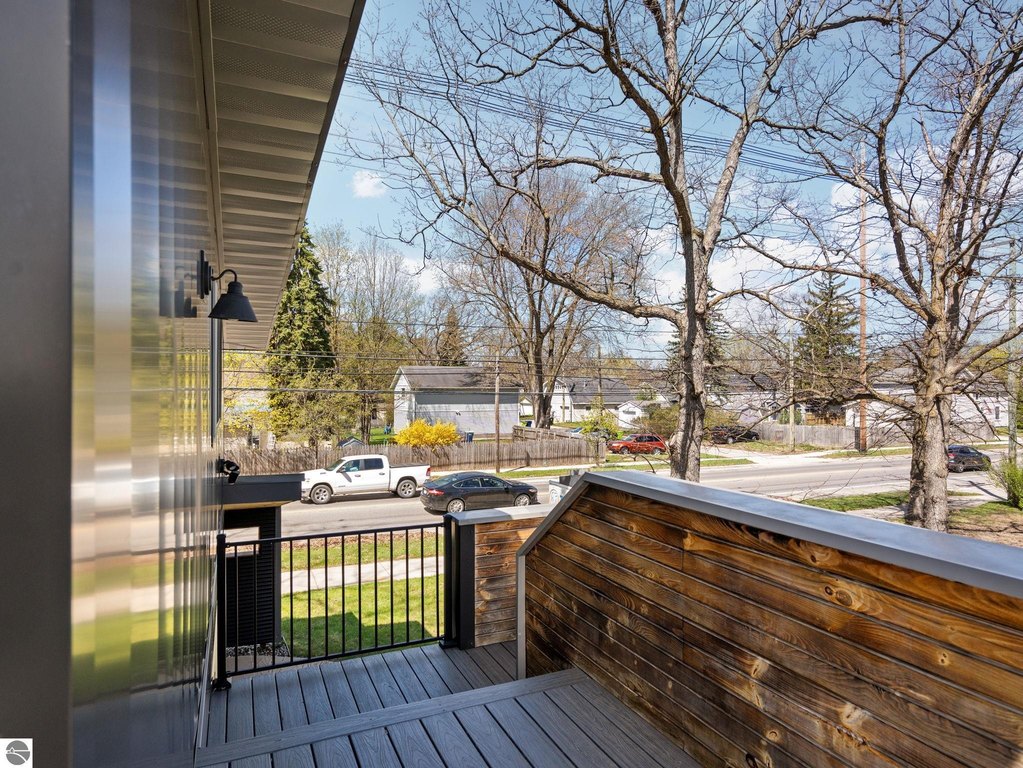
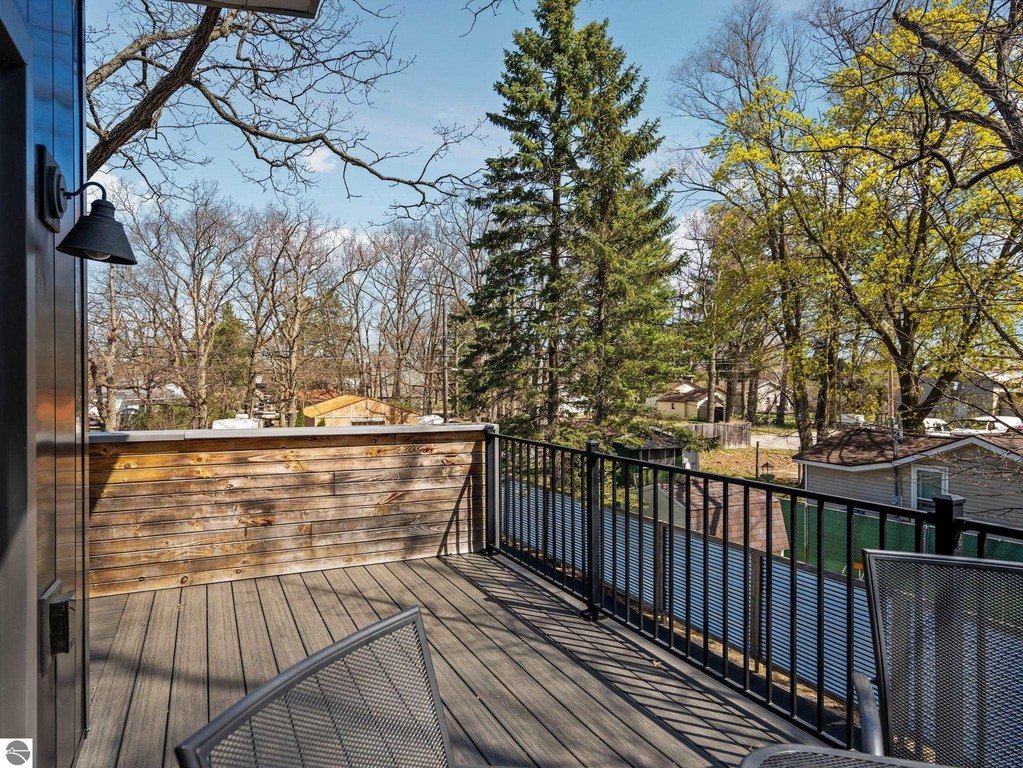
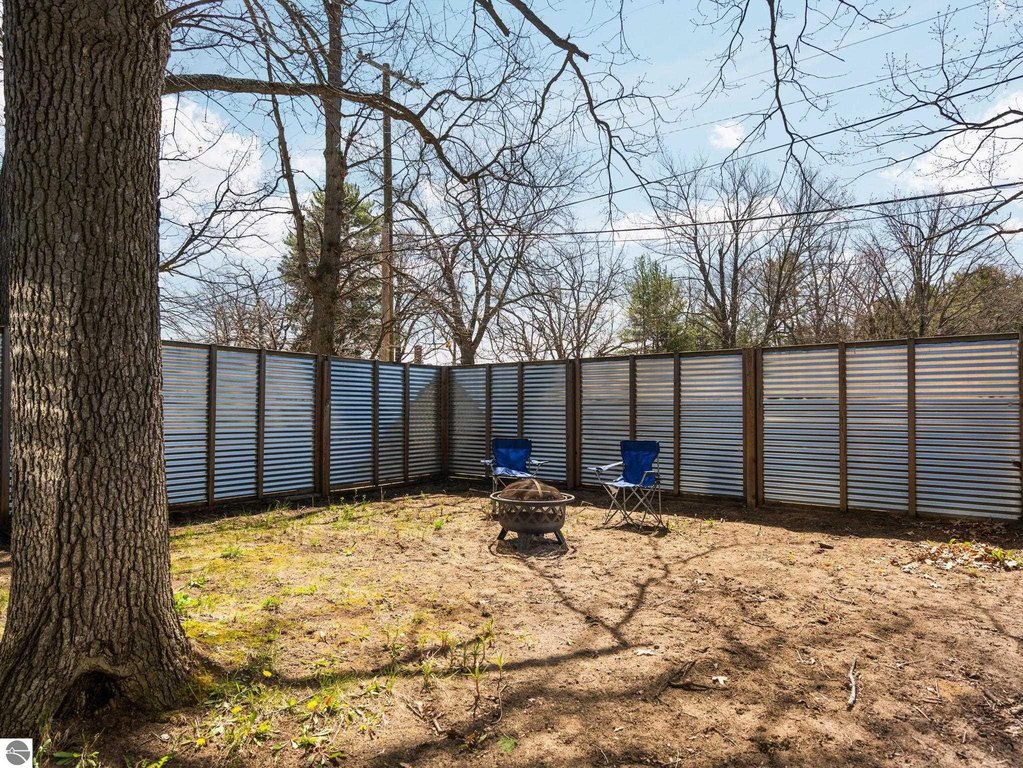
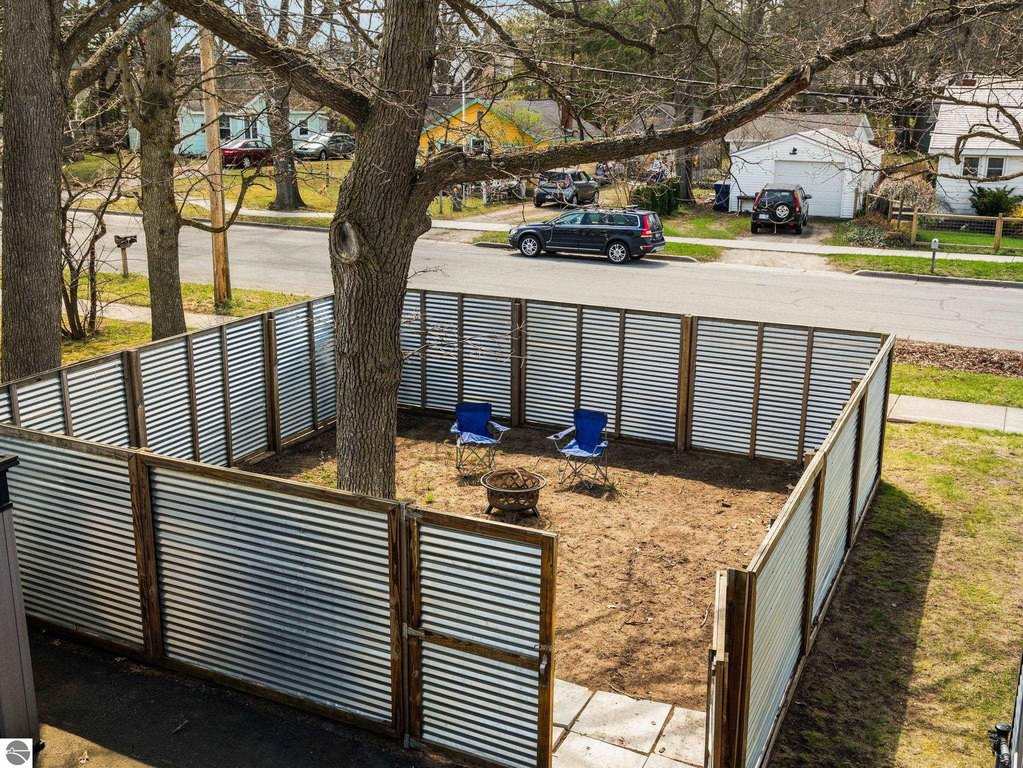
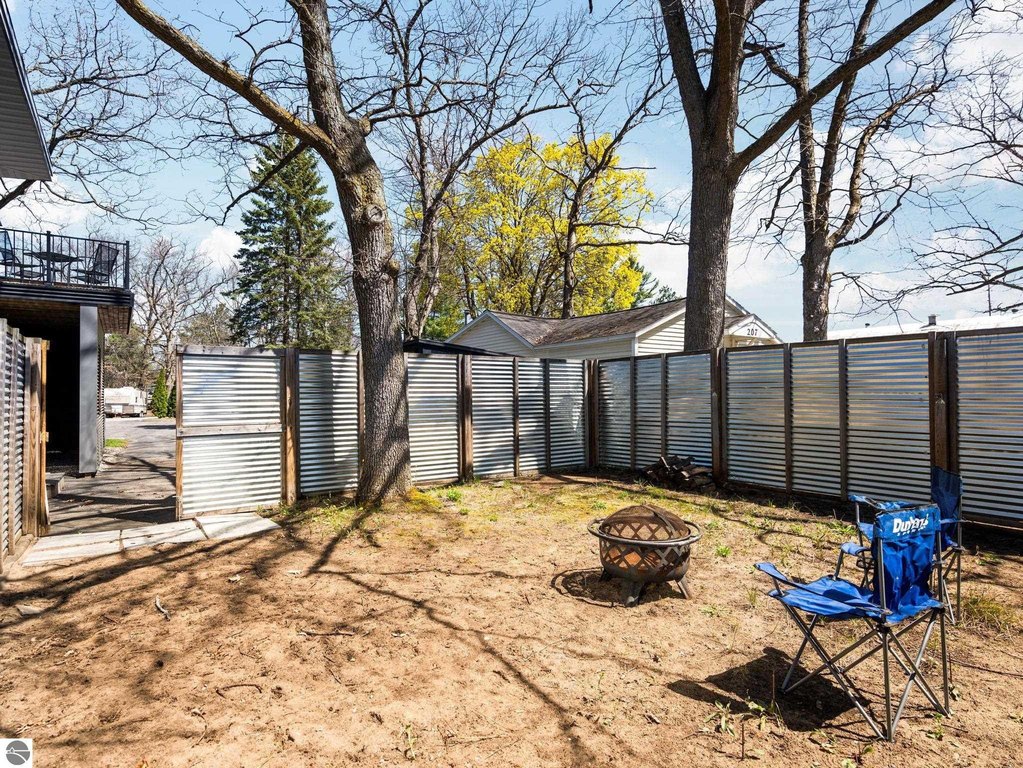
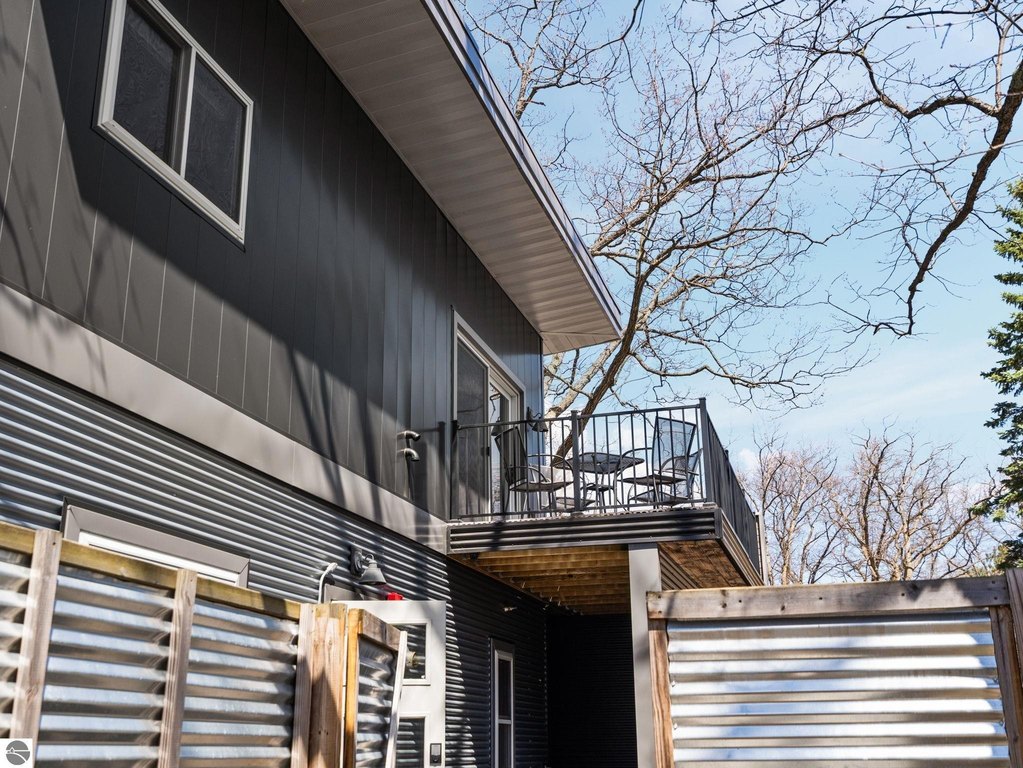
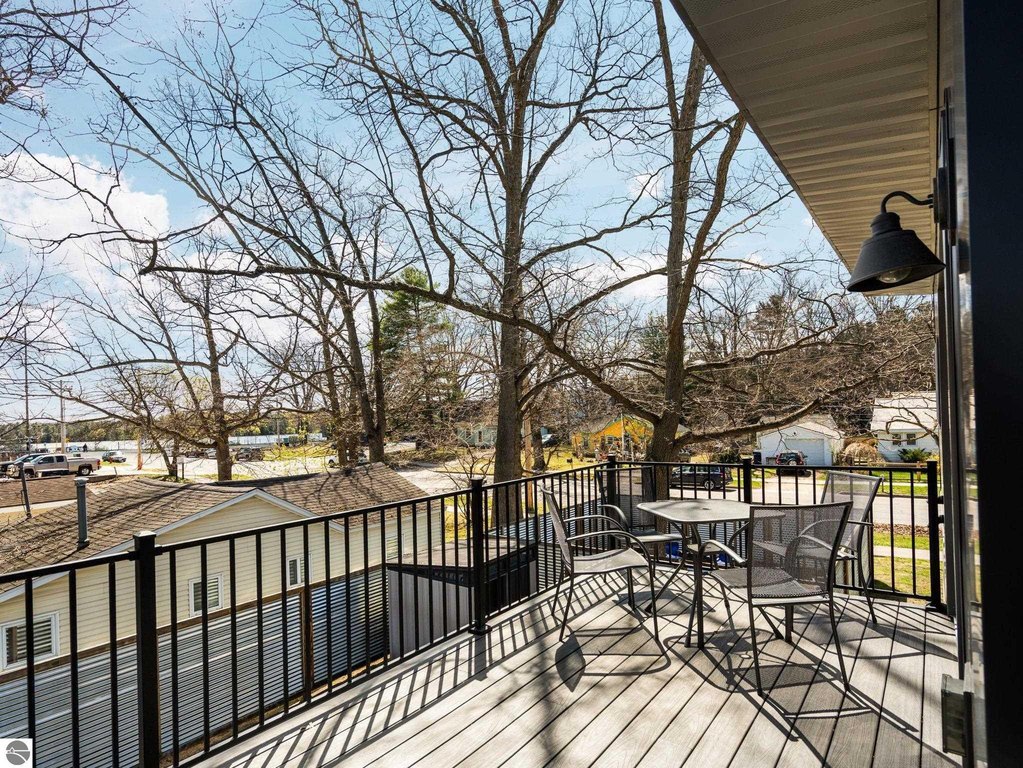
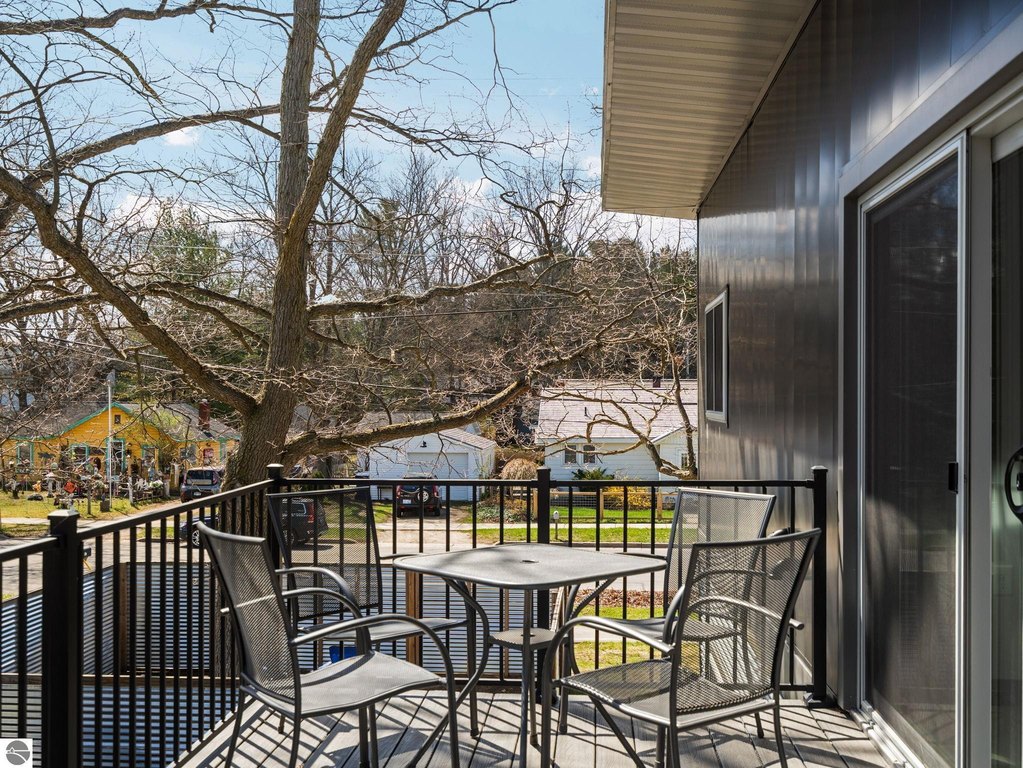
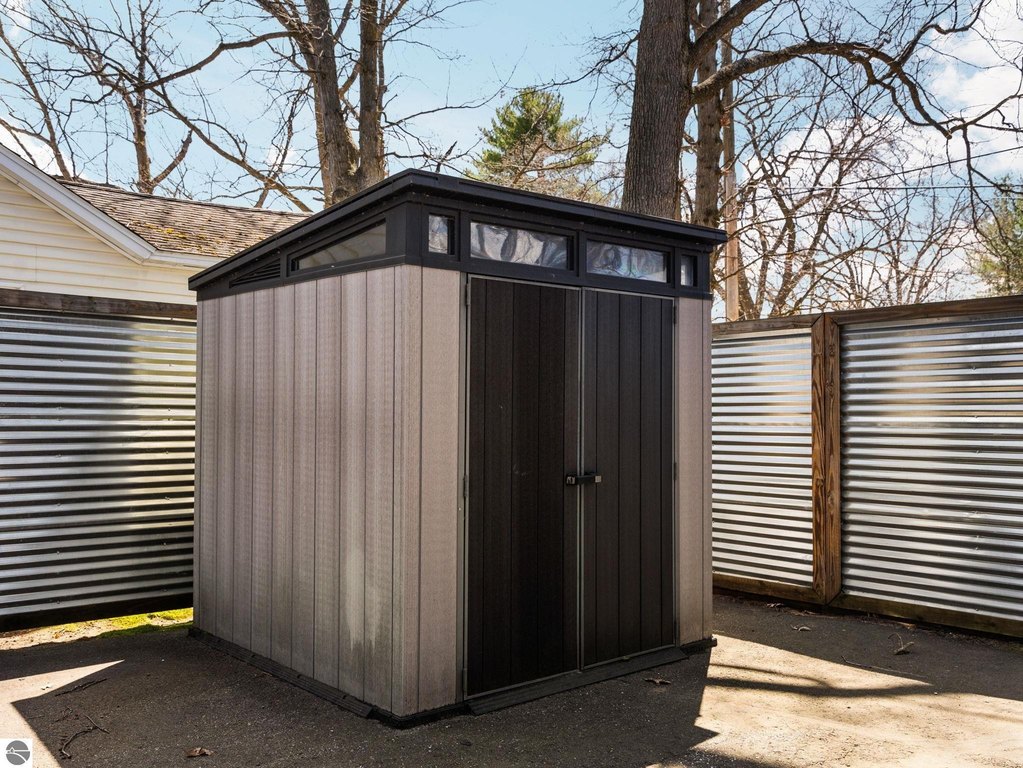
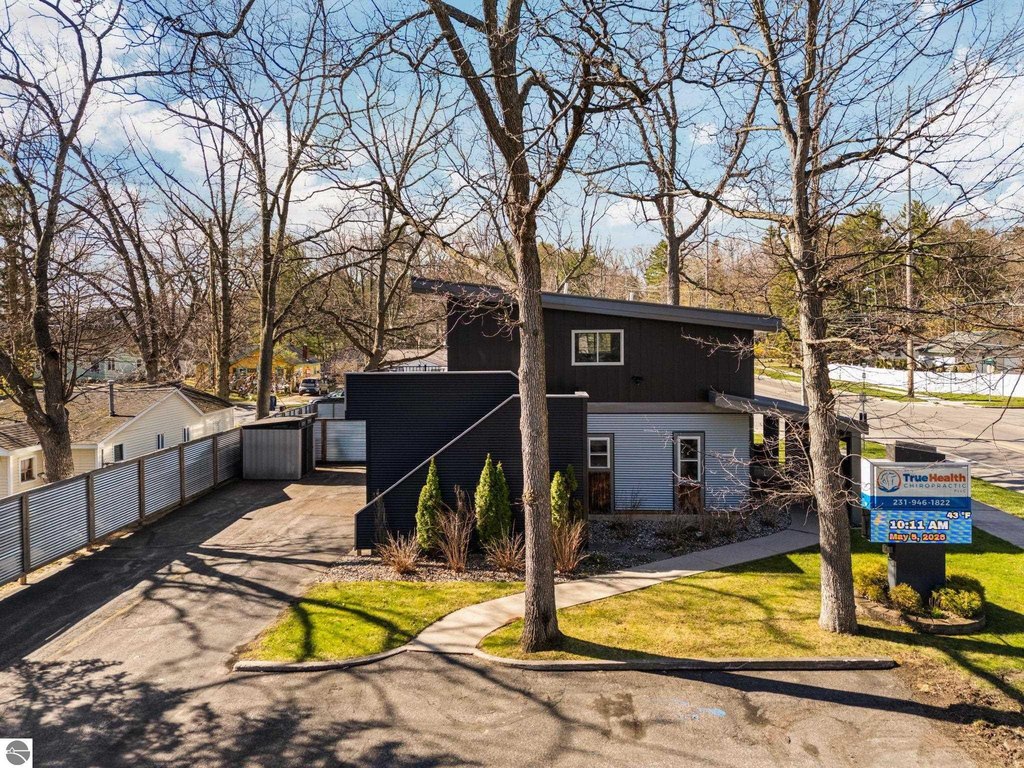
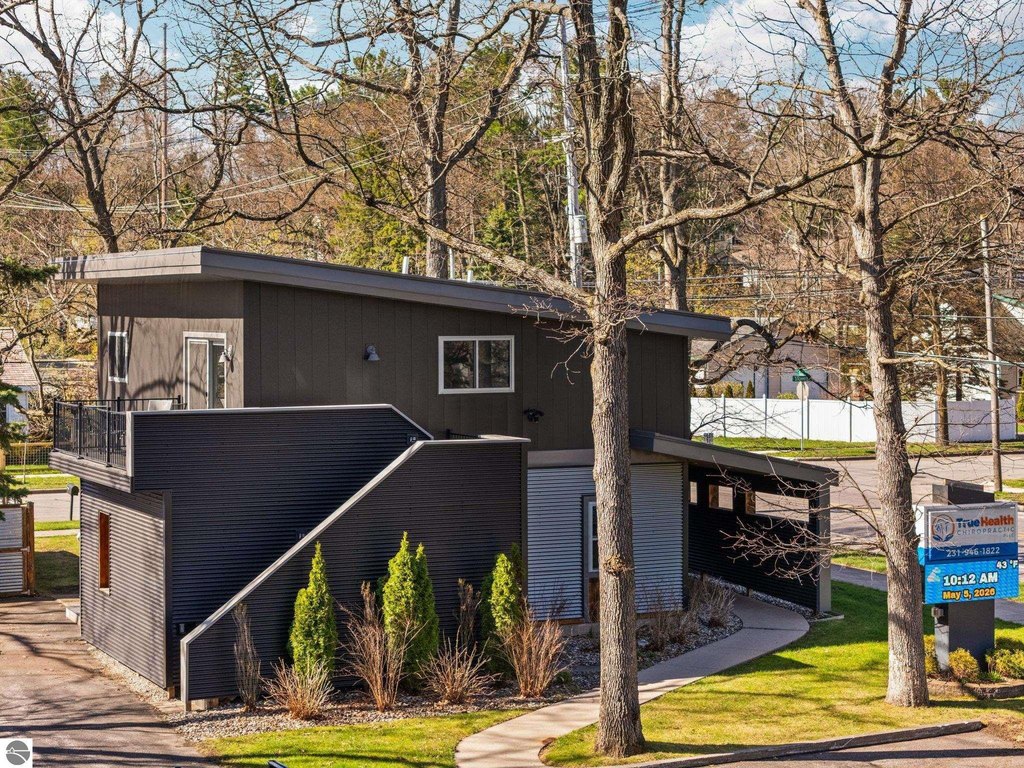
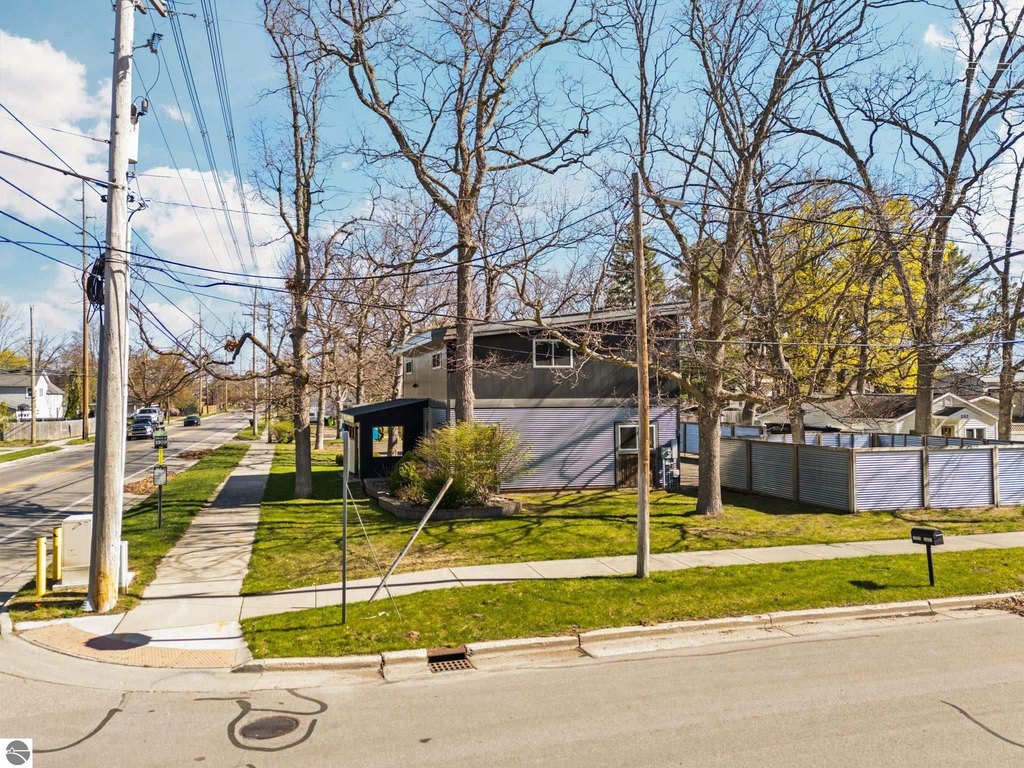
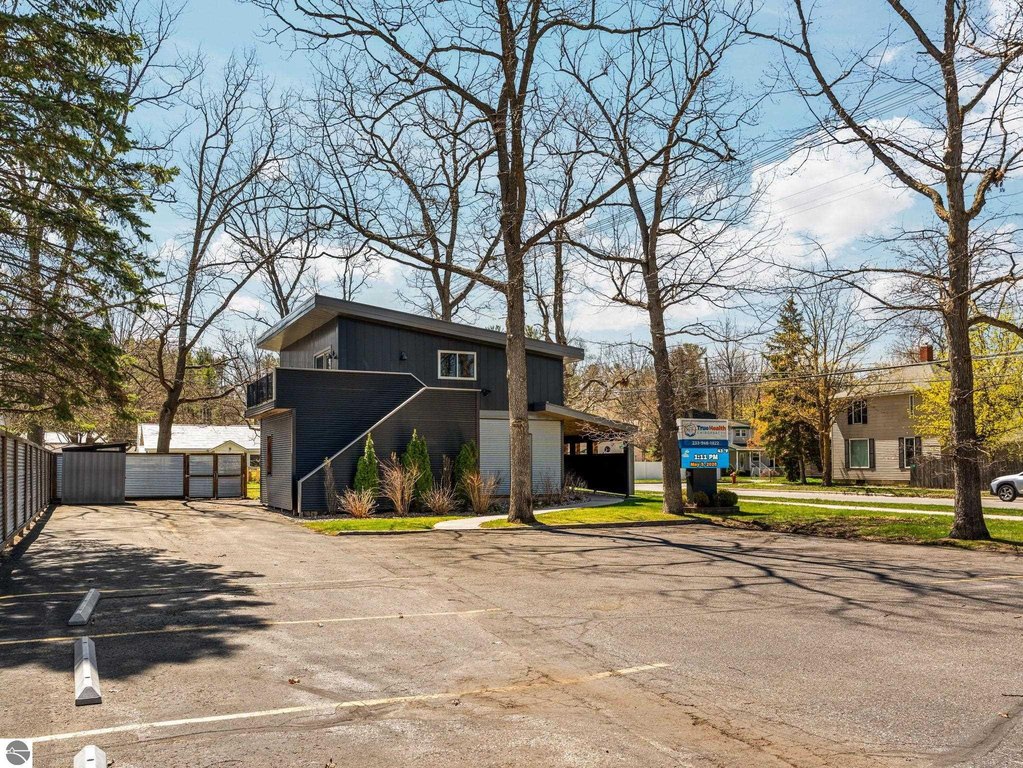
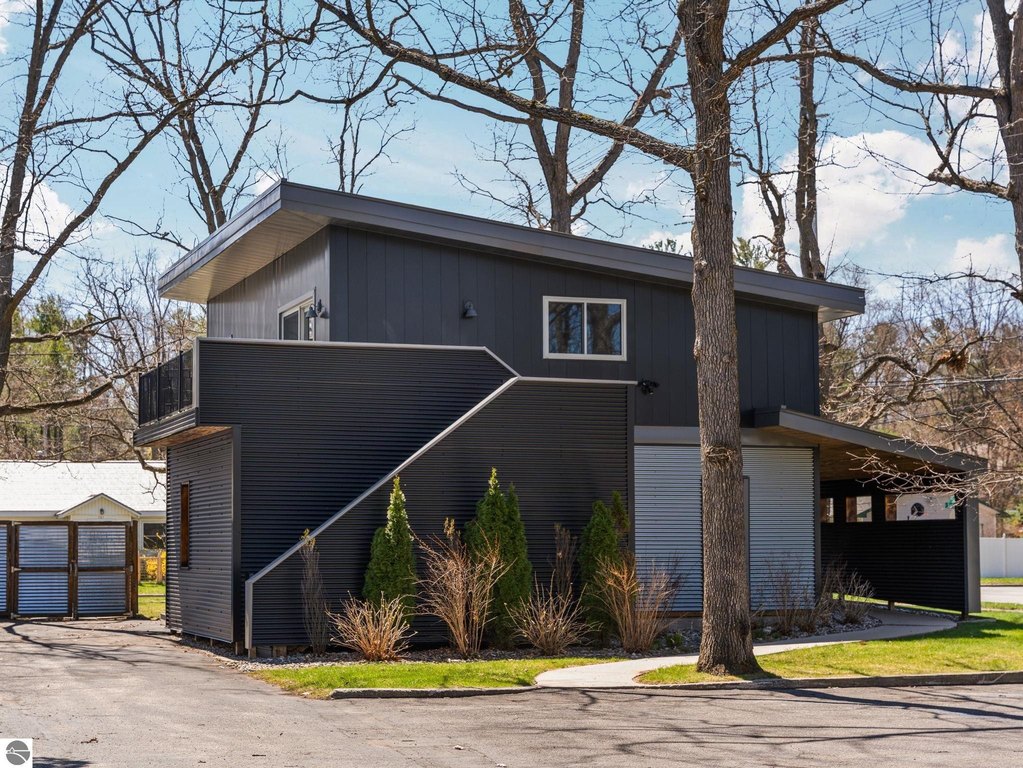
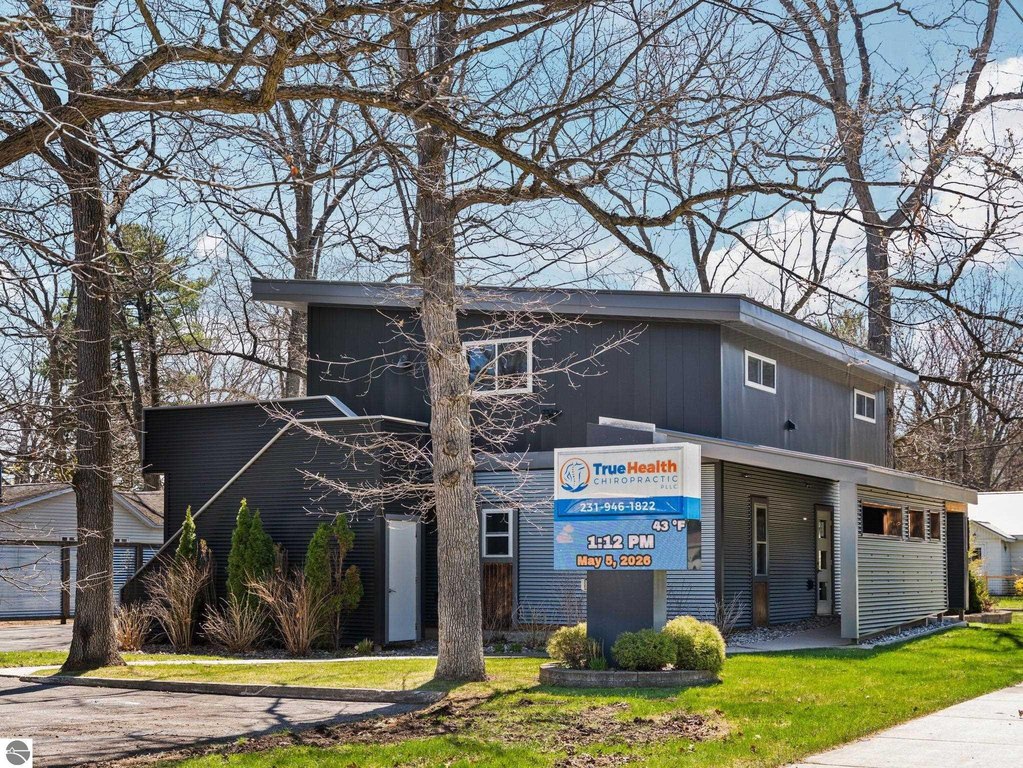
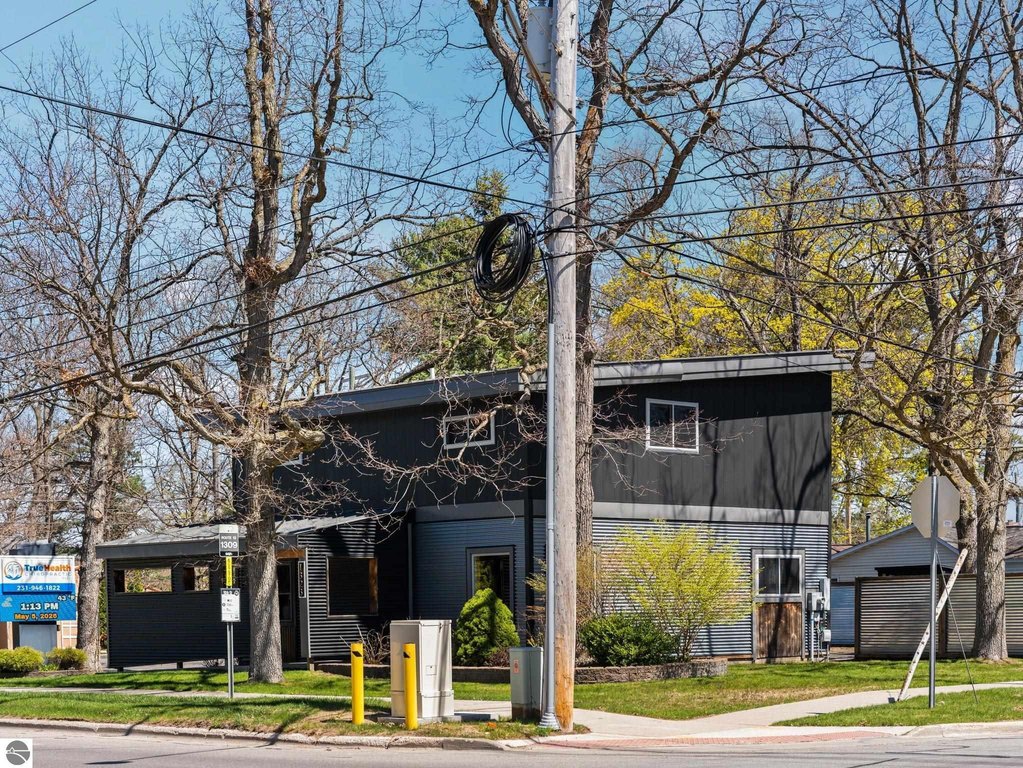
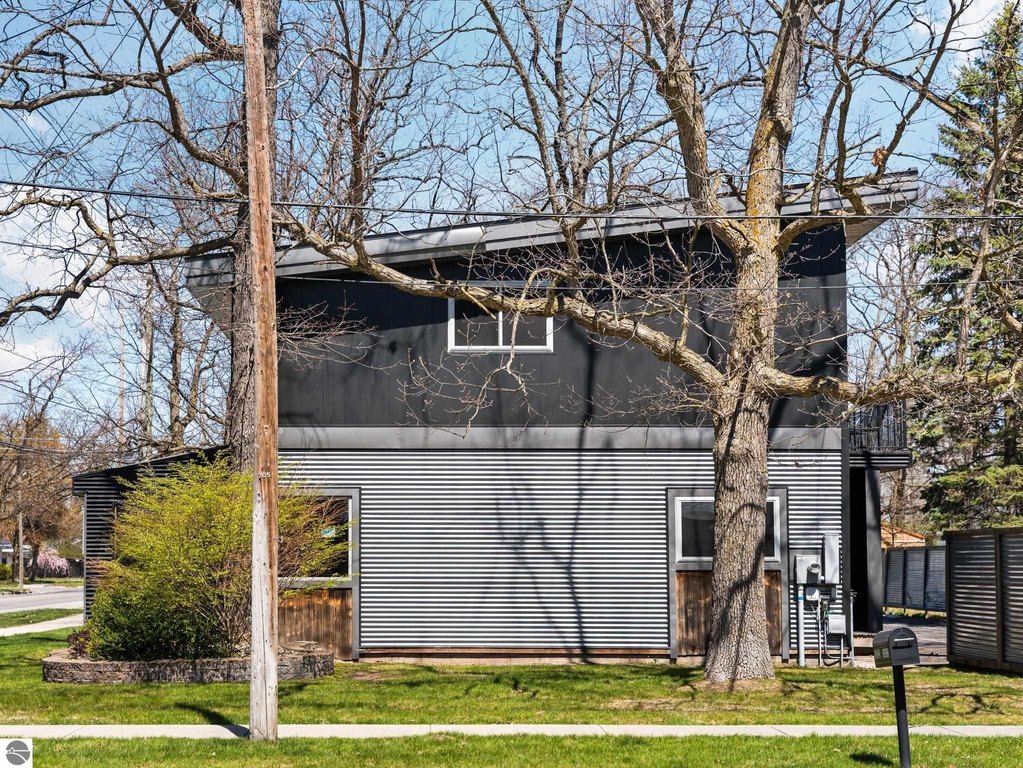
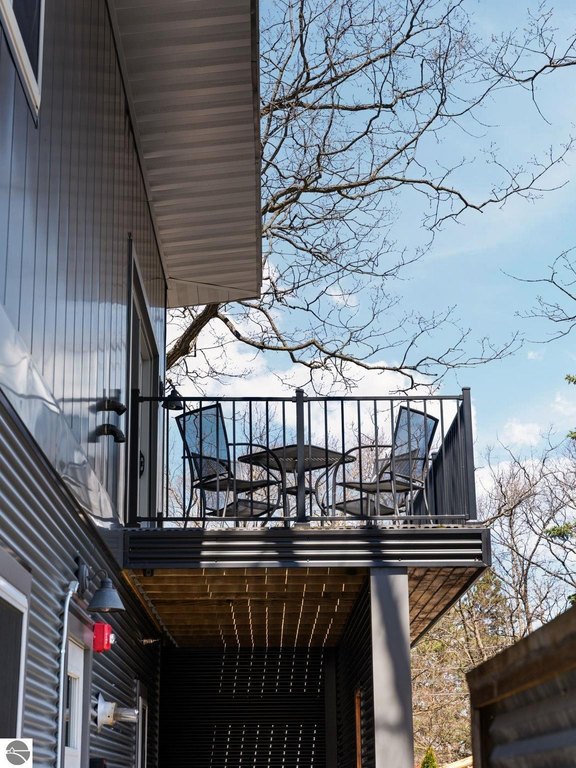
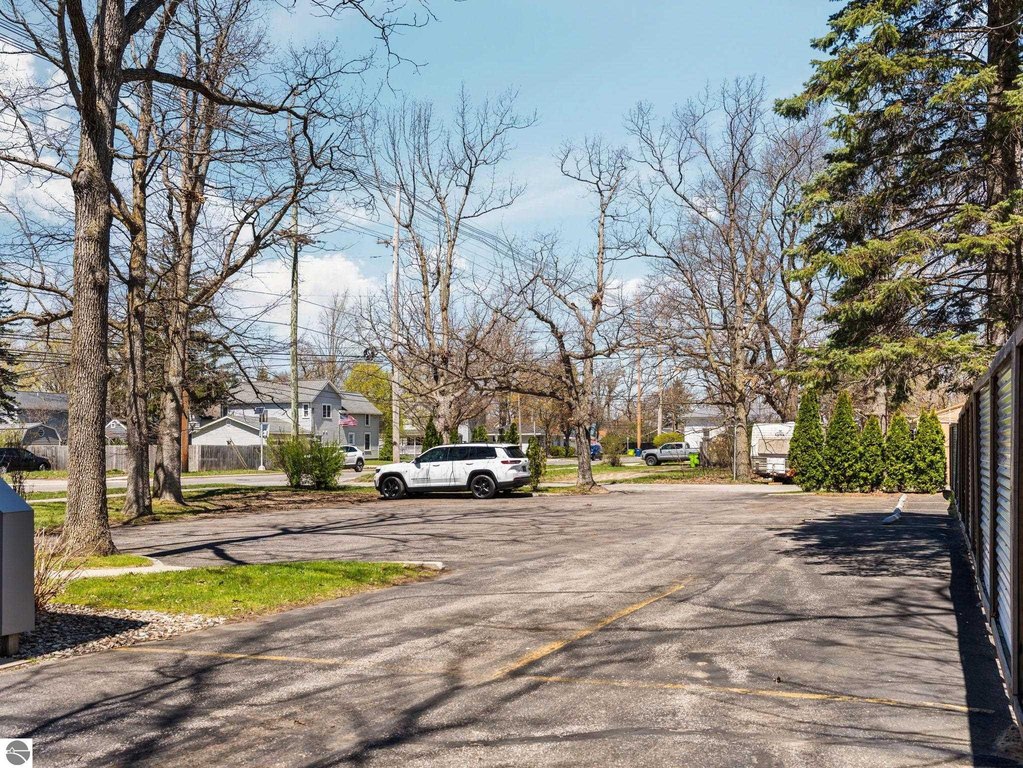
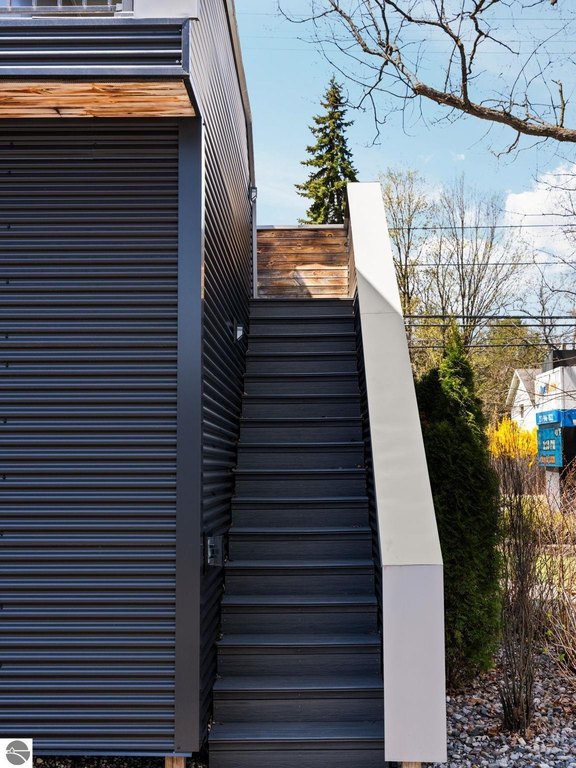
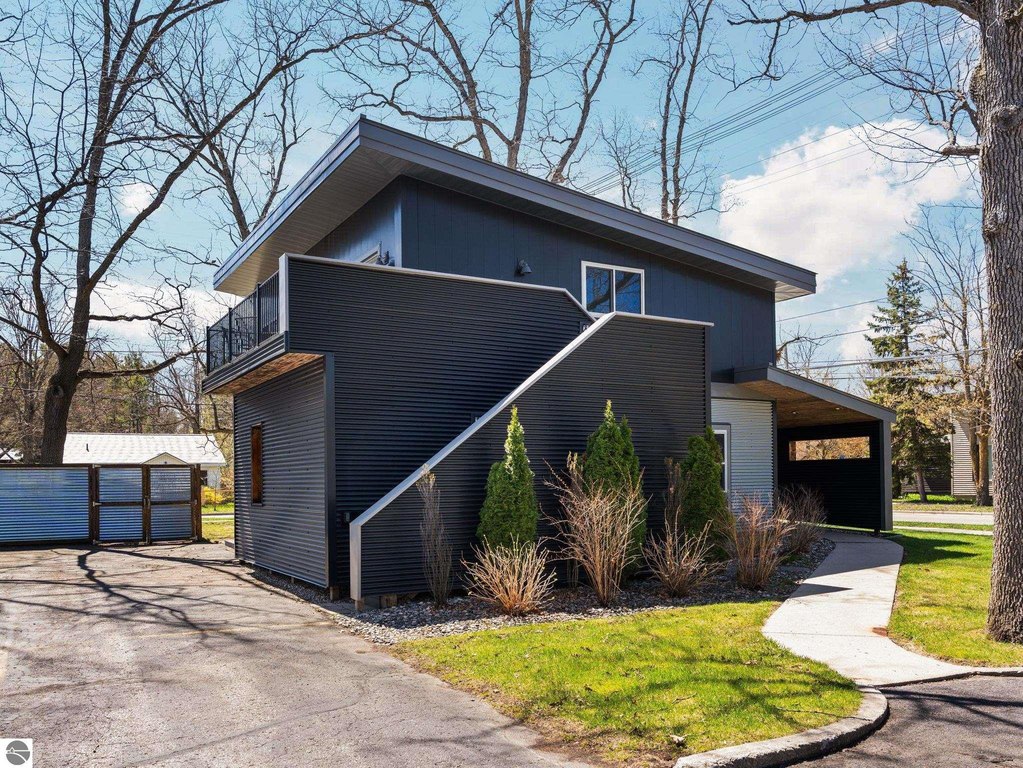
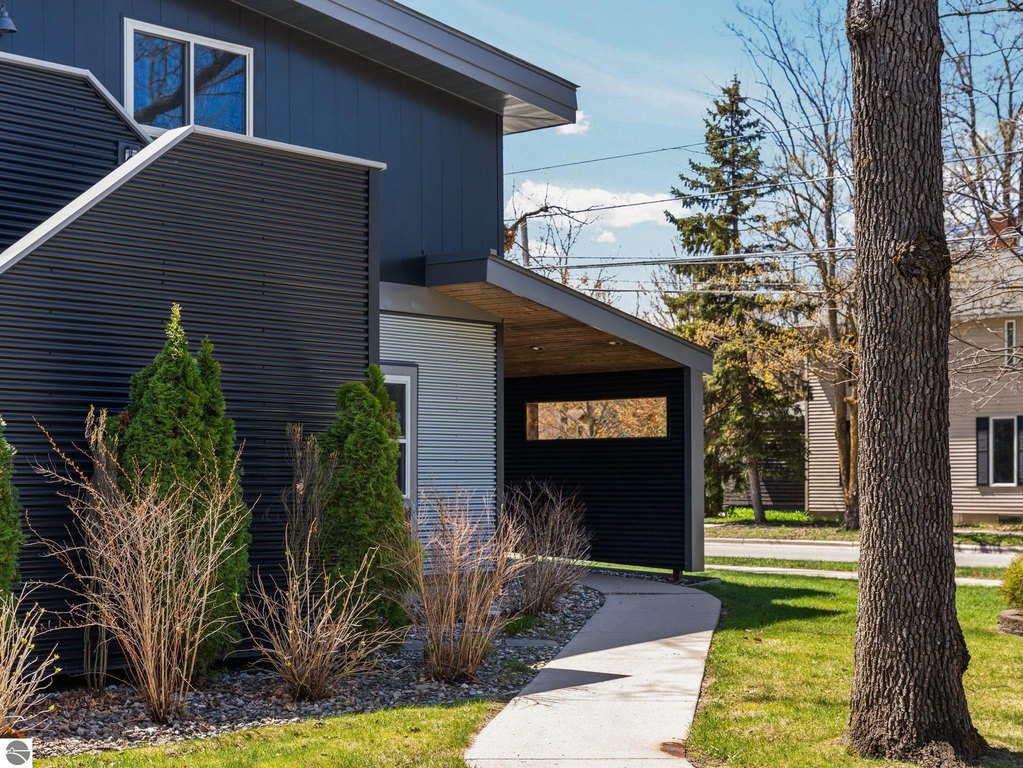
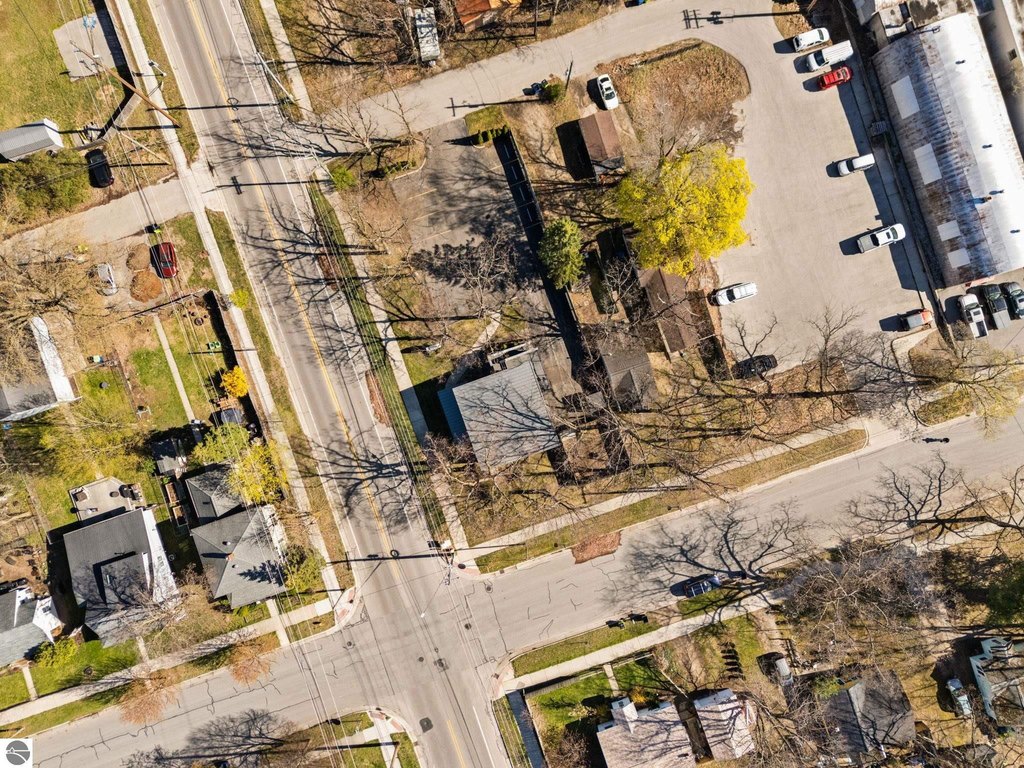
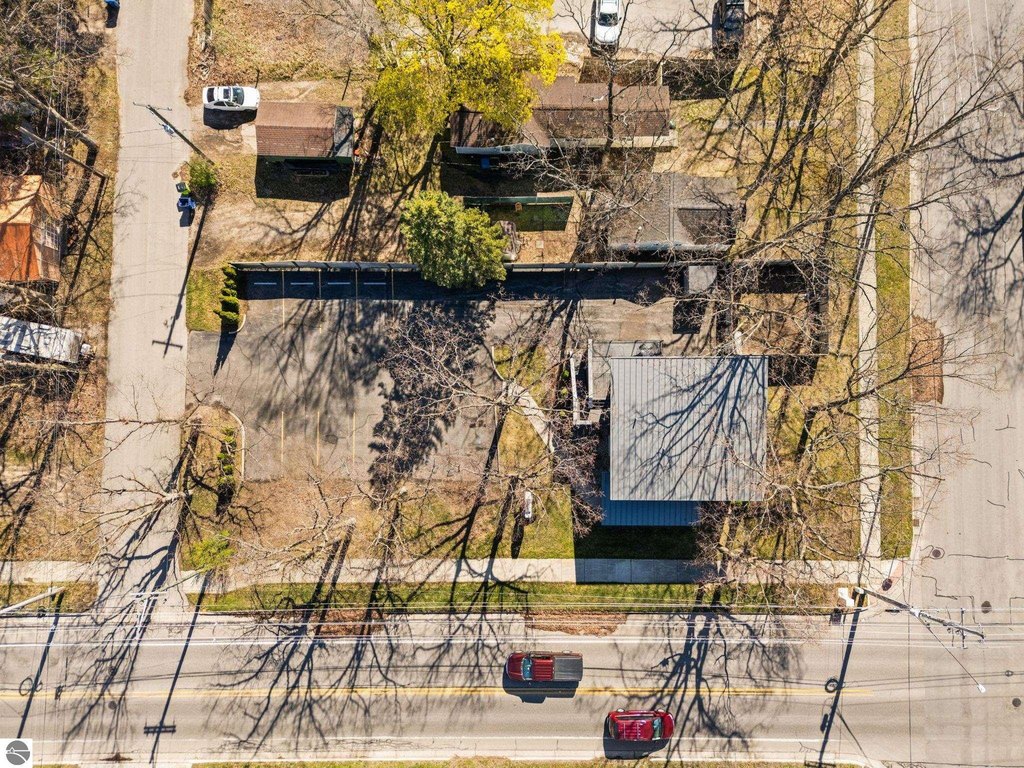
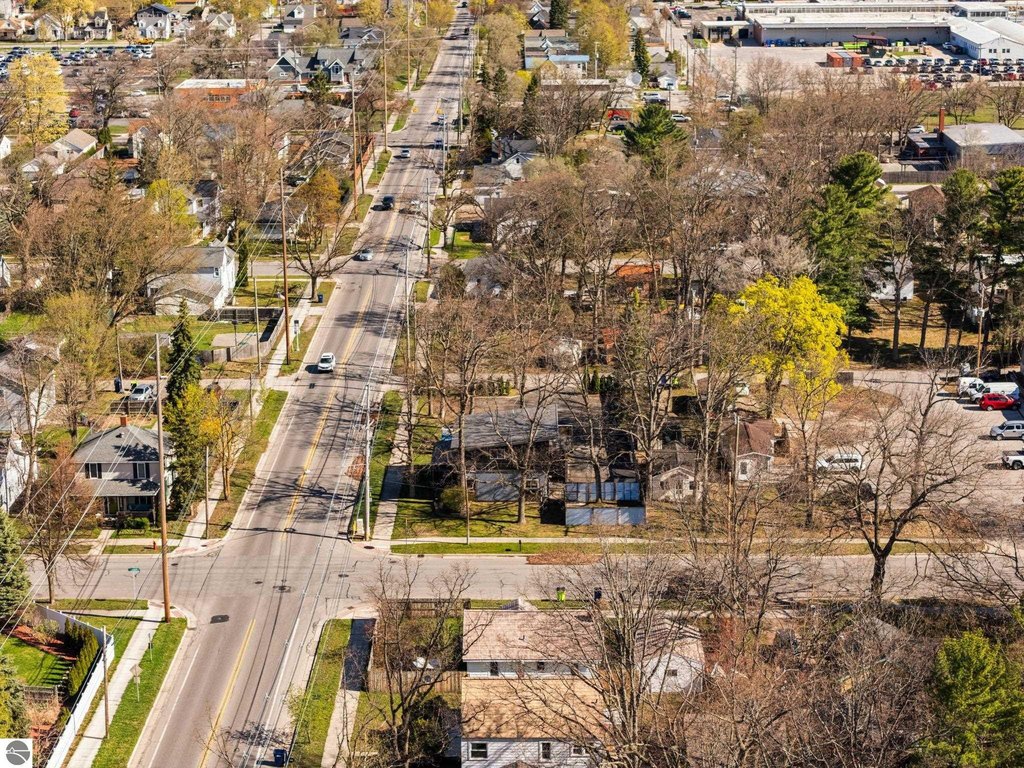
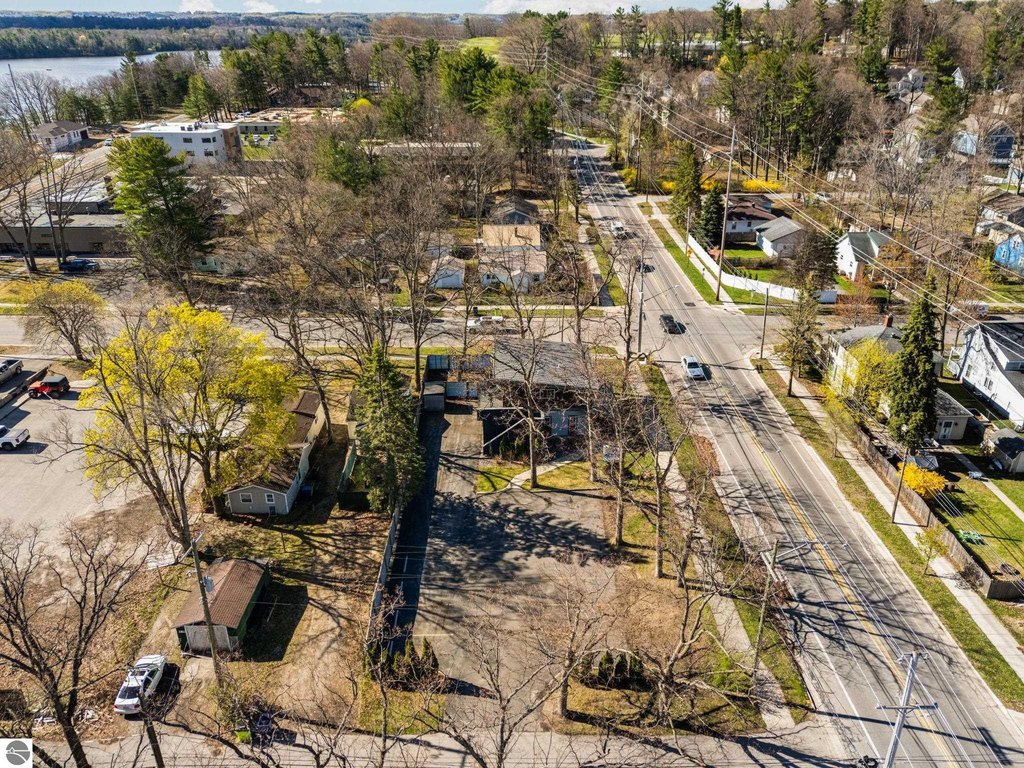
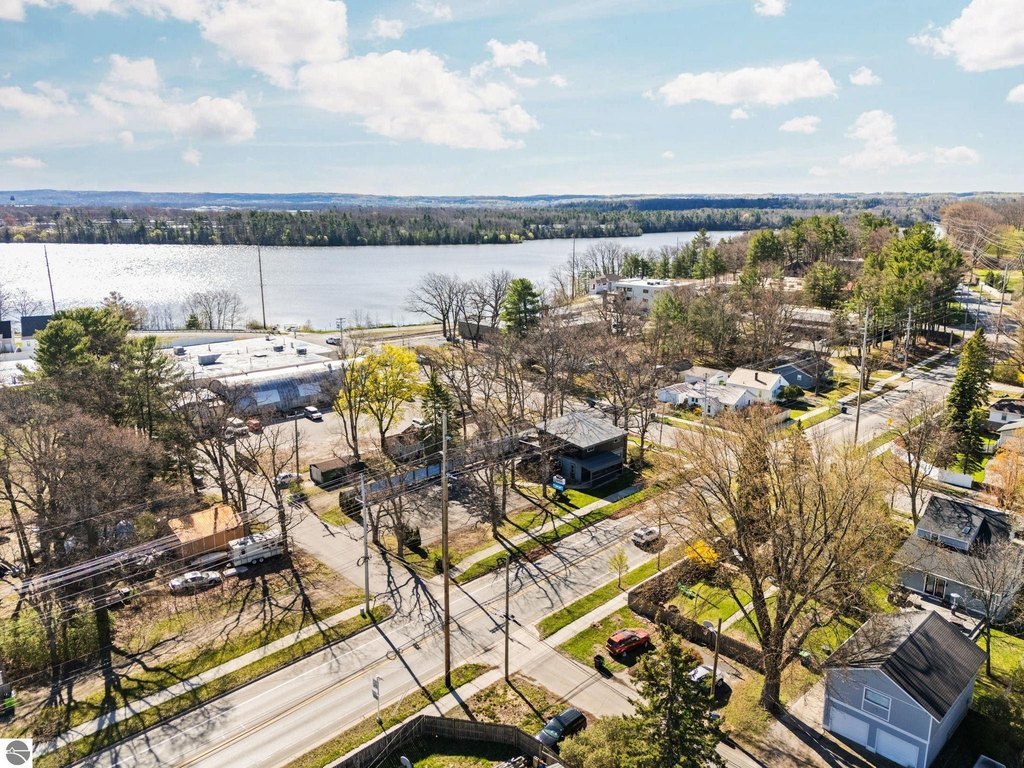
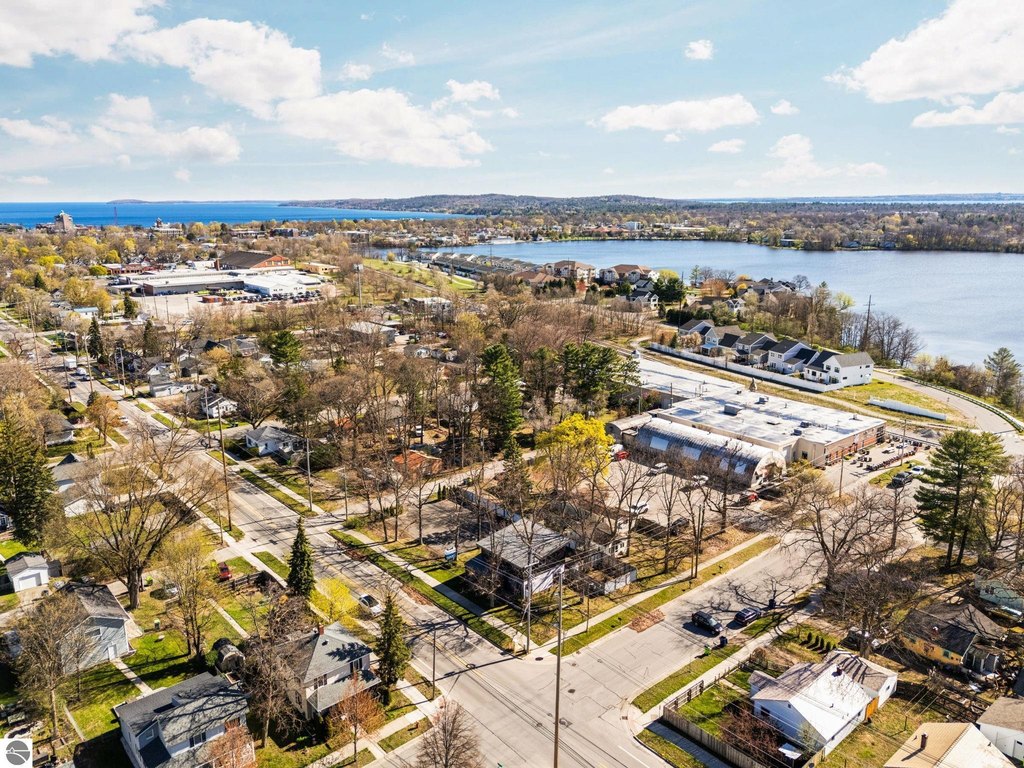
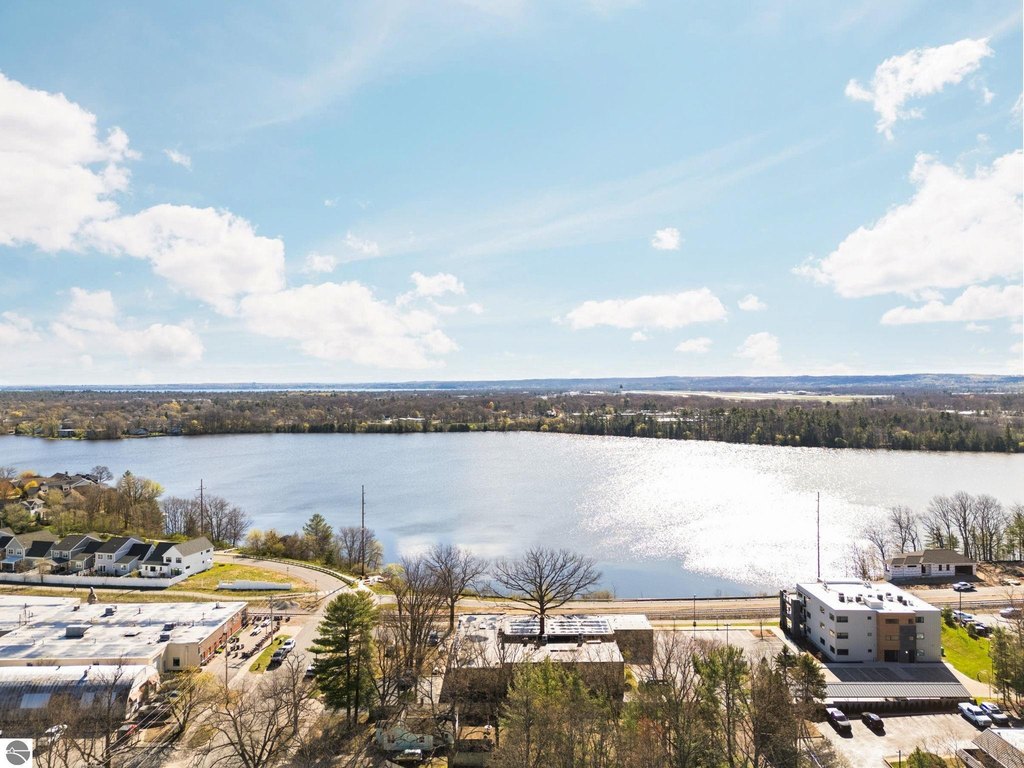
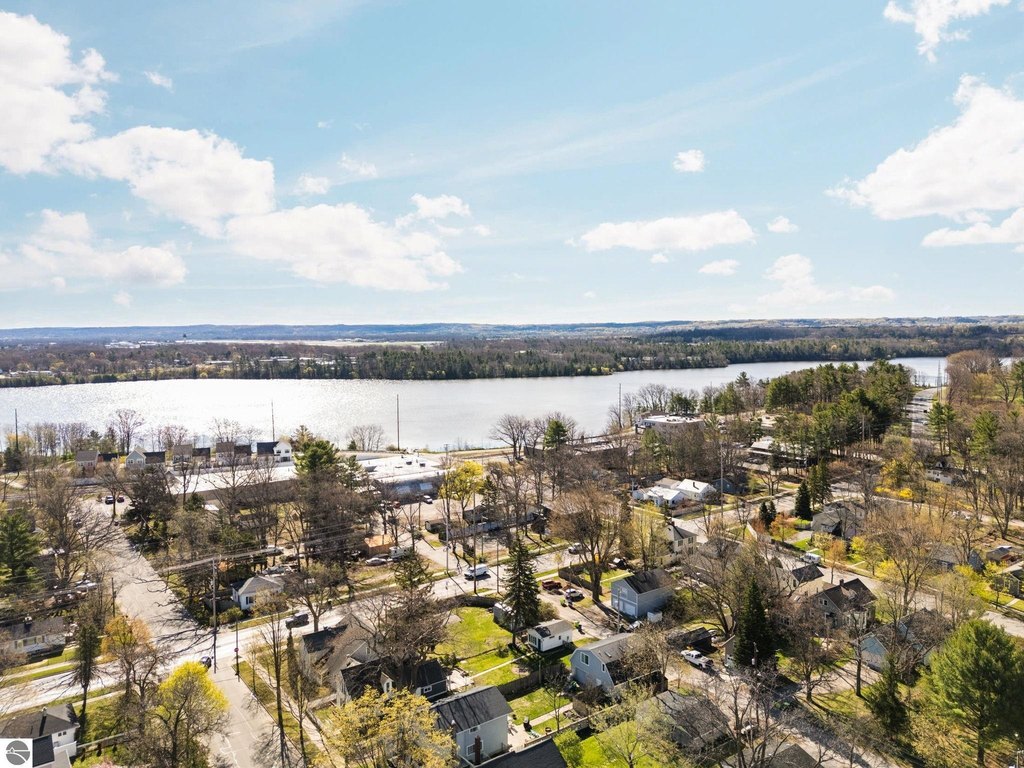
The building includes a metal roof and metal siding, natural gas, a sprinkler system with a fire alarm system, an outdoor irrigation system, and a digital outdoor sign. An outdoor deck offers Boardman Lake views, and there is a fenced outdoor area currently used as a fire pit space. The second lot is a 16-space parking lot and is described as buildable. A second dwelling is permitted, with potential for additional residential configurations; buyers are advised to verify permitted uses with the City of Traverse City prior to closing.
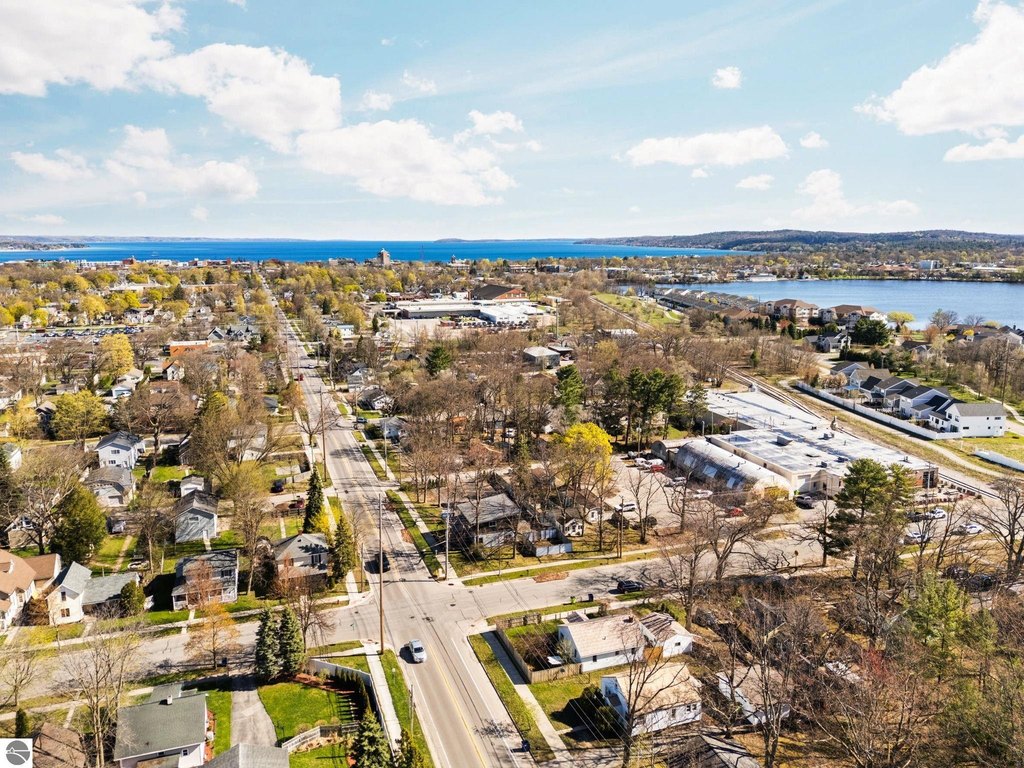
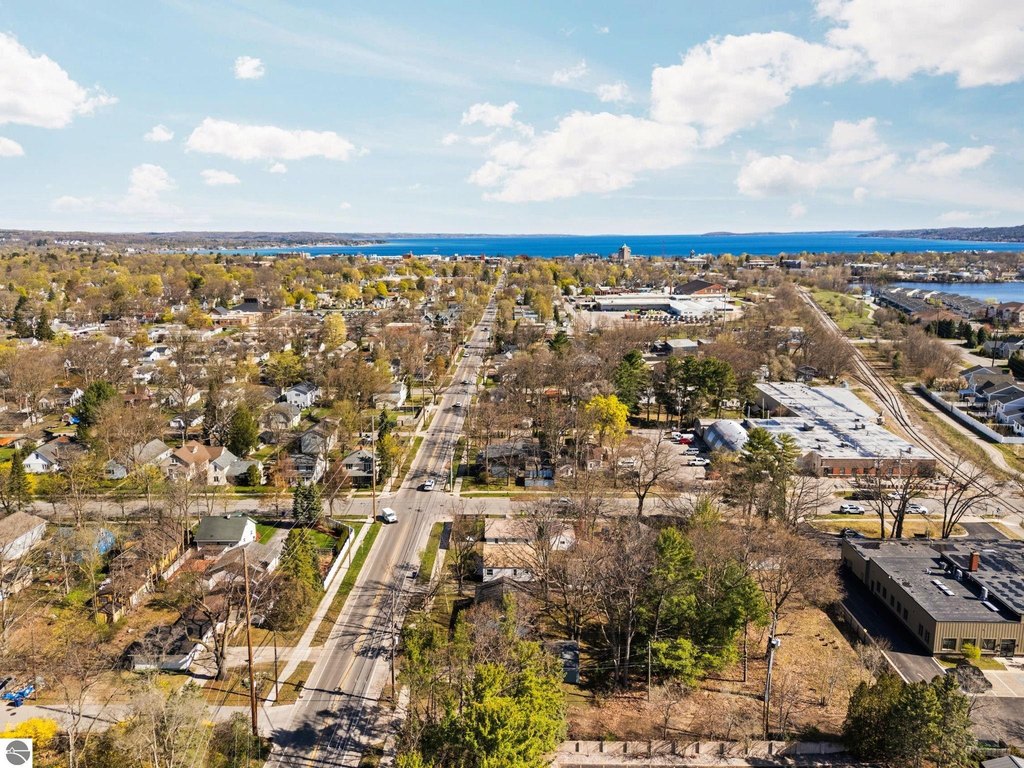
With professional office use operating on the main level, the configuration is supported by the property’s grandfathered commercial status, and the information notes that similar professional uses may be permitted. The property also sits within easy reach of the Boardman Lake Loop Trail and the TART Trail network.
The building includes a metal roof and metal siding, natural gas, a sprinkler system with a fire alarm system, an outdoor irrigation system, and a digital outdoor sign. An outdoor deck offers Boardman Lake views, and there is a fenced outdoor area currently used as a fire pit space. The second lot is a 16-space parking lot and is described as buildable. A second dwelling is permitted, with potential for additional residential configurations; buyers are advised to verify permitted uses with the City of Traverse City prior to closing.
With professional office use operating on the main level, the configuration is supported by the property’s grandfathered commercial status, and the information notes that similar professional uses may be permitted. The property also sits within easy reach of the Boardman Lake Loop Trail and the TART Trail network.
Key Highlights
- 1,792 sq ft live/work building on 165‑ft Cass Street frontage, with ADA‑compliant professional main level and a fully renovated studio apartment above.
- 2018 gut renovation down to framing with new electrical, plumbing, flooring, and addition of the second level.
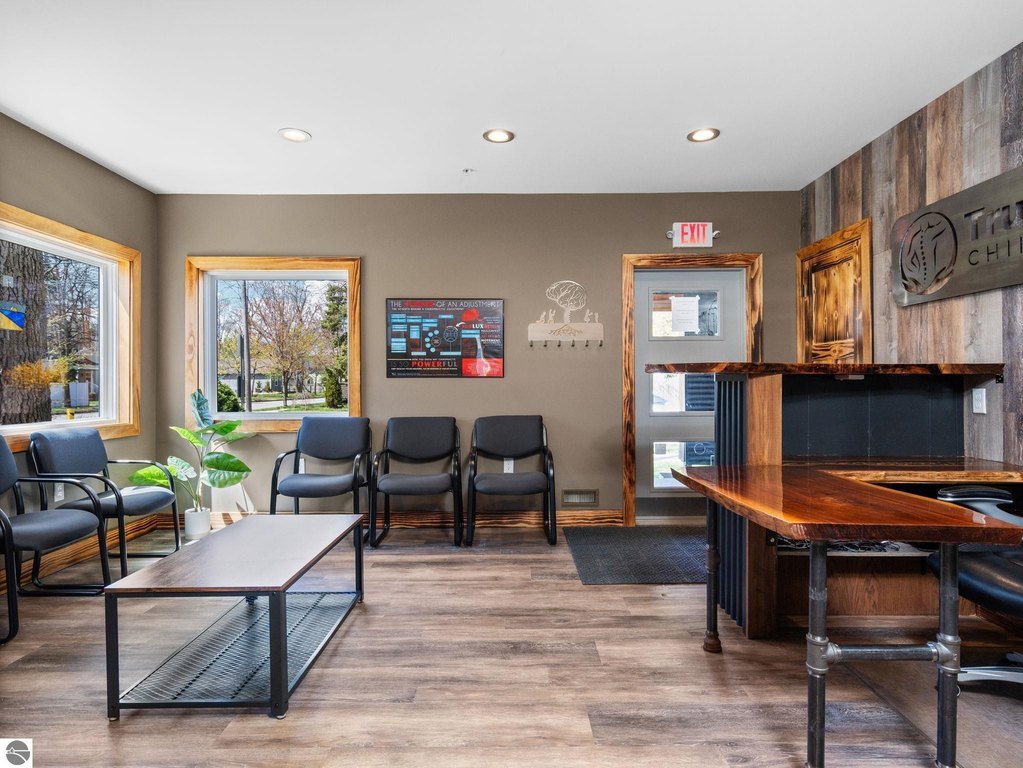
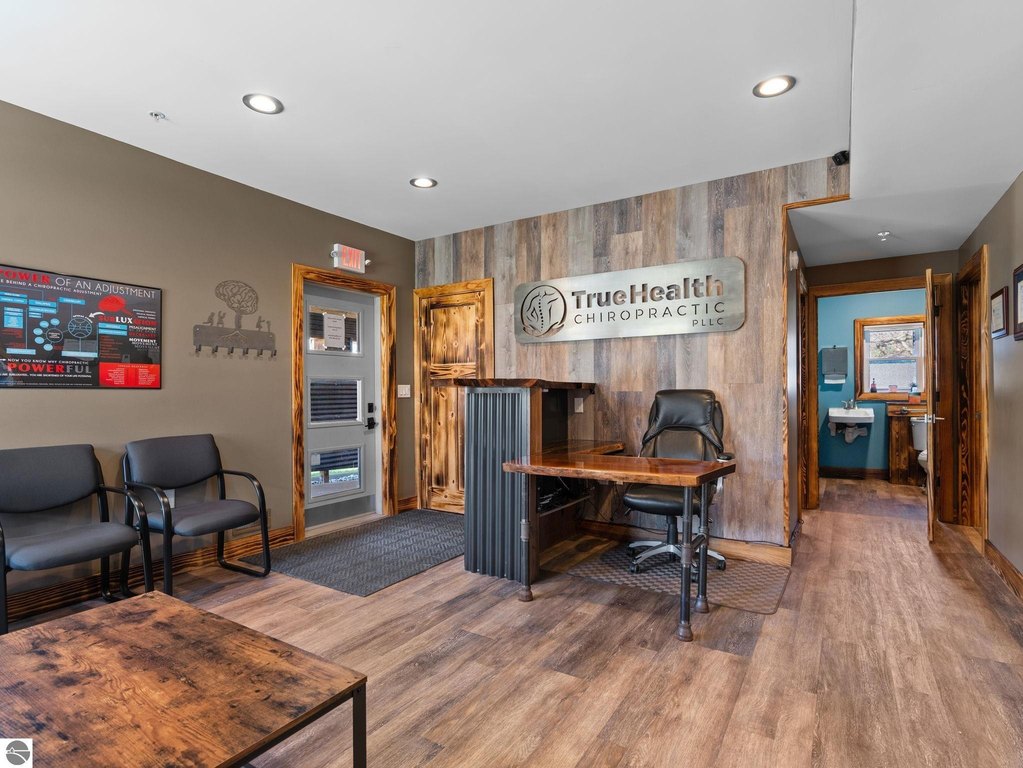
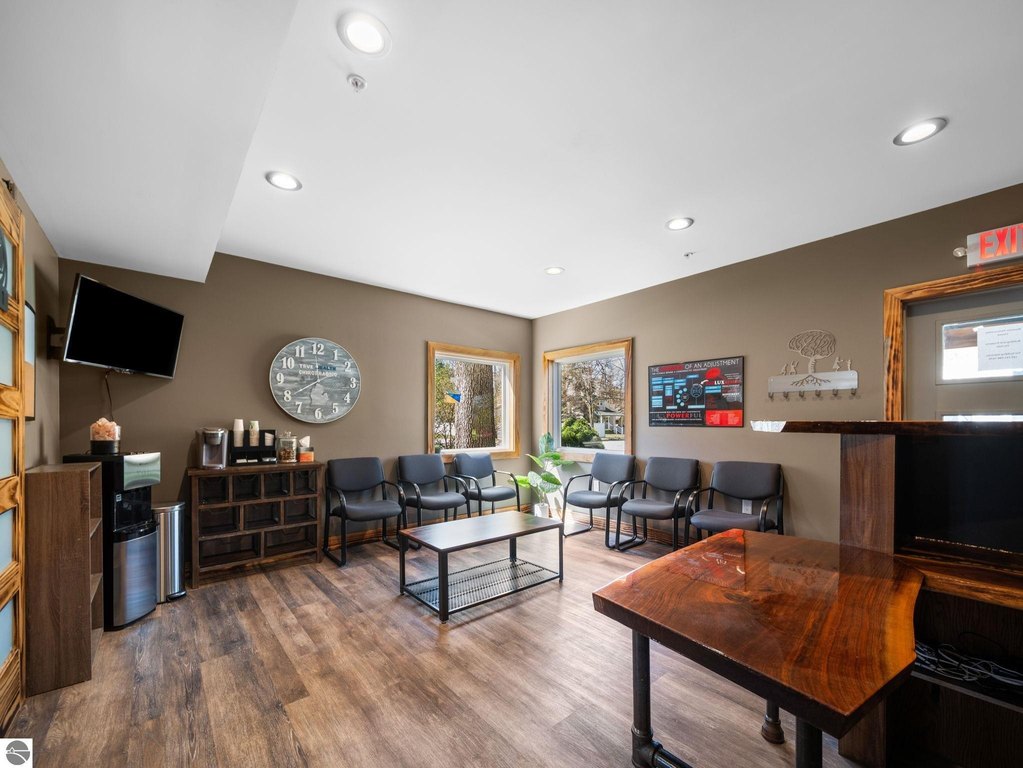
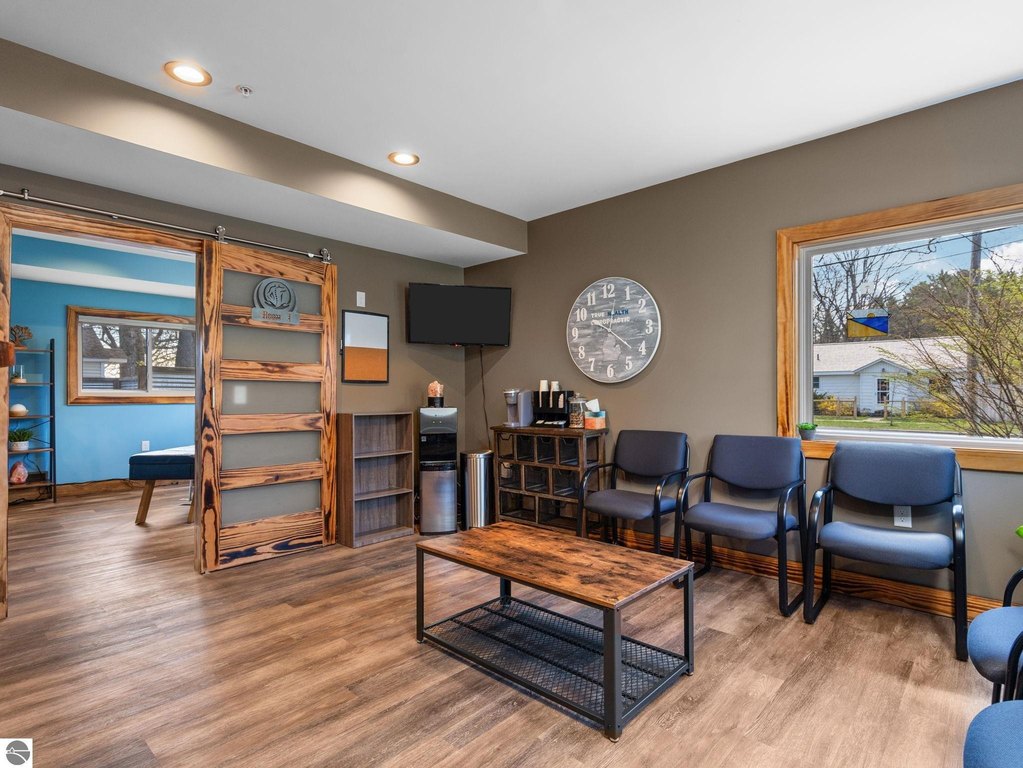
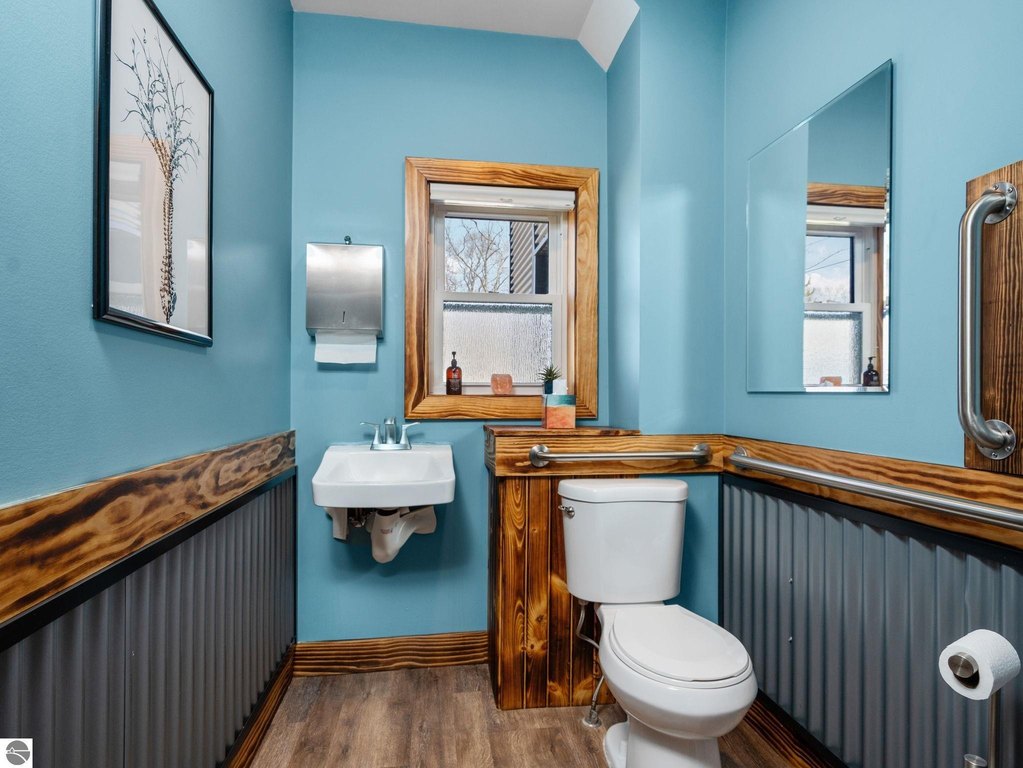
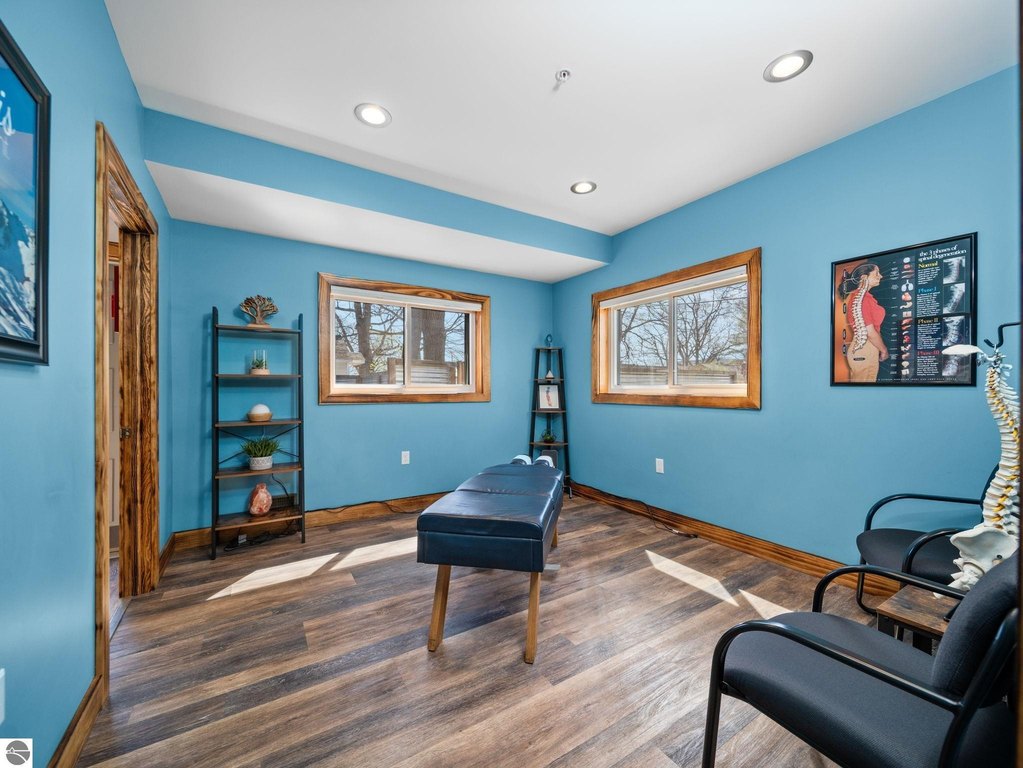
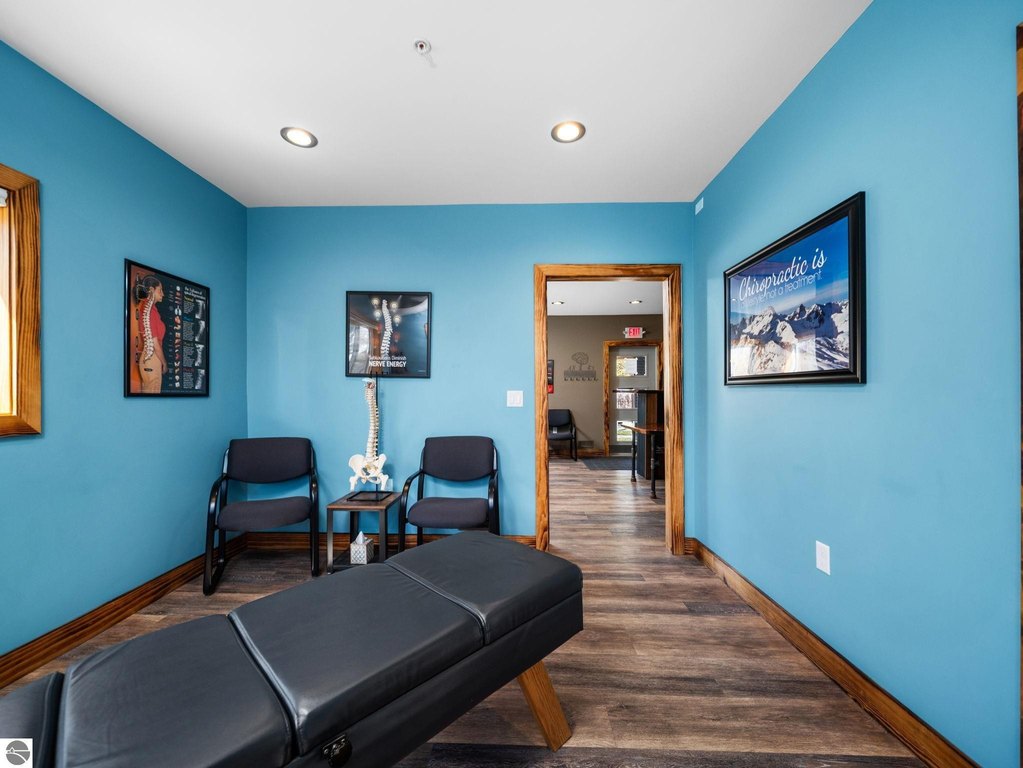
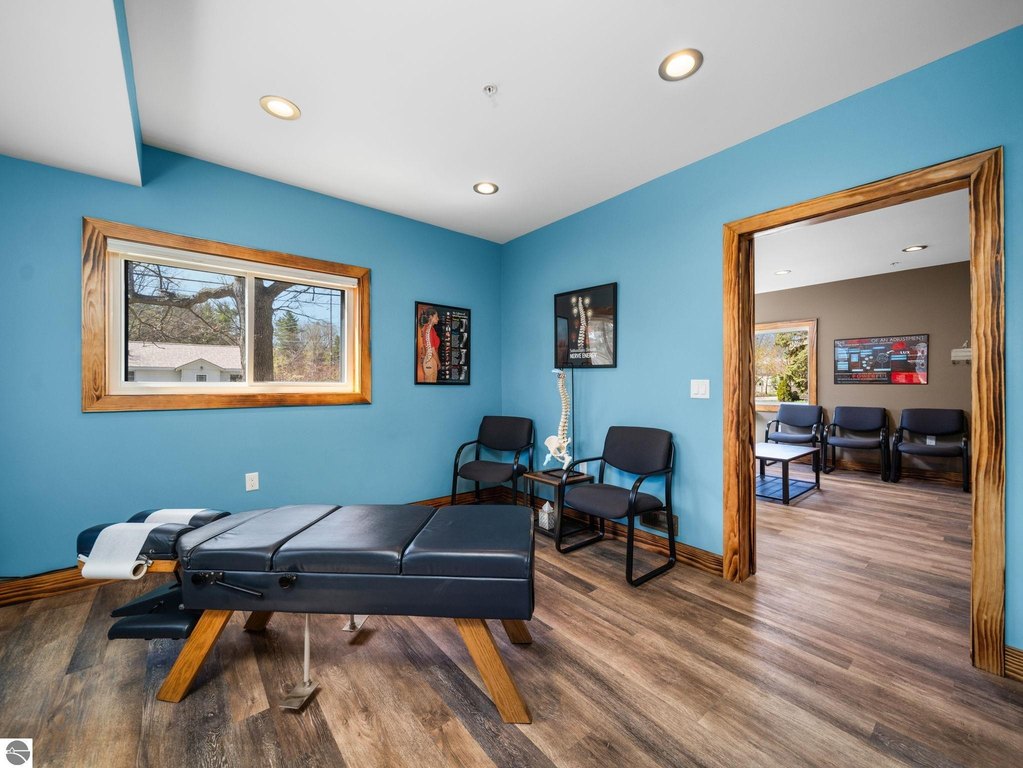
- Main level (896 sq ft) configured for professional use with 3 treatment/private rooms, half bath, and reception with built‑in wooden desk.
Financial Insights For Healthcare Medical
Simulate Cap Rate and NOI
NOI Build-Up
- Vacancy
- income lost from leasable area expected to sit empty during the year — subtracted from gross rent.
- EGI (Effective Gross Income)
- gross rent minus vacancy losses — the realistic income before paying operating costs.
- OpEx (Operating Expenses)
- recurring costs to operate the property (property tax, insurance, utilities, maintenance, management) — excludes financing and capital improvements.
- NOI (Net Operating Income)
- income a property generates after operating costs but before financing and taxes.
| Component | $ | $/SF |
|---|---|---|
| Gross rent | $46.7k | $26.04 |
| − Vacancy | −$4.0k | −$2.21 |
| EGI | $42.7k | $23.83 |
| − OpEx | −$17.1k | −$9.53 |
| NOI | $25.6k | $14.30 |
1,792 SF · lease $26.04/SF/yr · vacancy 8.50% · expense 40.00%
Alternative Uses
Best Use
Healthcare Medical
$366.0K
$320.2K – $427.0K
NOI $25,618 @ 7.0% cap · market cap 2.85%
Second Best
Office B
$274.2K
$239.9K – $319.9K
NOI $19,192 @ 7.0% cap · market cap 2.13%
Theoretical Best
Office A
$389.3K
$340.6K – $454.2K
NOI $27,250 @ 7.0% cap · market cap 3.03%
Zoning and permitted uses should be independently verified with local authorities.
Property Analytics
Property Profile
Location Intelligence
Current Use by Public Records
True Health Chiropractic, ...
Alternative Medicine Practice
True Health Massage
Alternative Medicine Practice
Biddinger, Schrot & Rolando, ...
Law Firm




FAQs
What type of property is this?
Live-work space - Turnkey office on the main level with an ADA-compliant layout and a furnished studio apartment above.
Where is this live-work space located?
The property is located at 1323 S Cass Street Traverse City, MI.
What is the asking price?
The asking price for this property is $899,000.
What are key features of this property?
This property features: 1,792 sq ft live/work building on 165‑ft Cass Street frontage, with ADA‑compliant professional main level and a fully renovated studio apartment above.; 2018 gut renovation down to framing with new electrical, plumbing, flooring, and addition of the second level.; Main level (896 sq ft) configured for professional use with 3 treatment/private rooms, half bath, and reception with built‑in wooden desk.


