Historic Mixed-Use
For Sale
Contact for pricing
131 Middle Street, Portland, ME 04101
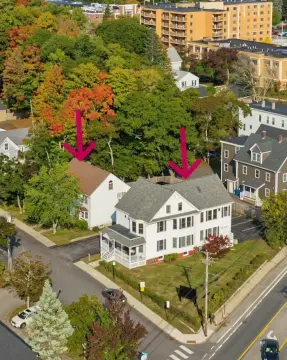
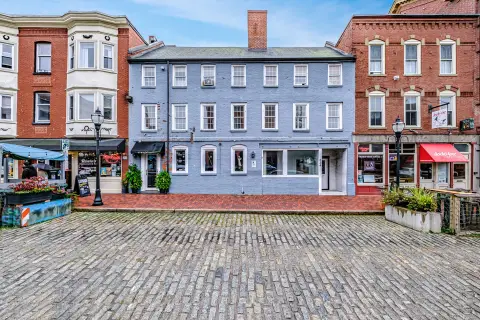
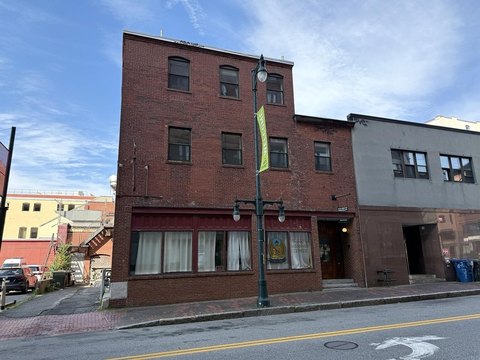
Brick commercial property with retail, office, accessible upper levels, parking, and distinctive historic architectural details.
Property Size27,120 SF
Price / SF$248.89
Days on Market148

Ask AI about this property
Review the available facts, identify missing information and prepare questions for the agent.
Property Features for 131 Middle Street
General Information
Standard status
Active
Size
27,120 SF
Elevators
Yes
Property subtype
Retail, Office
Zoning
B3
Occupancy
70%
Lease Type
NNN
Investment Type
Value Add
Amenities
ornate facade
floor to ceiling windows
wood floors and ceilings
generously sized basement
all levels ADA accessible
expansive full size attic
Building Details
Year Built
1867
Year Renovated
2003
Buildings
1
Units
5
Tenancy
Multi
Construction
brick Italianate
Listing Agency:
Malone Commercial Brokers
Listed By:
Peter Harrington · License #ME BA900499
(207) 772-2422
Source:
Crexi
Added: May 21
Changed: Oct 7
Last Checked: Oct 14 at 10:49PM
Displayed information is deemed reliable but is not guaranteed and should be independently verified. All listing content including descriptions, pricing, images are the copyrighted material of Malone Commercial Brokers
Investment Insights
Based on property information with market context.
Built in 1867, this 27,120-square-foot mixed-use commercial building combines historic character with a multi-level configuration. The brick Italianate design includes an ornamental exterior, floor-to-ceiling windows, and wood floors and ceilings. A full-size attic and a sizable basement with elevator access add functional space, while ADA accessibility extends across all levels.
The property includes first-floor retail occupancy and office space on the upper floors, with rear parking serving the building. Located on Middle Street in Portland’s Old Port and zoned B3, the property supports a combination of storefront and office uses within a prominent historic structure.
The property includes first-floor retail occupancy and office space on the upper floors, with rear parking serving the building. Located on Middle Street in Portland’s Old Port and zoned B3, the property supports a combination of storefront and office uses within a prominent historic structure.
Key Highlights
- 27,120‑square‑foot mixed‑use building constructed in 1867
- Brick Italianate architecture with ornamental facade and floor‑to‑ceiling windows
- First‑floor retail space with upper‑level offices
Financial Insights
Estimated NOI and Cap Rate
NOI / Yr
$388,253
Cap Rate
5.75%
Suggested Prices Based on Cap Rates
Cap Rate 5%
$7,765,060
$7.8M
Cap Rate 7%
$5,546,471
$5.5M
Cap Rate 9%
$4,313,922
$4.3M
Market Conditions
NOI Build-Up for 27,120 SF
Gross rent
$592.3K $21.84/SF
− Vacancy
−$74.6K −$2.75/SF
EGI
$517.7K $19.09/SF
− OpEx
−$129.4K −$4.77/SF
NOI
$388.3K $14.32/SF
Area
Cumberland County, ME
Vacancy
12.60%
Lease Rate
$21.84 /SF/Yr
Expense Ratio
25.00%
Simulate Cap Rate and NOI
Suggested Prices Based on Cap Rates
Cap Rate 5%
$7,765,060
Cap Rate 7%
$5,546,471
Cap Rate 9%
$4,313,922
Alternative Uses
Best Use
Office B
$5.55M
$4.85M – $6.47M
NOI $388,253 @ 7.0% cap · market cap 5.75%
Second Best
Mixed Use
$4.81M
$4.21M – $5.61M
NOI $336,830 @ 7.0% cap · market cap 4.99%
Theoretical Best
Office A
$7.45M
$6.52M – $8.70M
NOI $521,777 @ 7.0% cap · market cap 7.73%
Zoning and permitted uses should be independently verified with authorities.
How Realmo checks its estimates
Property Analytics
Unlock full access to Insights
Subscribe to Realmo Intelligence
Open Analytics
Current Use
Location Intelligence
Trade Area within ½ mile
5,539
Businesses Nearby
Explore this area
Business Placement
Demographics for 04101, ME
18,109
Population
11,510
Households
1.6
Avg Household Size
36
Median Age
57%
College-Educated
93%
High-School Grad
2.0 sq mi
ZIP Area
9,055
Density / Sq Mi
$60,726
Median Household Income
$45,009
Median Earnings
$1,457
Median Rent
$600,600
Median Home Value
Check the figures for this property
Cap Rate, Value Estimation, Potential NOI and more
View Realmo Analytics
Market
Vacancy Rate% for Office in Northeast region





Frequently Asked Questions
What type of property is this?
Mixed-use property - Brick commercial property with retail, office, accessible upper levels, parking, and distinctive historic architectural details.
Where is this mixed-use property located?
The property is located at 131 Middle Street Portland, ME.
What is the asking price?
The asking price for this property is $6,750,000.
What are key features of this property?
This property features: 27,120‑square‑foot mixed‑use building constructed in 1867; Brick Italianate architecture with ornamental facade and floor‑to‑ceiling windows; First‑floor retail space with upper‑level offices


