Renovated Side-by-Side
For Sale
$124,900
131 E Southern Ave, Springfield, OH 45505
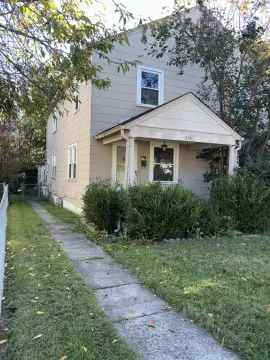
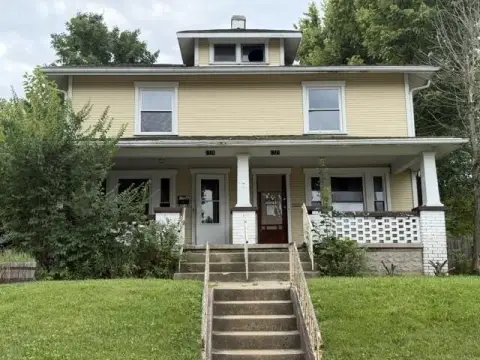
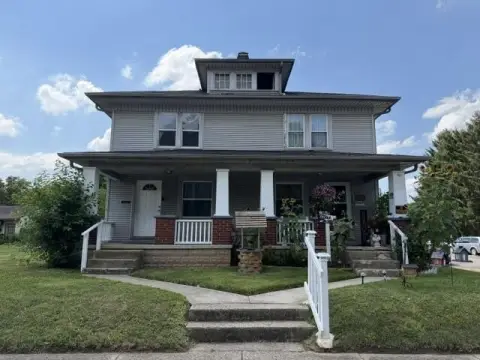
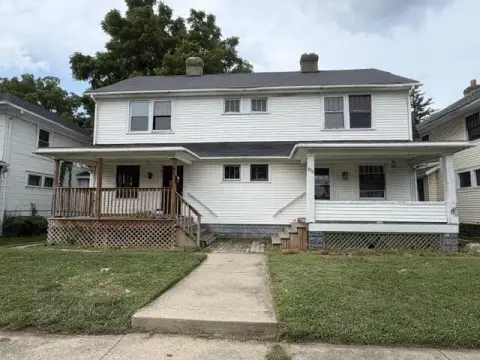
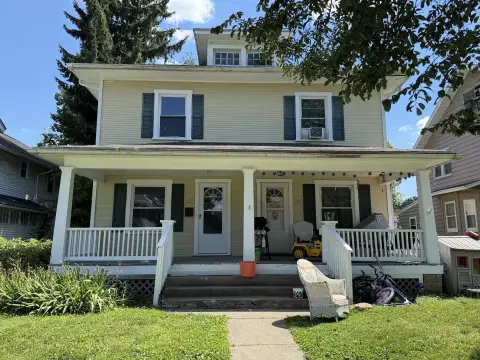
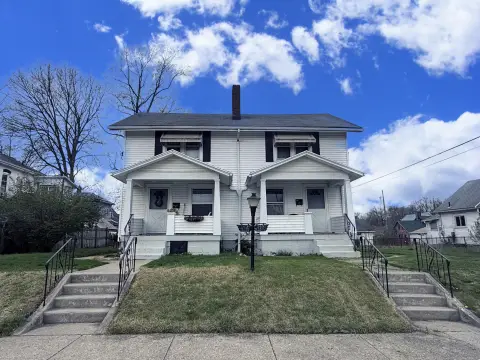
Two units offer separate utilities, covered front porches, and distinct bedroom and bathroom configurations.
Property Size3,242 SF
Price / SF$38.53
Days on Market52
Property Features for 131 E Southern Ave
General Information
Standard status
Active
Size
3,242 SF
Property subtype
Multi-Family
Units
Unit Mix
1 x 4BR/2BA, 1 x 3BR/1BA
Multifamily Units
2
Additional Details
Highway Access
Yes
Amenities
covered front porches
Building Details
Year Built
1890
Listing Agency:
Coldwell Banker Heritage
Listed By:
Arthur A Solomon · License #2014003166
(937) 631-5562
Source:
Thelorilynngroup
Added: Aug 25
Changed: Oct 3
Last Checked: Oct 7 at 5:45PM
Displayed information is deemed reliable but is not guaranteed and should be independently verified. All listing content including descriptions, pricing, images are the copyrighted material of Coldwell Banker Heritage
Investment Insights
Based on property information with market context.
This side-by-side duplex contains approximately 3,242 square feet with a combined seven bedrooms and three full bathrooms. The larger residence at 131 E Southern includes four bedrooms and two baths, while 133 E Southern provides three bedrooms and one bath. The smaller unit has been comprehensively updated, and the adjoining residence has received substantial improvements. Both sides feature tall ceilings, generous room sizes, backyard access, and covered front porches.
Major property upgrades include a brand-new roof, two high-efficiency furnaces, vinyl windows throughout, and fresh exterior paint with aluminum siding repairs. Each unit has its own 100-amp electrical service, with gas and electric separately metered. The owner pays water, while occupants pay their separately metered gas and electric. Built in 1890, the property is near South Limestone Street, downtown Springfield, and I-70.
Major property upgrades include a brand-new roof, two high-efficiency furnaces, vinyl windows throughout, and fresh exterior paint with aluminum siding repairs. Each unit has its own 100-amp electrical service, with gas and electric separately metered. The owner pays water, while occupants pay their separately metered gas and electric. Built in 1890, the property is near South Limestone Street, downtown Springfield, and I-70.
Key Highlights
- Approximately 3,242 square feet with 7 bedrooms and 3 full baths
- Side‑by‑side layout includes a 4‑bedroom, 2‑bath unit and a 3‑bedroom, 1‑bath unit
- 133 E Southern features a new kitchen, bathroom, flooring, doors, LED lighting, switches, and outlets
Financial Insights
Estimated NOI and Cap Rate
NOI / Yr
$11,003
Cap Rate
8.81%
Suggested Prices Based on Cap Rates
Cap Rate 5%
$220,060
$220.1K
Cap Rate 7%
$157,186
$157.2K
Cap Rate 9%
$122,256
$122.3K
Market Conditions
NOI Build-Up for 3,242 SF
Gross rent
$17.1K $5.28/SF
− Vacancy
−$1.4K −$0.43/SF
EGI
$15.7K $4.85/SF
− OpEx
−$4.7K −$1.45/SF
NOI
$11.0K $3.39/SF
Area
Clark County, OH
Vacancy
8.17%
Lease Rate
$5.28 /SF/Yr
Expense Ratio
30.00%
Simulate Cap Rate and NOI
Suggested Prices Based on Cap Rates
Cap Rate 5%
$220,060
Cap Rate 7%
$157,186
Cap Rate 9%
$122,256
Alternative Uses
Best Use
Multifamily LT 5
$157.2K
$137.5K – $183.4K
NOI $11,003 @ 7.0% cap · market cap 8.81%
Second Best
Apartment 5plus
$136.2K
$119.2K – $158.9K
NOI $9,534 @ 7.0% cap · market cap 7.63%
Theoretical Best
Specialty Retail
$904.3K
$791.3K – $1.06M
NOI $63,300 @ 7.0% cap · market cap 50.68%
Zoning and permitted uses should be independently verified with authorities.
How Realmo checks its estimates
Property Analytics
Unlock full access to Insights
Subscribe to Realmo Intelligence
Open Analytics
Current Use
Lease Details
2
Residential units
Yes
Highway access
Location Intelligence
Trade Area within ½ mile
321
Businesses Nearby
Explore this area
Business Placement
Demographics for 45505, OH
19,708
Population
9,365
Households
2.1
Avg Household Size
38
Median Age
10%
College-Educated
84%
High-School Grad
13.6 sq mi
ZIP Area
1,449
Density / Sq Mi
$42,409
Median Household Income
$30,322
Median Earnings
$802
Median Rent
$87,500
Median Home Value
Check the figures for this property
Cap Rate, Value Estimation, Potential NOI and more
View Realmo Analytics
Market
Vacancy Rate% for Multifamily in Midwest region

Questions? Ask Rey
Realmo’s AI knows this listing — price, zoning, demand, history. Ask anything.




Frequently Asked Questions
What type of property is this?
Duplex - Two units offer separate utilities, covered front porches, and distinct bedroom and bathroom configurations.
Where is this duplex located?
The property is located at 131 E Southern Ave Springfield, OH.
What is the asking price?
The asking price for this property is $124,900.
What are key features of this property?
This property features: Approximately 3,242 square feet with 7 bedrooms and 3 full baths; Side‑by‑side layout includes a 4‑bedroom, 2‑bath unit and a 3‑bedroom, 1‑bath unit; 133 E Southern features a new kitchen, bathroom, flooring, doors, LED lighting, switches, and outlets