Buildout-Ready Office
For Sale
$1,400,000
131-139 S Broad St, Griffith, IN 46319
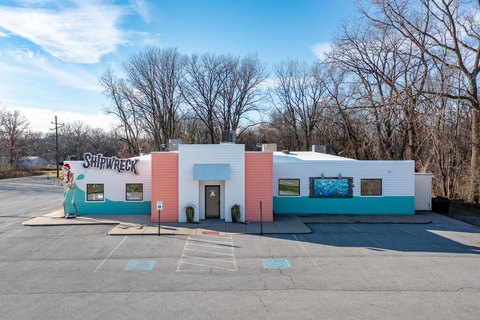
Vanilla-box office space is positioned alongside a fully leased multifamily property on a downtown corner lot.
Property Size10,142 SF
Days on Market48
Property Features for 131-139 S Broad St
General Information
Standard status
Active
Size
10,142 SF
Class
B
Property subtype
Office
Additional Details
Road Access
Yes
Building Details
Building Size
10,142 SF
Year Built
1952
Buildings
2
Listing Agency:
Latitude Commercial
Listed By:
Chandler Kimmel · License #IN #RB22001170
(219) 218-8200
Source:
Latitudeco
Added: Aug 19
Changed: Sep 11
Last Checked: Oct 4 at 7:21AM
Displayed information is deemed reliable but is not guaranteed and should be independently verified. All listing content including descriptions, pricing, images are the copyrighted material of Latitude Commercial
Investment Insights
Based on property information with market context.
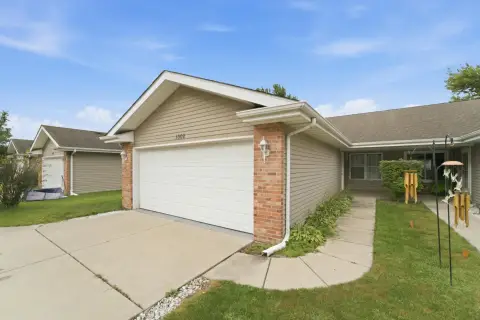
The offering combines a 10,000 SF office building in vanilla-box condition with a neighboring, fully leased 3-unit multifamily property. The office component is configured for tenant buildout, while the residential property includes two 2-bed/1-bath units, one 1-bed/1-bath unit, and a detached garage.
The properties occupy a corner lot along S Broad Street in Griffith’s downtown area, with reported daily traffic of over 8,000 vehicles. The combined configuration includes both office and residential components within the same portfolio, supporting consideration by an owner-user or investor.
The properties occupy a corner lot along S Broad Street in Griffith’s downtown area, with reported daily traffic of over 8,000 vehicles. The combined configuration includes both office and residential components within the same portfolio, supporting consideration by an owner-user or investor.
Key Highlights
- 10,000 SF office building in vanilla‑box condition
- Fully leased 3‑unit multifamily property
- Unit mix includes two 2‑bed/1‑bath units and one 1‑bed/1‑bath unit
Financial Insights
Estimated NOI and Cap Rate
NOI / Yr
$128,647
Cap Rate
9.19%
Suggested Prices Based on Cap Rates
Cap Rate 5%
$2,572,940
$2.6M
Cap Rate 7%
$1,837,814
$1.8M
Cap Rate 9%
$1,429,411
$1.4M
Market Conditions
NOI Build-Up for 10,142 SF
Gross rent
$219.1K $21.60/SF
− Vacancy
−$47.5K −$4.69/SF
EGI
$171.5K $16.91/SF
− OpEx
−$42.9K −$4.23/SF
NOI
$128.6K $12.68/SF
Area
Lake County, IN
Vacancy
21.70%
Lease Rate
$21.60 /SF/Yr
Expense Ratio
25.00%
Simulate Cap Rate and NOI
Suggested Prices Based on Cap Rates
Cap Rate 5%
$2,572,940
Cap Rate 7%
$1,837,814
Cap Rate 9%
$1,429,411
Alternative Uses
Best Use
Office B
$1.84M
$1.61M – $2.14M
NOI $128,647 @ 7.0% cap · market cap 9.19%
Second Best
Multifamily LT 5
$1.44M
$1.26M – $1.68M
NOI $100,826 @ 7.0% cap · market cap 7.20%
Theoretical Best
Specialty Retail
$2.83M
$2.48M – $3.30M
NOI $198,187 @ 7.0% cap · market cap 14.16%
Zoning and permitted uses should be independently verified with authorities.
Property Analytics
Current Use
Lease Details
Yes
Paved road access
Location Intelligence
Trade Area within ½ mile
420
Businesses Nearby
Explore this area
Business Placement
Demographics for 46319, IN
18,108
Population
7,904
Households
2.3
Avg Household Size
38
Median Age
26%
College-Educated
96%
High-School Grad
9.6 sq mi
ZIP Area
1,886
Density / Sq Mi
$75,976
Median Household Income
$42,239
Median Earnings
$1,162
Median Rent
$194,300
Median Home Value
Market
Vacancy Rate% for Office in Midwest region

Questions? Ask Rey
Realmo’s AI knows this listing — price, zoning, demand, history. Ask anything.


Frequently Asked Questions
What type of property is this?
Office building - Vanilla-box office space is positioned alongside a fully leased multifamily property on a downtown corner lot.
Where is this office building located?
The property is located at 131-139 S Broad St Griffith, IN.
What is the asking price?
The asking price for this property is $1,400,000.
What are key features of this property?
This property features: 10,000 SF office building in vanilla‑box condition; Fully leased 3‑unit multifamily property; Unit mix includes two 2‑bed/1‑bath units and one 1‑bed/1‑bath unit



