Renovated 2-Bedroom Income
For Sale
$185,000
Pending
1306 W 13TH STREET #2, Wilmington, DE 19806
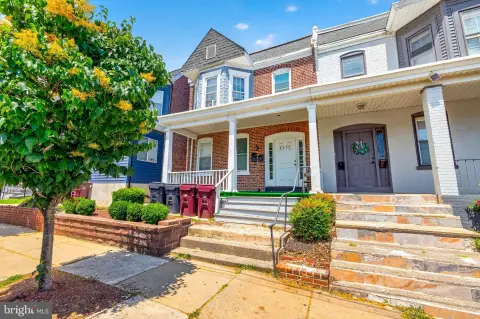
Second-floor apartment with private outdoor space, dedicated parking, and updated interior finishes.
Property Size700 SF
Days on Market55
Property Features for 1306 W 13TH STREET #2
General Information
Standard status
Pending
Size
700 SF
Total Parking Spaces
1
Property subtype
Apartment
Units
Unit Mix
1 x 2BR/1BA
Multifamily Units
1
Parking per Unit
1
Amenities
private porch/deck
Building Details
Year Built
1910
Listing Agency:
Crown Homes Real Estate
(302) 504-6147
Listed By:
George Herbert Larson III · License #RS366770
(302) 598-2487
Source:
Cummingsrealtors
Added: Aug 25
Changed: Oct 16
Last Checked: Oct 16 at 9:47AM
Displayed information is deemed reliable but is not guaranteed and should be independently verified. All listing content including descriptions, pricing, images are the copyrighted material of Crown Homes Real Estate

Ask AI about this property
Review the available facts, identify missing information and prepare questions for the agent.
Investment Insights
Based on property information with market context.
This second-floor residential income property contains two bedrooms and one bathroom within 700 square feet. The 1910 building has been recently renovated with a refreshed kitchen featuring quartzite countertops, a quartzite island, extensive cabinetry, LED lighting, and new LVP flooring in the main living areas. Both bedrooms have new carpeting, and the unit receives abundant natural light.
Approximately 200 square feet of private porch and deck space overlooks Pennsylvania Avenue, with stairs providing access to the ground level. The property also includes one dedicated parking space in a lot across the street. HOA services cover exterior building maintenance, water, and sewer.
The address is in Trolley Square in Wilmington, with restaurants, cafes, shops, nightlife, and neighborhood amenities located nearby.
Approximately 200 square feet of private porch and deck space overlooks Pennsylvania Avenue, with stairs providing access to the ground level. The property also includes one dedicated parking space in a lot across the street. HOA services cover exterior building maintenance, water, and sewer.
The address is in Trolley Square in Wilmington, with restaurants, cafes, shops, nightlife, and neighborhood amenities located nearby.
Key Highlights
- Two‑bedroom, one‑bathroom unit with 700 SF of interior space
- Recently renovated kitchen with quartzite countertops and island
- Approximately 200 square feet of private porch/deck space
Financial Insights
Estimated NOI and Cap Rate
NOI / Yr
$6,630
Cap Rate
3.58%
Suggested Prices Based on Cap Rates
Cap Rate 5%
$132,600
$132.6K
Cap Rate 7%
$94,714
$94.7K
Cap Rate 9%
$73,667
$73.7K
Market Conditions
NOI Build-Up for 700 SF
Gross rent
$12.9K $18.36/SF
− Vacancy
−$797 −$1.14/SF
EGI
$12.1K $17.22/SF
− OpEx
−$5.4K −$7.75/SF
NOI
$6.6K $9.47/SF
Area
New Castle County, DE
Vacancy
6.20%
Lease Rate
$18.36 /SF/Yr
Expense Ratio
45.00%
Simulate Cap Rate and NOI
Suggested Prices Based on Cap Rates
Cap Rate 5%
$132,600
Cap Rate 7%
$94,714
Cap Rate 9%
$73,667
Alternative Uses
Best Use
Apartment 5plus
$94.7K
$82.9K – $110.5K
NOI $6,630 @ 7.0% cap · market cap 3.58%
Second Best
—
—
no second resolved use
Theoretical Best
Office A
$167.4K
$146.5K – $195.3K
NOI $11,720 @ 7.0% cap · market cap 6.34%
Zoning and permitted uses should be independently verified with authorities.
How Realmo checks its estimates
Property Analytics
Unlock full access to Insights
Subscribe to Realmo Intelligence
Open Analytics
Current Use
Lease Details
1
Residential units
Location Intelligence
Trade Area within ½ mile
5,336
Businesses Nearby
Explore this area
Business Placement
Demographics for 19806, DE
10,083
Population
6,638
Households
1.5
Avg Household Size
45
Median Age
71%
College-Educated
98%
High-School Grad
1.7 sq mi
ZIP Area
5,931
Density / Sq Mi
$86,240
Median Household Income
$76,246
Median Earnings
$1,329
Median Rent
$370,500
Median Home Value
Check the figures for this property
Cap Rate, Value Estimation, Potential NOI and more
View Realmo Analytics








Frequently Asked Questions
What type of property is this?
Residential income property - Second-floor apartment with private outdoor space, dedicated parking, and updated interior finishes.
Where is this residential income property located?
The property is located at 1306 W 13TH STREET #2 Wilmington, DE.
What is the asking price?
The asking price for this property is $185,000.
What are key features of this property?
This property features: Two‑bedroom, one‑bathroom unit with 700 SF of interior space; Recently renovated kitchen with quartzite countertops and island; Approximately 200 square feet of private porch/deck space


