Medical Office Building with Available
For Sale
$4,300,000
1300 West Jefferson Street, Franklin, IN 46131
Configured for established healthcare users with occupied space and additional suites available for expansion or new tenancy.
Property Size28,761 SF
Days on Market47
Property Features for 1300 West Jefferson Street
General Information
Standard status
Active
Size
28,761 SF
Class
B
Property subtype
Office - General Office
Additional Details
Highway Access
Yes
Building Details
Building Size
28,761 SF
Listing Agency:
Coombes Real Estate
Listed By:
Robert Coombes · License #RB17000978
Source:
Commercialcafe
Added: Sep 1
Changed: Oct 16
Last Checked: Oct 16 at 6:10AM
Displayed information is deemed reliable but is not guaranteed and should be independently verified. All listing content including descriptions, pricing, images are the copyrighted material of Coombes Real Estate

Ask AI about this property
Review the available facts, identify missing information and prepare questions for the agent.
Investment Insights
Based on property information with market context.
This medical office property at 1300 West Jefferson Street is arranged for healthcare operations, with existing medical occupancy and suites available for additional users. Its layout and finish level are suited to established clinical practices, offering a specialized alternative to general office space. The property combines in-place healthcare income with unused suite capacity within the same building.
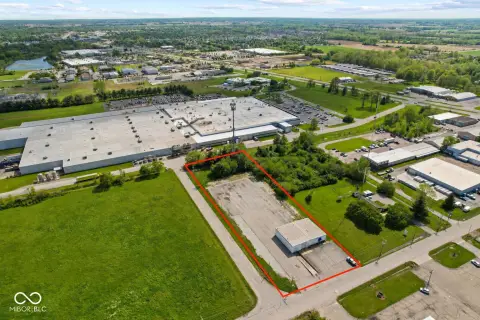
The site is positioned just off the Highway 44/144 interchange and receives visibility from traffic exceeding 11,000 vehicles per day. Johnson Memorial Health is within walking distance and includes a 149-bed hospital with more than 1,000 staff. Franklin Meadows Nursing Home and Otterbein Franklin SeniorLife add more than 300 senior care beds nearby, alongside private practices and dialysis providers. Interstate 65 is less than 10 minutes away, with Indianapolis approximately 25 miles north.
The site is positioned just off the Highway 44/144 interchange and receives visibility from traffic exceeding 11,000 vehicles per day. Johnson Memorial Health is within walking distance and includes a 149-bed hospital with more than 1,000 staff. Franklin Meadows Nursing Home and Otterbein Franklin SeniorLife add more than 300 senior care beds nearby, alongside private practices and dialysis providers. Interstate 65 is less than 10 minutes away, with Indianapolis approximately 25 miles north.
Key Highlights
- Medical office property with in‑place healthcare income and available suites
- Healthcare‑oriented layout and finishes support established clinical users
- Visibility to more than 11,000 vehicles per day near the Highway 44/144 interchange
Financial Insights
Estimated NOI and Cap Rate
NOI / Yr
$363,036
Cap Rate
8.44%
Suggested Prices Based on Cap Rates
Cap Rate 5%
$7,260,720
$7.3M
Cap Rate 7%
$5,186,229
$5.2M
Cap Rate 9%
$4,033,733
$4.0M
Market Conditions
NOI Build-Up for 28,761 SF
Gross rent
$569.5K $19.80/SF
− Vacancy
−$85.4K −$2.97/SF
EGI
$484.0K $16.83/SF
− OpEx
−$121.0K −$4.21/SF
NOI
$363.0K $12.62/SF
Area
Johnson County, IN
Vacancy
15.00%
Lease Rate
$19.80 /SF/Yr
Expense Ratio
25.00%
Simulate Cap Rate and NOI
Suggested Prices Based on Cap Rates
Cap Rate 5%
$7,260,720
Cap Rate 7%
$5,186,229
Cap Rate 9%
$4,033,733
Alternative Uses
Best Use
Office B
$5.19M
$4.54M – $6.05M
NOI $363,036 @ 7.0% cap · market cap 8.44%
Second Best
Healthcare Medical
$4.90M
$4.29M – $5.71M
NOI $342,871 @ 7.0% cap · market cap 7.97%
Theoretical Best
Office A
$7.25M
$6.34M – $8.46M
NOI $507,344 @ 7.0% cap · market cap 11.80%
Zoning and permitted uses should be independently verified with authorities.
How Realmo checks its estimates
Property Analytics
Unlock full access to Insights
Subscribe to Realmo Intelligence
Open Analytics
Current Use
Lease Details
Yes
Highway access
Location Intelligence
Trade Area within ½ mile
431
Businesses Nearby
Under-served
Demand for This Use
Explore this area
Business Placement
Demographics for 46131, IN
32,869
Population
13,151
Households
2.5
Avg Household Size
38
Median Age
25%
College-Educated
92%
High-School Grad
126.0 sq mi
ZIP Area
261
Density / Sq Mi
$81,914
Median Household Income
$44,797
Median Earnings
$1,114
Median Rent
$227,800
Median Home Value
Check the figures for this property
Cap Rate, Value Estimation, Potential NOI and more
View Realmo Analytics
Market
Vacancy Rate% for Office in Midwest region



Frequently Asked Questions
What type of property is this?
Medical Office Space - Configured for established healthcare users with occupied space and additional suites available for expansion or new tenancy.
Where is this medical office space located?
The property is located at 1300 West Jefferson Street Franklin, IN.
What is the asking price?
The asking price for this property is $4,300,000.
What are key features of this property?
This property features: Medical office property with in‑place healthcare income and available suites; Healthcare‑oriented layout and finishes support established clinical users; Visibility to more than 11,000 vehicles per day near the Highway 44/144 interchange


