Updated Mixed-Use Building with
For Sale
$675,000
13 2nd Ave SE, Minot, ND 58701
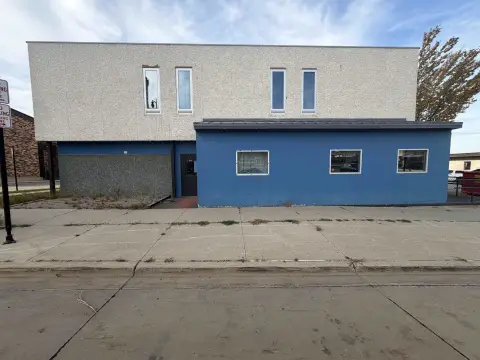
Renovated mixed-use property with a leased medical spa and eight apartment units, offering flexibility for future residential completion.
Property SizeContact for details
Days on Market145
Property Features for 13 2nd Ave SE
General Information
Standard status
Active
Property subtype
Commercial
Zoning
C3
Additional Details
Multifamily Units
8
Building Details
Year Built
1916
Listed By:
Mike Matteson
(701) 337-6433
Source:
Westinkster.idxbroker
Added: Jun 1
Changed: Oct 7
Last Checked: Oct 23 at 3:29AM
Displayed information is deemed reliable but is not guaranteed and should be independently verified. All listing content including descriptions, pricing, images are the copyrighted material of Mike Matteson

Ask AI about this property
Review the available facts, identify missing information and prepare questions for the agent.
Investment Insights
Based on property information with market context.
This updated mixed-use property includes a renovated main-floor commercial space and an eight-unit residential upper level. The upper level features eight apartment units total, with four units fully renovated and currently occupied. The remaining four units are underway in renovation, with updated electrical and plumbing completed and finishing work still needed. Main-floor improvements support a turnkey medical spa layout, including a reception and waiting area, multiple treatment rooms or office spaces, storage, bathrooms, and a break room. A full unfinished basement and a coin-operated laundry area add additional storage and operational utility.
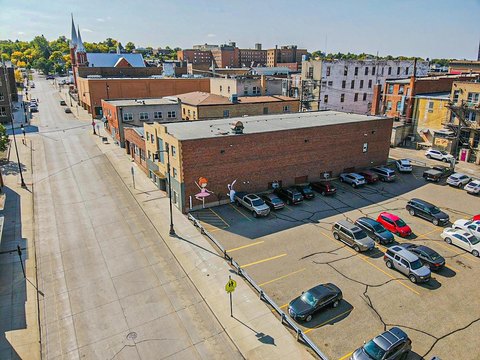
The building is positioned in downtown Minot, placing occupants within walking distance of local restaurants, entertainment, street festivals, and community events. The commercial space is currently leased to a medical spa under a four-year lease, with the business itself not for sale.
Recent property-wide upgrades include updated electrical, updated plumbing extending to the city connection, repaired roofing, individual apartment meters, and new mini-split air conditioning systems installed in all eight apartment units. The commercial space has central air, and the entire property benefits from efficient hot water heat. With residential units in multiple stages of completion and established commercial tenancy, the property is designed to support both ongoing operations and additional finishing for the remaining residential units.
The building is positioned in downtown Minot, placing occupants within walking distance of local restaurants, entertainment, street festivals, and community events. The commercial space is currently leased to a medical spa under a four-year lease, with the business itself not for sale.
Recent property-wide upgrades include updated electrical, updated plumbing extending to the city connection, repaired roofing, individual apartment meters, and new mini-split air conditioning systems installed in all eight apartment units. The commercial space has central air, and the entire property benefits from efficient hot water heat. With residential units in multiple stages of completion and established commercial tenancy, the property is designed to support both ongoing operations and additional finishing for the remaining residential units.
Key Highlights
- Mixed‑use commercial property built in 1916 with eight apartment units and a main‑floor commercial space
- Main‑floor commercial space leased to a medical spa on a four‑year lease (business not for sale)
- Upper level has 8 apartments: 4 fully renovated and occupied, and 4 under renovation with updated electrical and plumbing
Property Analytics
Unlock full access to Insights
Subscribe to Realmo Intelligence
Open Analytics
Current Use
Lease Details
8
Residential units
Location Intelligence
Trade Area within ½ mile
1,768
Businesses Nearby
Explore this area
Business Placement
Demographics for 58701, ND
32,517
Population
16,267
Households
2
Avg Household Size
37
Median Age
28%
College-Educated
95%
High-School Grad
235.6 sq mi
ZIP Area
138
Density / Sq Mi
$75,329
Median Household Income
$46,695
Median Earnings
$875
Median Rent
$270,200
Median Home Value
Check the figures for this property
Cap Rate, Value Estimation, Potential NOI and more
View Realmo Analytics
Market
Vacancy Rate% for Multifamily in Midwest region






Frequently Asked Questions
What type of property is this?
Mixed-use property - Renovated mixed-use property with a leased medical spa and eight apartment units, offering flexibility for future residential completion.
Where is this mixed-use property located?
The property is located at 13 2nd Ave SE Minot, ND.
What is the asking price?
The asking price for this property is $675,000.
What are key features of this property?
This property features: Mixed‑use commercial property built in 1916 with eight apartment units and a main‑floor commercial space; Main‑floor commercial space leased to a medical spa on a four‑year lease (business not for sale); Upper level has 8 apartments: 4 fully renovated and occupied, and 4 under renovation with updated electrical and plumbing