Encinitas Retail and Office
For Sale
Contact for pricing
Pending
128 West E Street, Encinitas, CA 92024
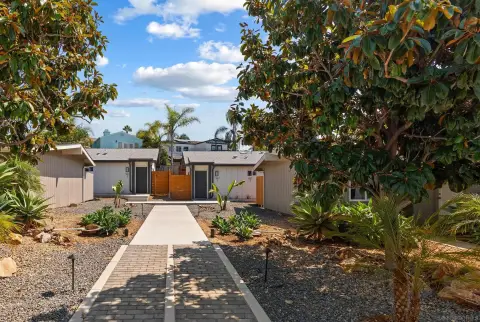
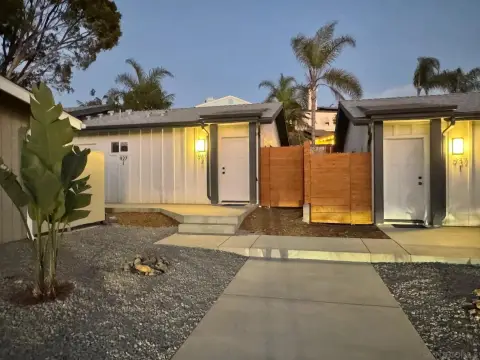
6,508 SF retail and office building near the Pacific.
Property Size6,508 SF
Days on Market151
Property Features for 128 West E Street
General Information
Standard status
Pending
Size
6,508 SF
Property subtype
Retail, Office
Occupancy
82%
Investment Type
Owner/User
Building Details
Buildings
2
Tenancy
Multi
Listing Agency:
Marcus & Millichap - Downtown San Diego
Listed By:
Ross Sanchez · License #02065066
Source:
Crexi
Added: May 19
Changed: Oct 9
Last Checked: Oct 16 at 6:06AM
Displayed information is deemed reliable but is not guaranteed and should be independently verified. All listing content including descriptions, pricing, images are the copyrighted material of Marcus & Millichap - Downtown San Diego

Ask AI about this property
Review the available facts, identify missing information and prepare questions for the agent.
Investment Insights
Based on property information with market context.
The property at 128-130 W E St & 571-577 2nd St is a 6,508 square-foot retail and office building comprised of six suites. It is located two blocks from the Pacific in Encinitas. The building is situated in the heart of downtown, within walking distance of the coast, restaurants, and the 101 corridor. Five of the six suites are occupied, with 35% of the RBA leased beyond three years. Earthquake retrofitting has been completed, the sewer lines have been replaced, and the electrical feeders have been upgraded to copper. A new roof is scheduled for this year. The leases are short-term, and the rents are below market.
Key Highlights
- Prime location in a highly desirable Encinitas submarket, two blocks from the Pacific Ocean and walking distance to downtown amenities.
- Significant upside potential through resetting rents to market rates and stabilizing the asset due to short‑term leases and below‑market rents.
- Flexibility for either an investor to stabilize the asset or an owner‑user to occupy a portion of the building in a tightly held coastal market.
Financial Insights
Estimated NOI and Cap Rate
NOI / Yr
$140,549
Cap Rate
2.81%
Suggested Prices Based on Cap Rates
Cap Rate 5%
$2,810,980
$2.8M
Cap Rate 7%
$2,007,843
$2.0M
Cap Rate 9%
$1,561,656
$1.6M
Market Conditions
NOI Build-Up for 6,508 SF
Gross rent
$262.4K $40.32/SF
− Vacancy
−$37.5K −$5.77/SF
EGI
$224.9K $34.55/SF
− OpEx
−$84.3K −$12.96/SF
NOI
$140.5K $21.60/SF
Area
San Diego County, CA
Vacancy
14.30%
Lease Rate
$40.32 /SF/Yr
Expense Ratio
37.50%
Simulate Cap Rate and NOI
Suggested Prices Based on Cap Rates
Cap Rate 5%
$2,810,980
Cap Rate 7%
$2,007,843
Cap Rate 9%
$1,561,656
Alternative Uses
Best Use
Mixed Use
$2.01M
$1.76M – $2.34M
NOI $140,549 @ 7.0% cap · market cap 2.81%
Second Best
—
—
no second resolved use
Theoretical Best
Office A
$2.98M
$2.61M – $3.48M
NOI $208,722 @ 7.0% cap · market cap 4.17%
Zoning and permitted uses should be independently verified with authorities.
How Realmo checks its estimates
Property Analytics
Unlock full access to Insights
Subscribe to Realmo Intelligence
Open Analytics
Current Use
Location Intelligence
Trade Area within ½ mile
2,305
Businesses Nearby
Explore this area
Business Placement
Demographics for 92024, CA
51,190
Population
21,566
Households
2.4
Avg Household Size
44
Median Age
67%
College-Educated
96%
High-School Grad
18.0 sq mi
ZIP Area
2,844
Density / Sq Mi
$149,080
Median Household Income
$70,949
Median Earnings
$2,643
Median Rent
$1,409,700
Median Home Value
Check the figures for this property
Cap Rate, Value Estimation, Potential NOI and more
View Realmo Analytics




Frequently Asked Questions
What type of property is this?
Mixed-use property - 6,508 SF retail and office building near the Pacific.
Where is this mixed-use property located?
The property is located at 128 West E Street Encinitas, CA.
What is the asking price?
The asking price for this property is $5,000,000.
What are key features of this property?
This property features: Prime location in a highly desirable Encinitas submarket, two blocks from the Pacific Ocean and walking distance to downtown amenities.; Significant upside potential through resetting rents to market rates and stabilizing the asset due to short‑term leases and below‑market rents.; Flexibility for either an investor to stabilize the asset or an owner‑user to occupy a portion of the building in a tightly held coastal market.


