5-Unit Apartment
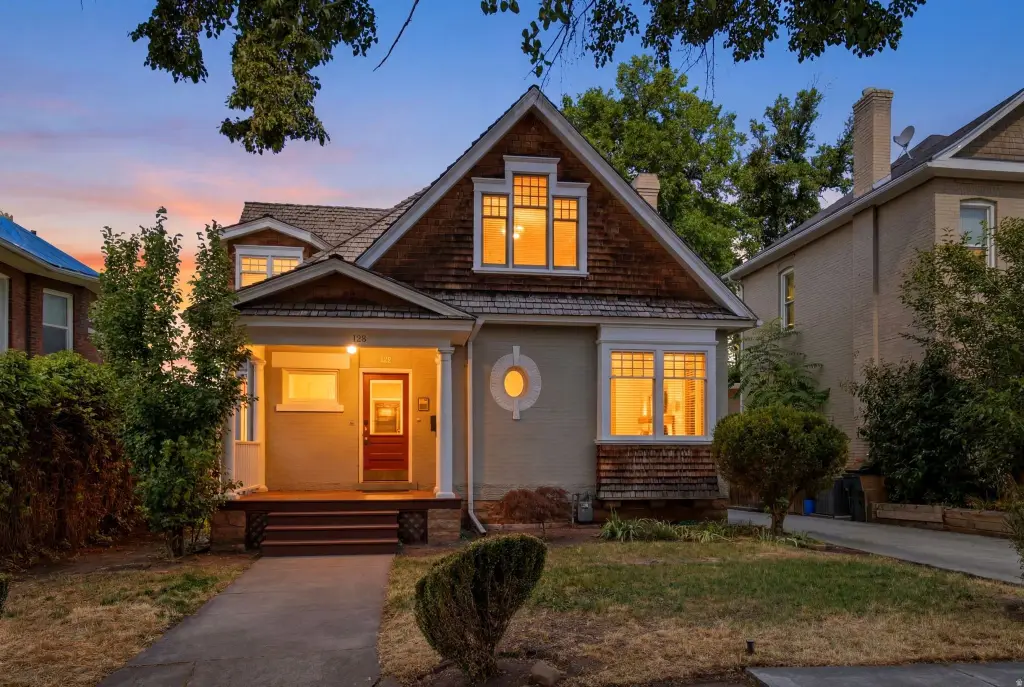
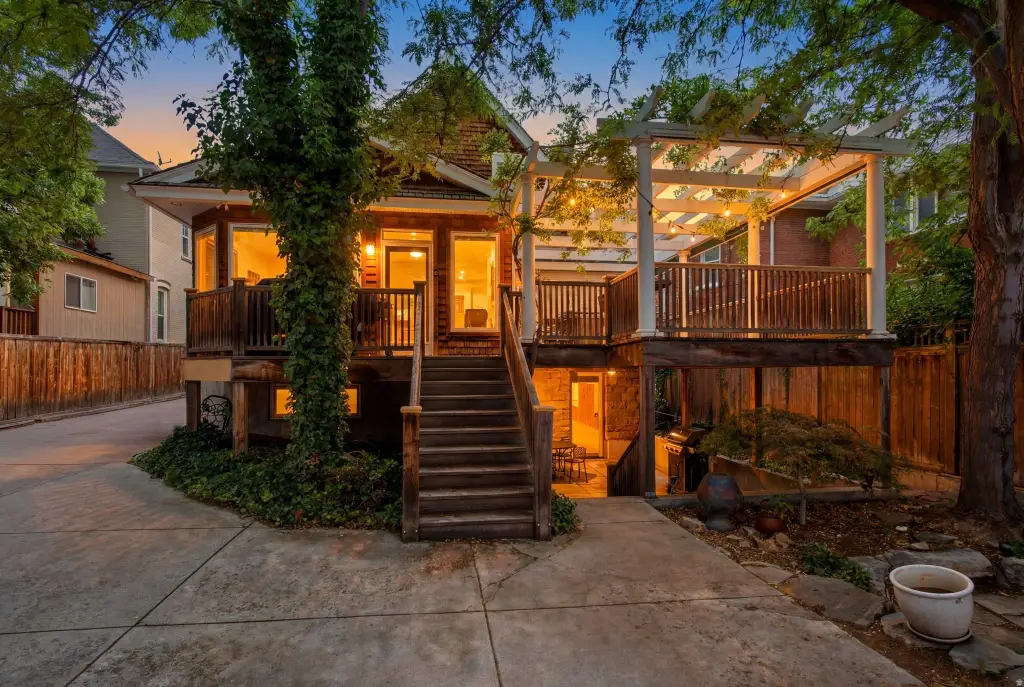
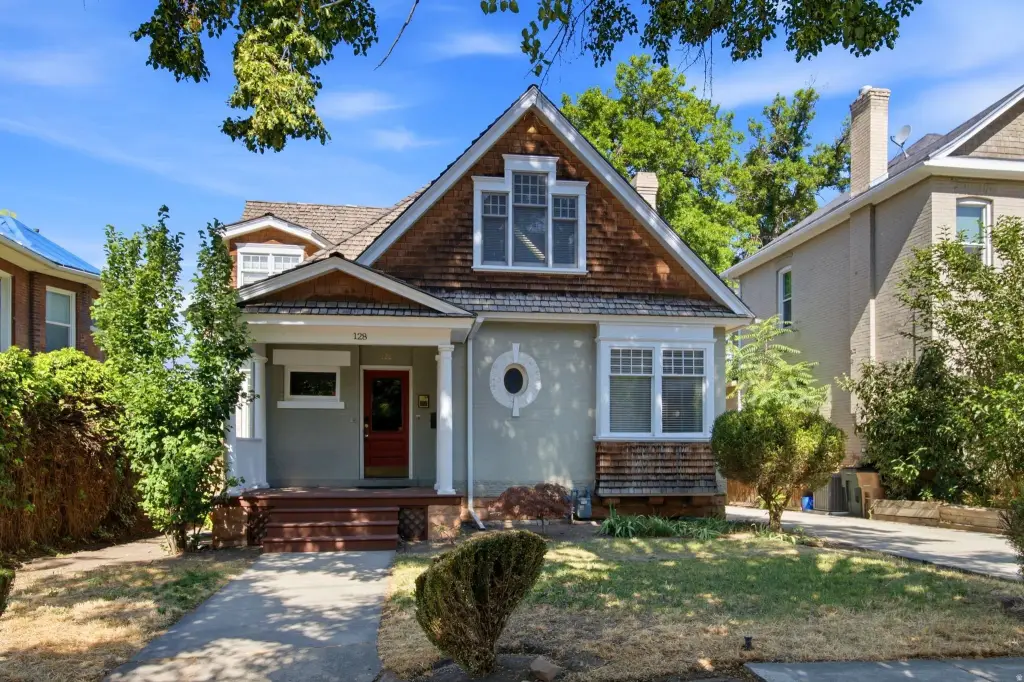
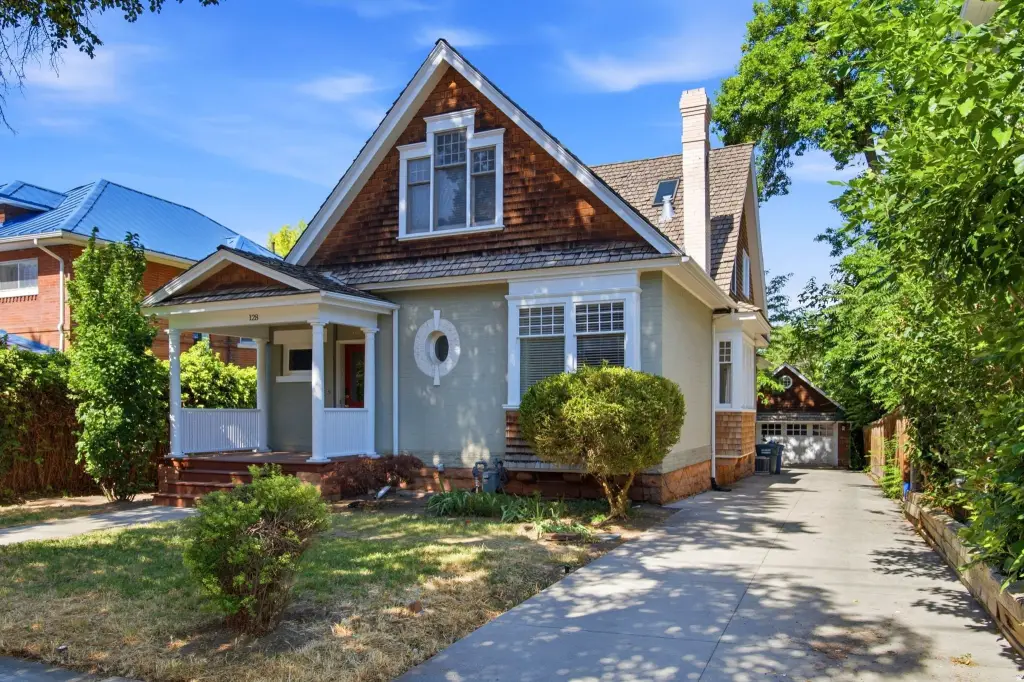
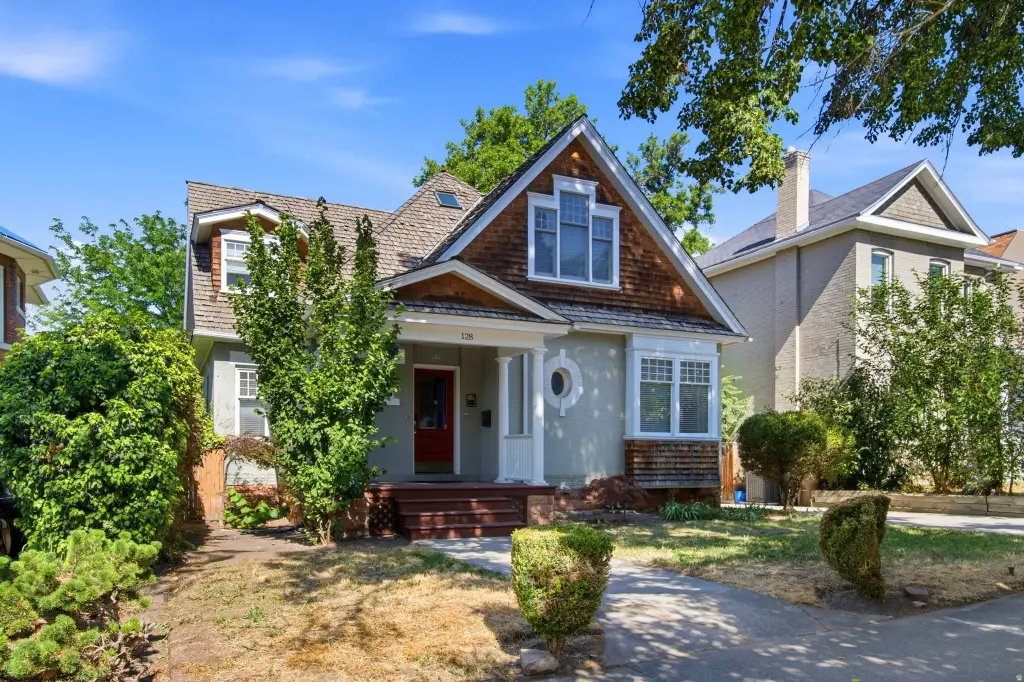
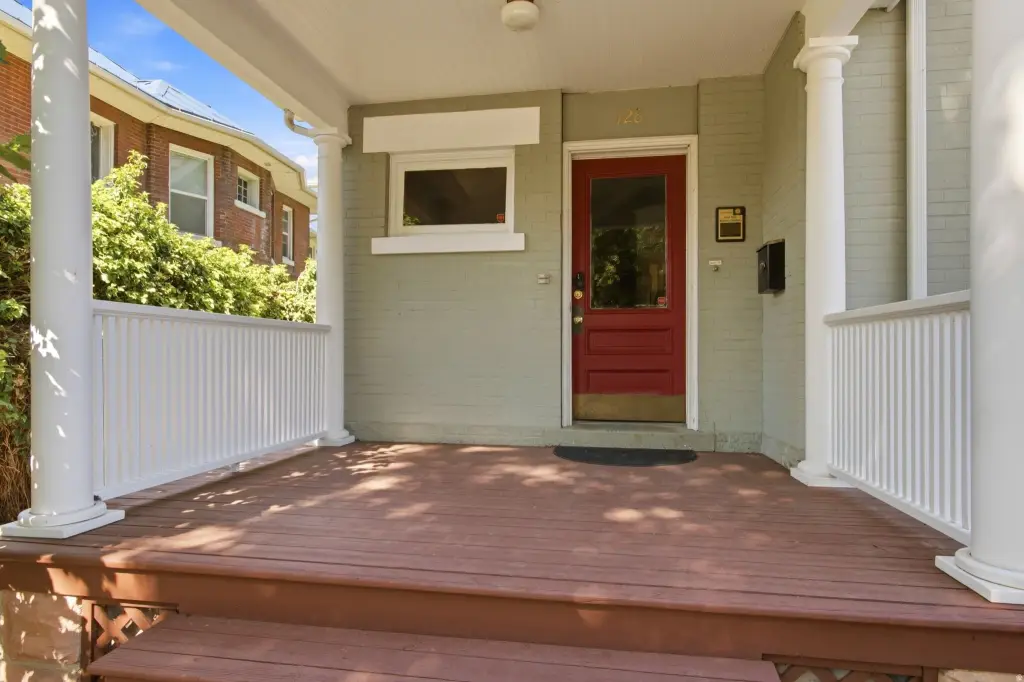
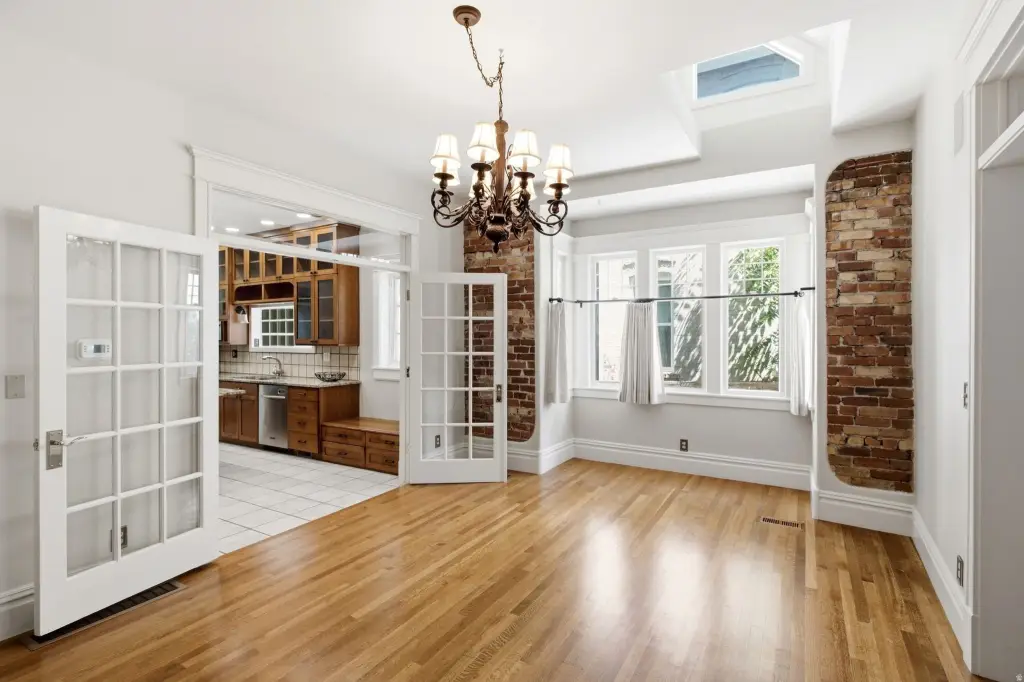
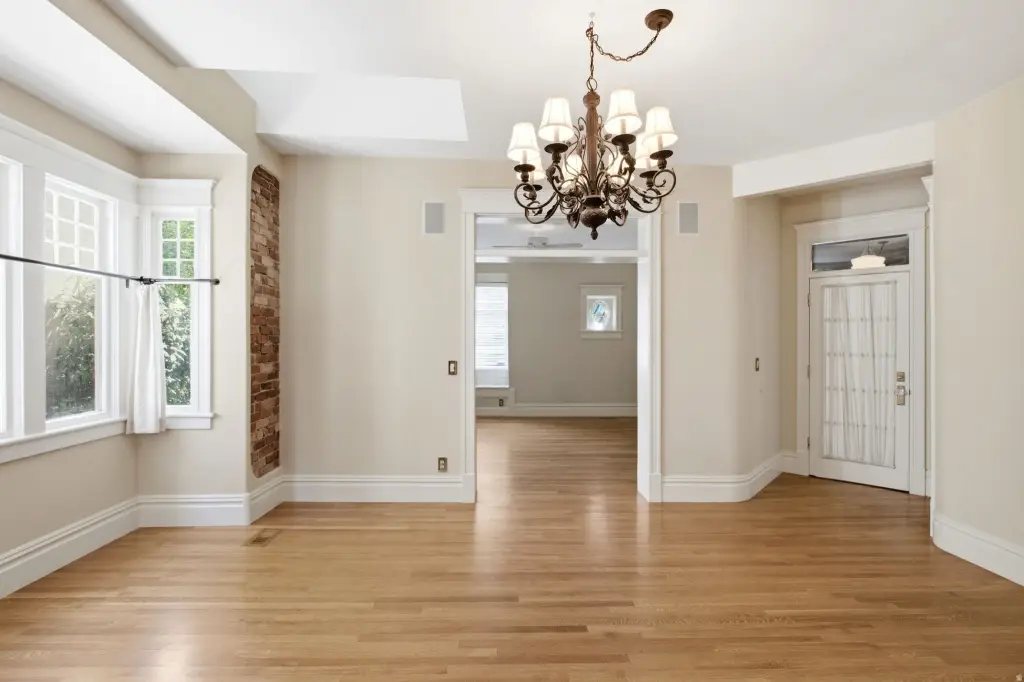
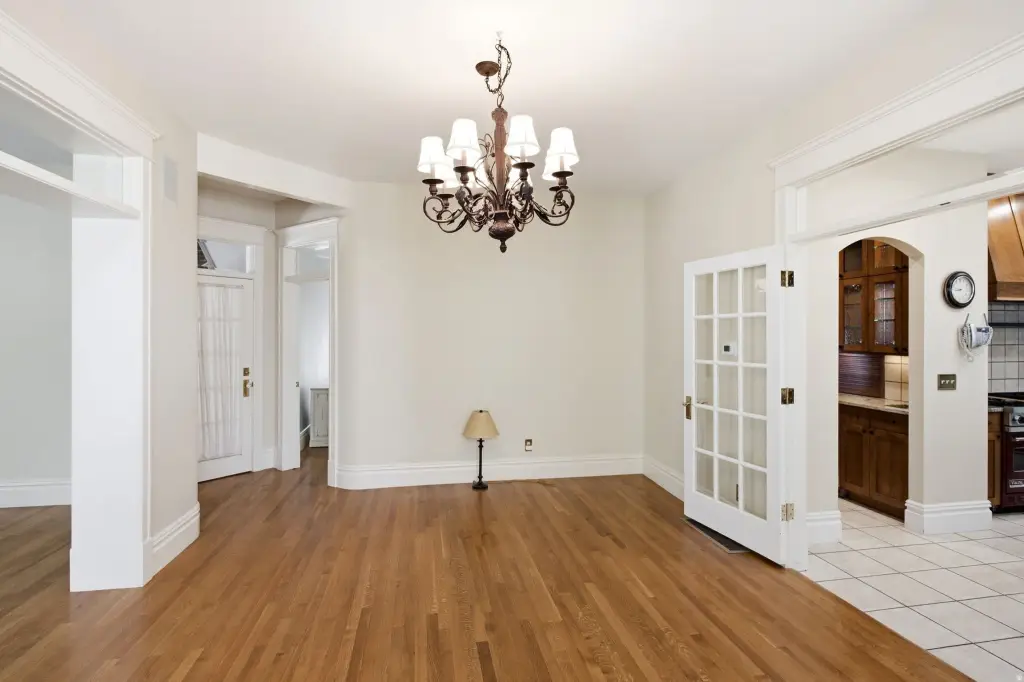
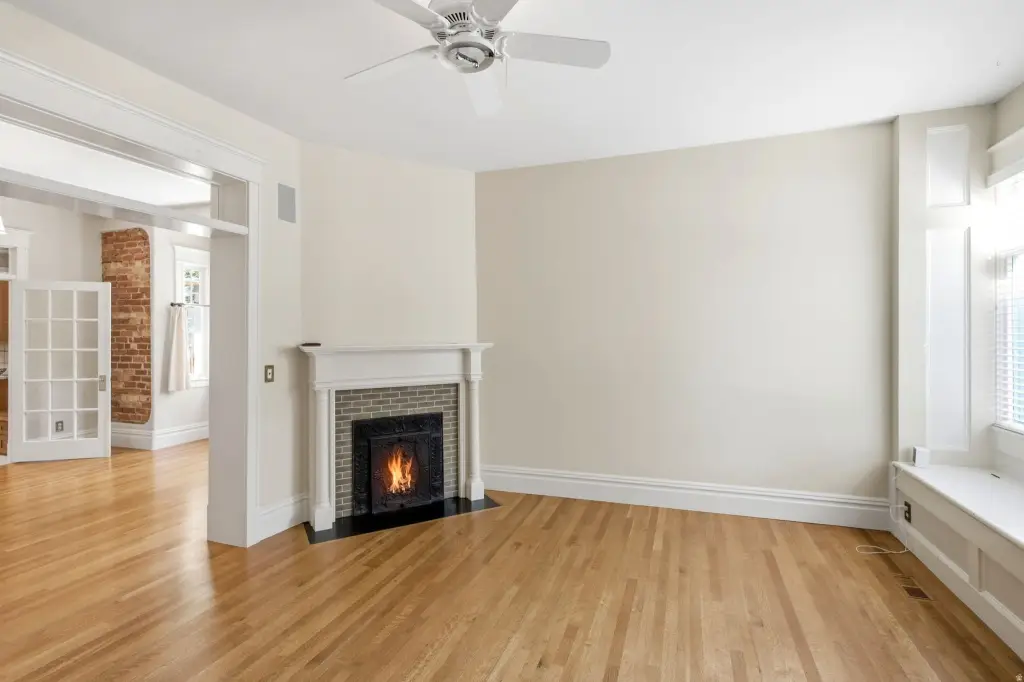
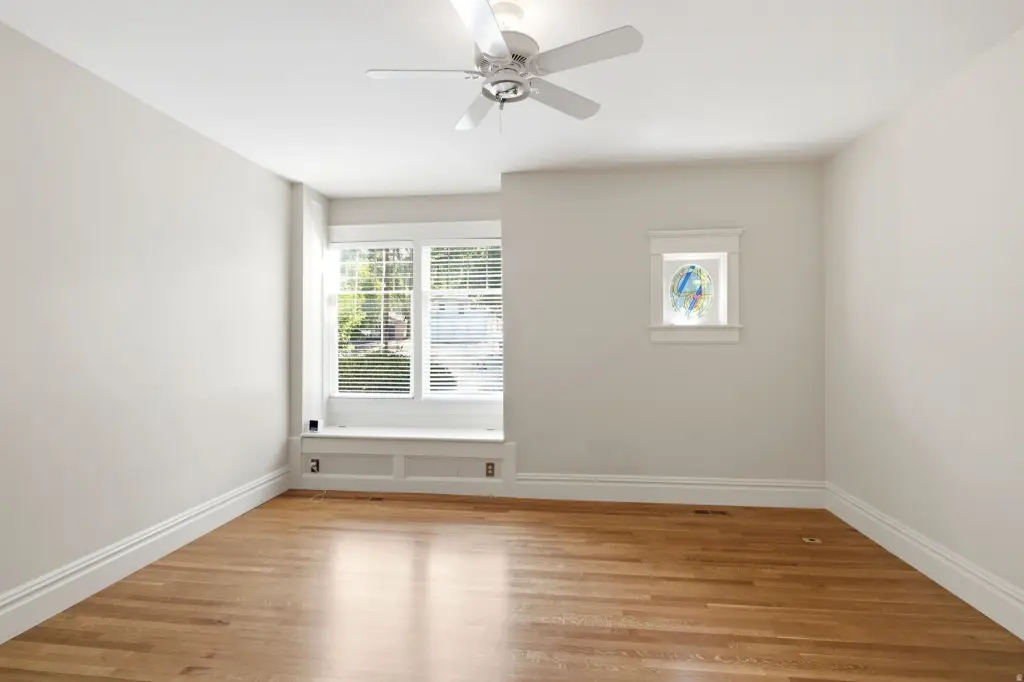
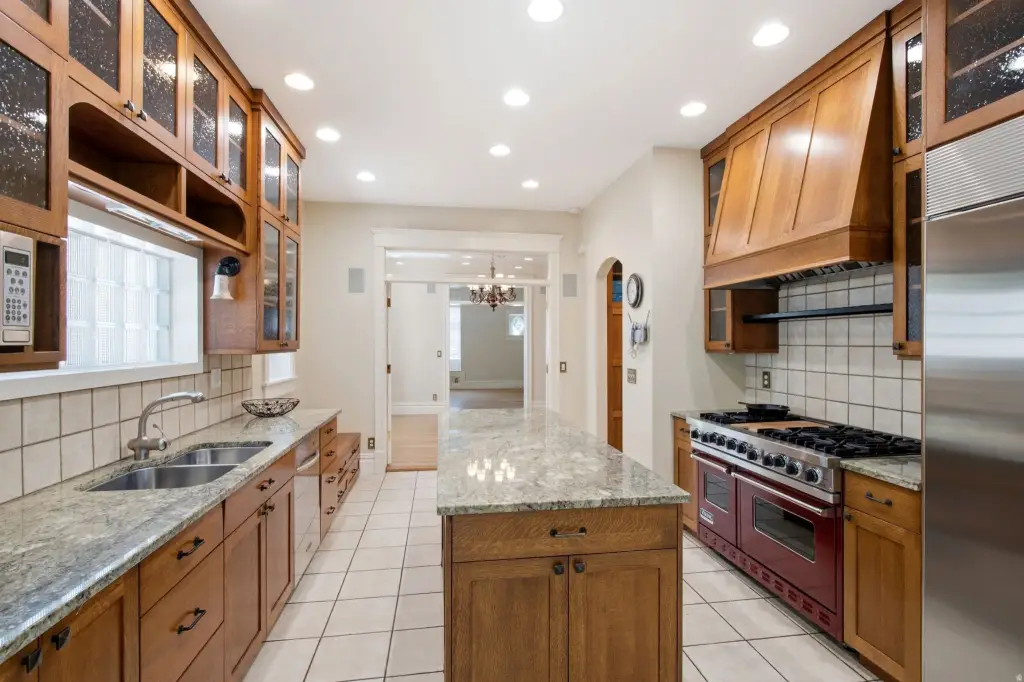
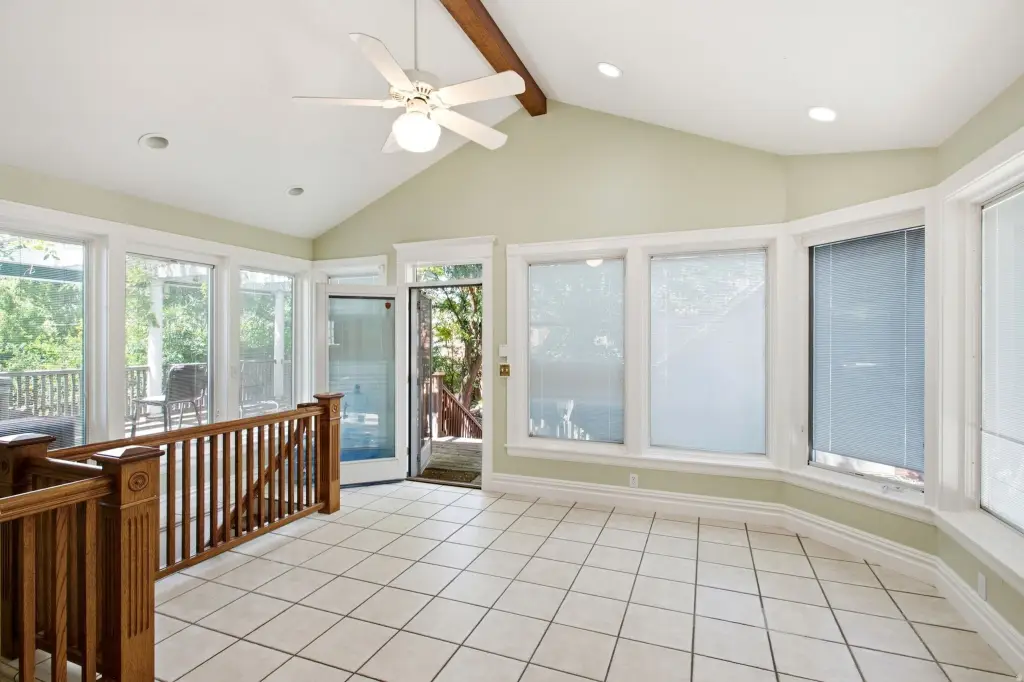
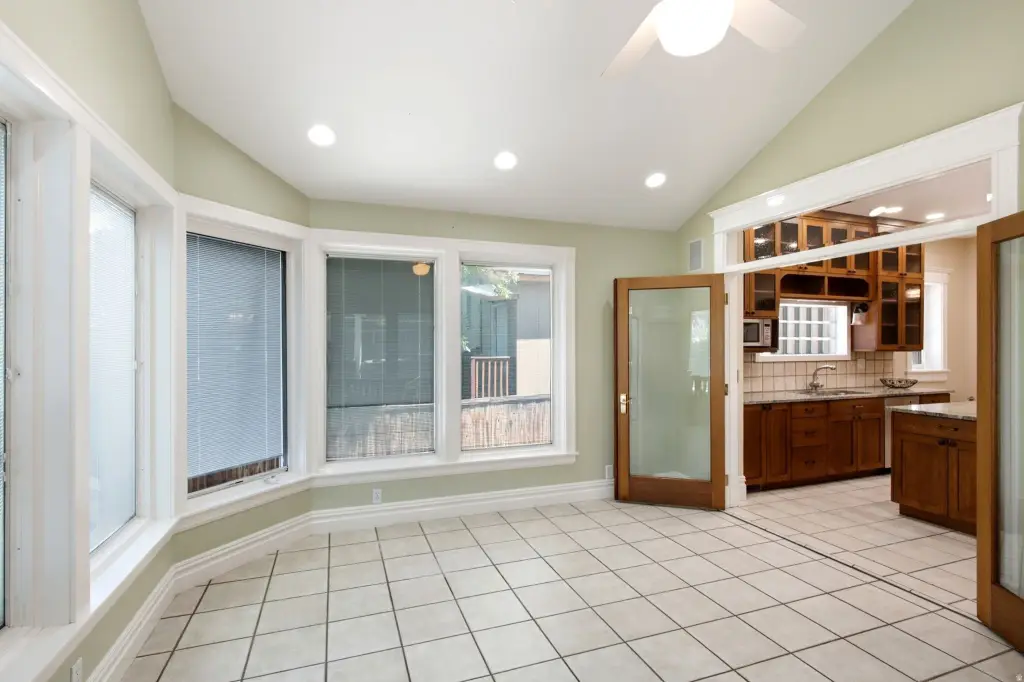
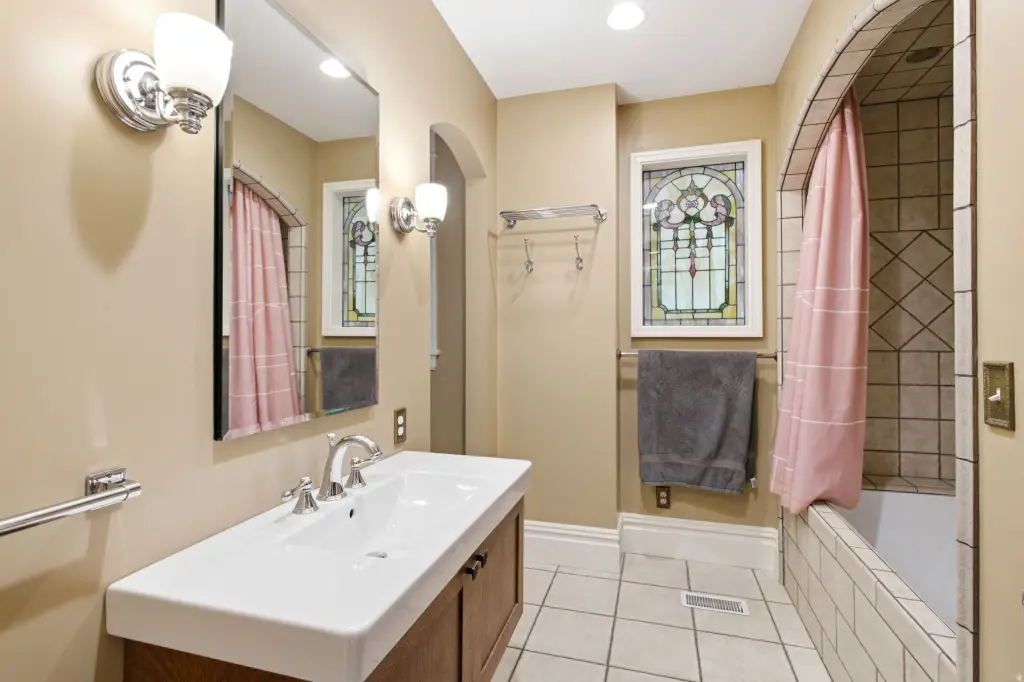
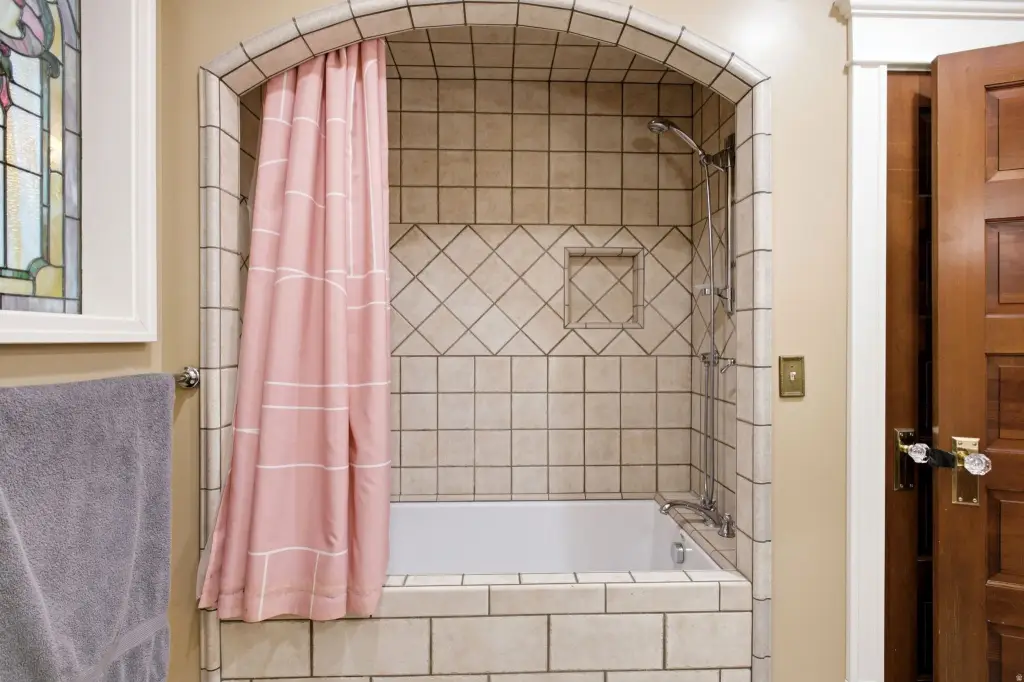
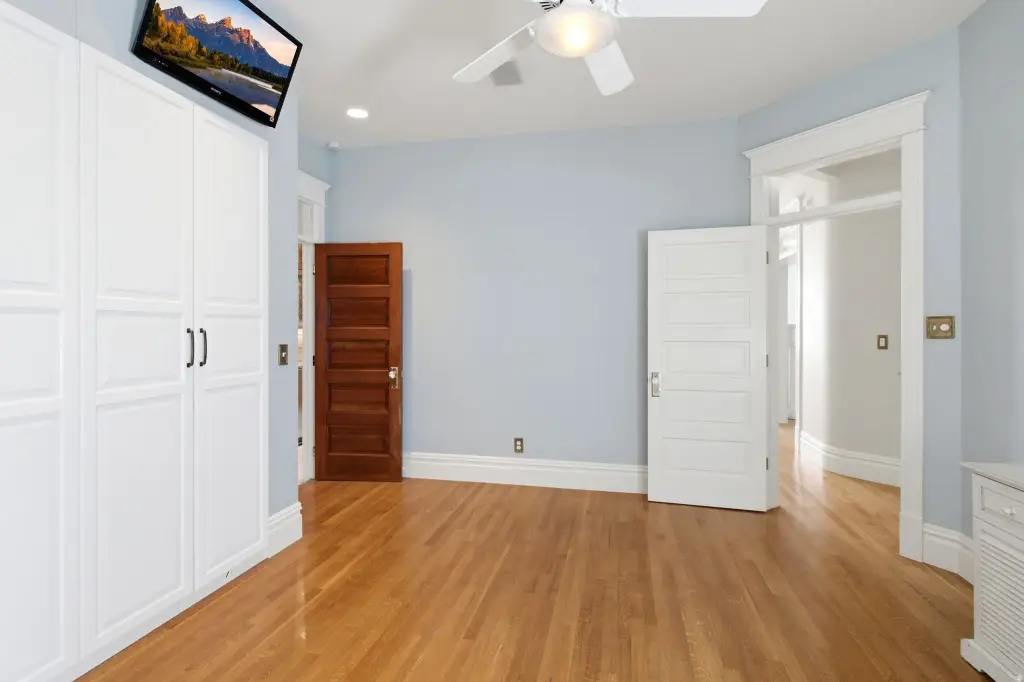
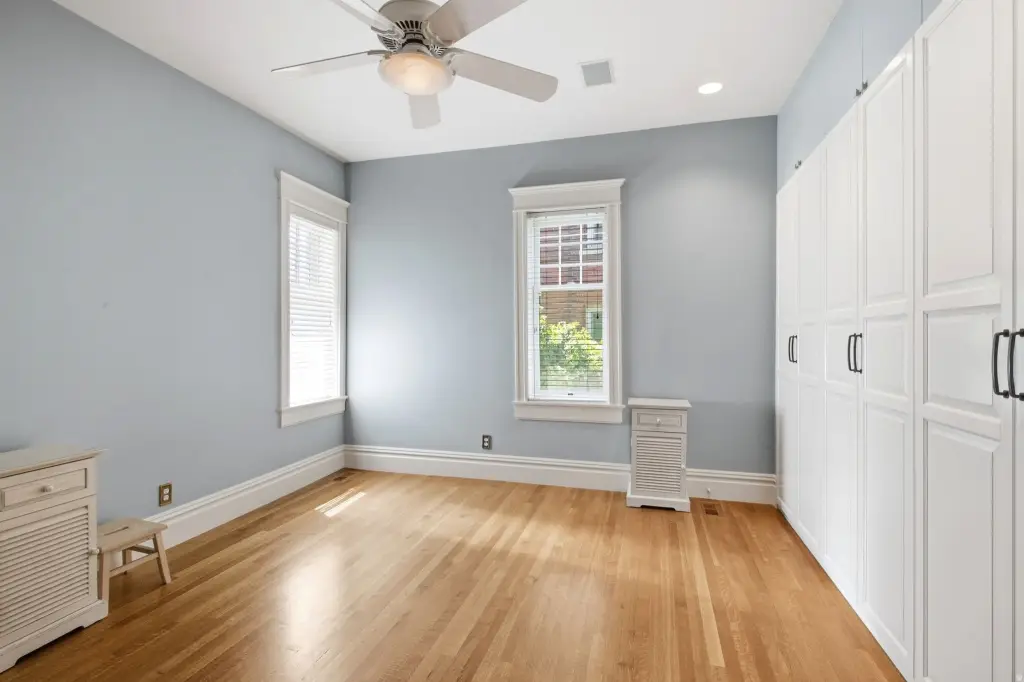
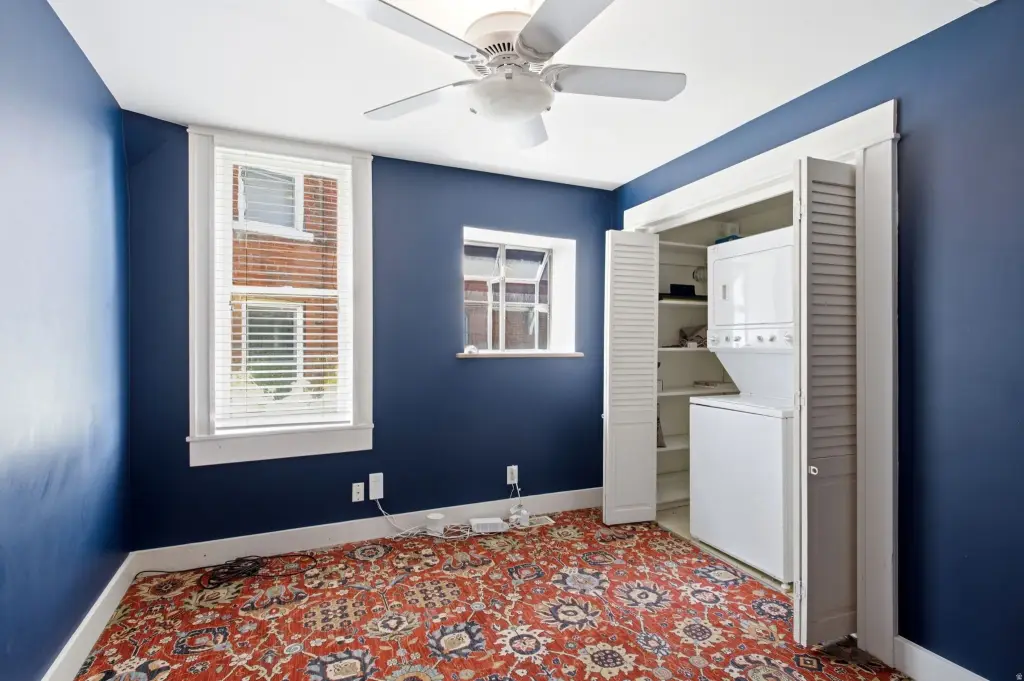
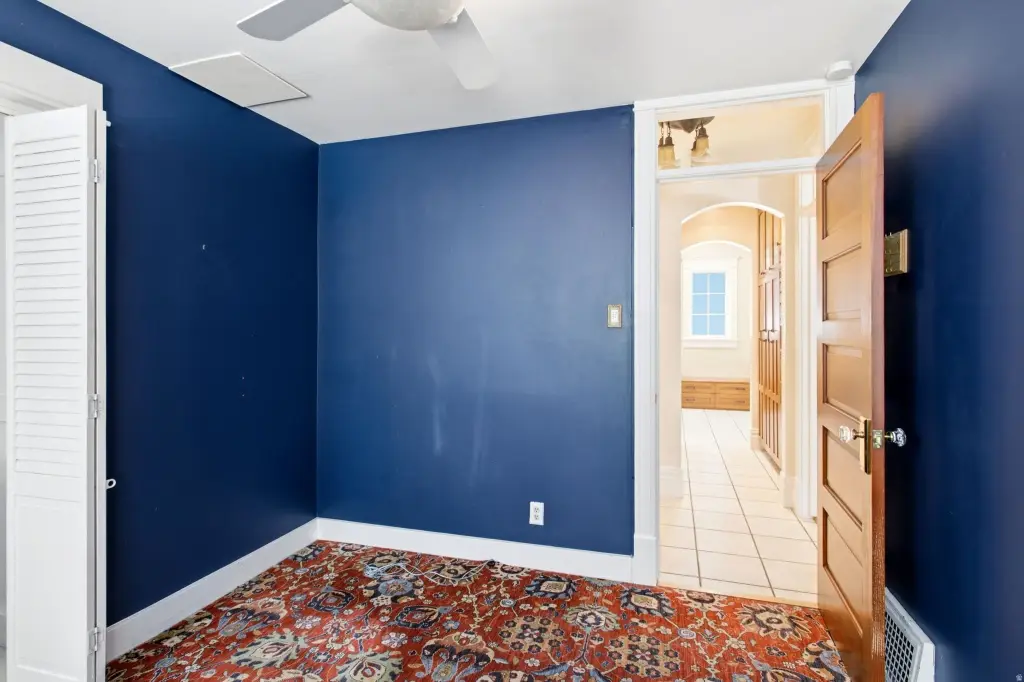
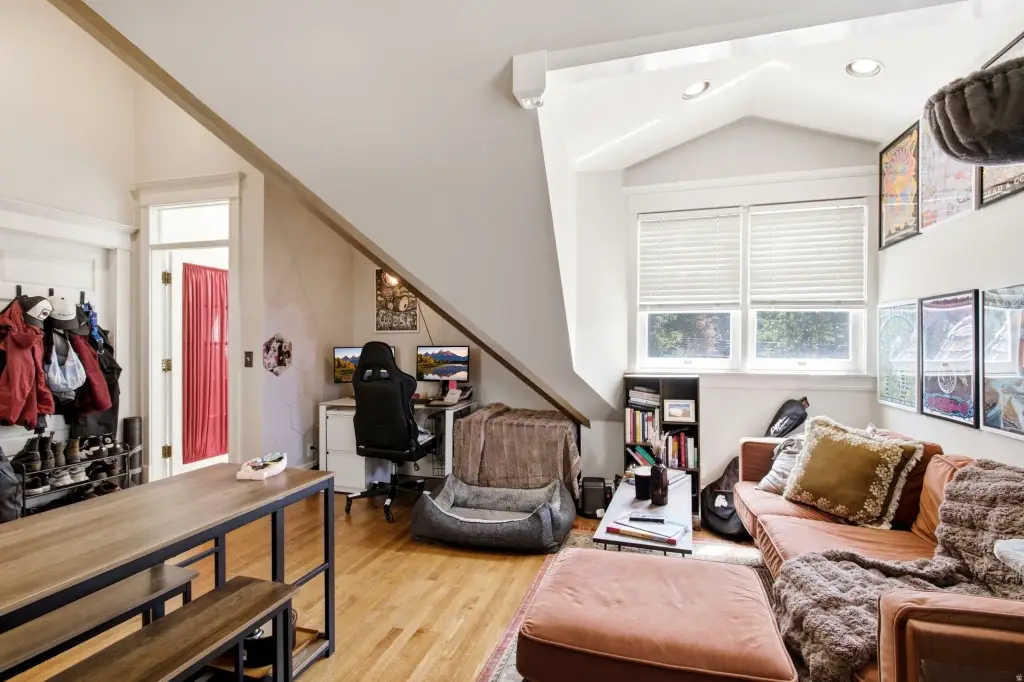
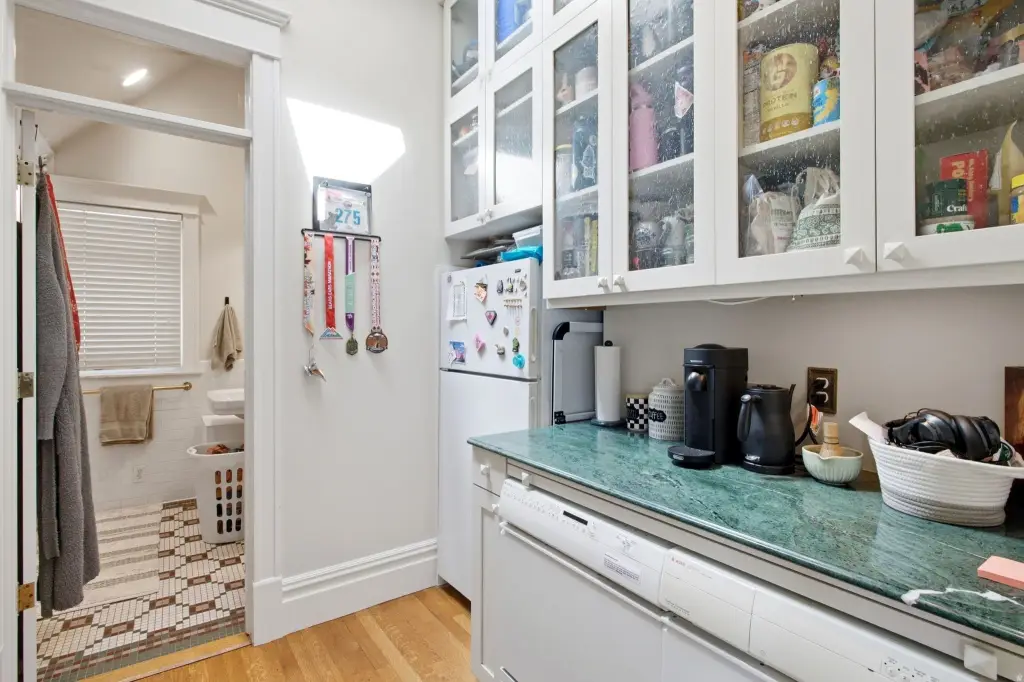
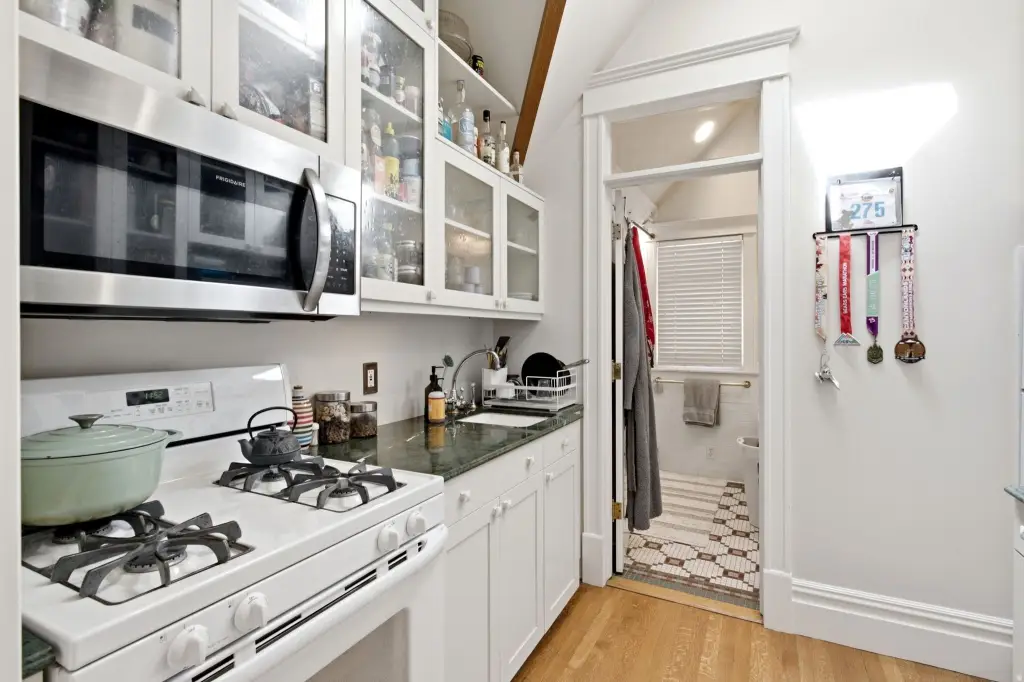
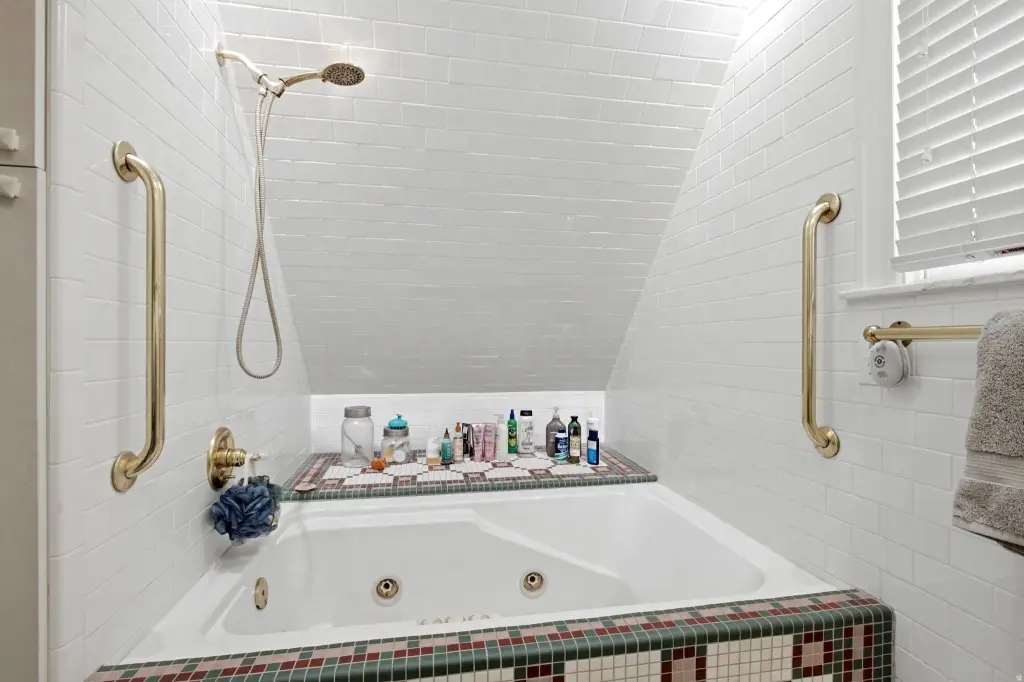
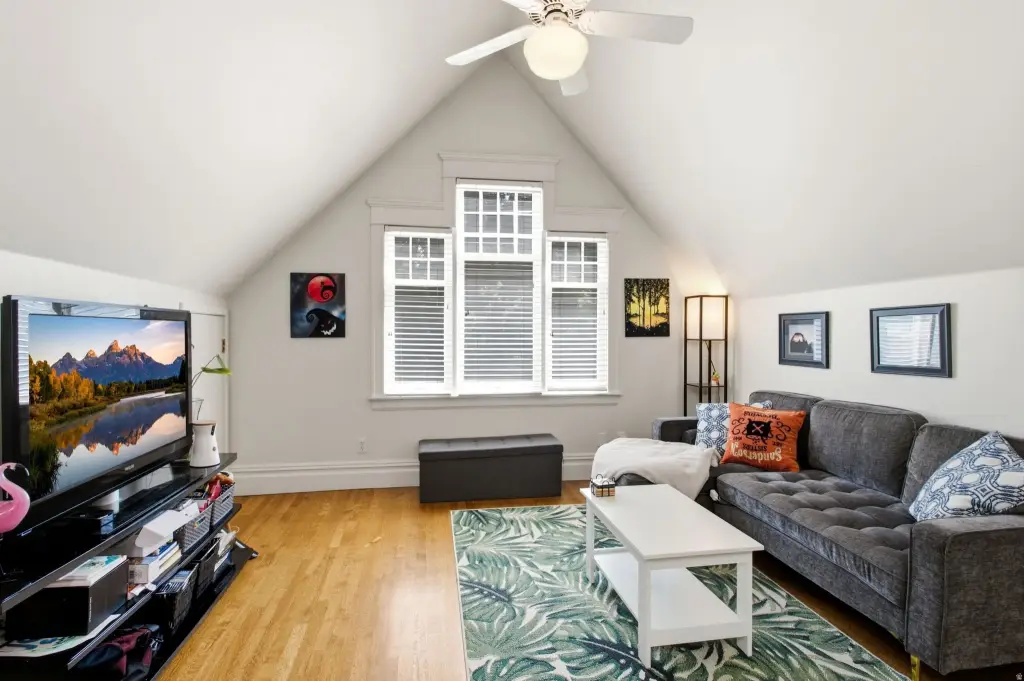
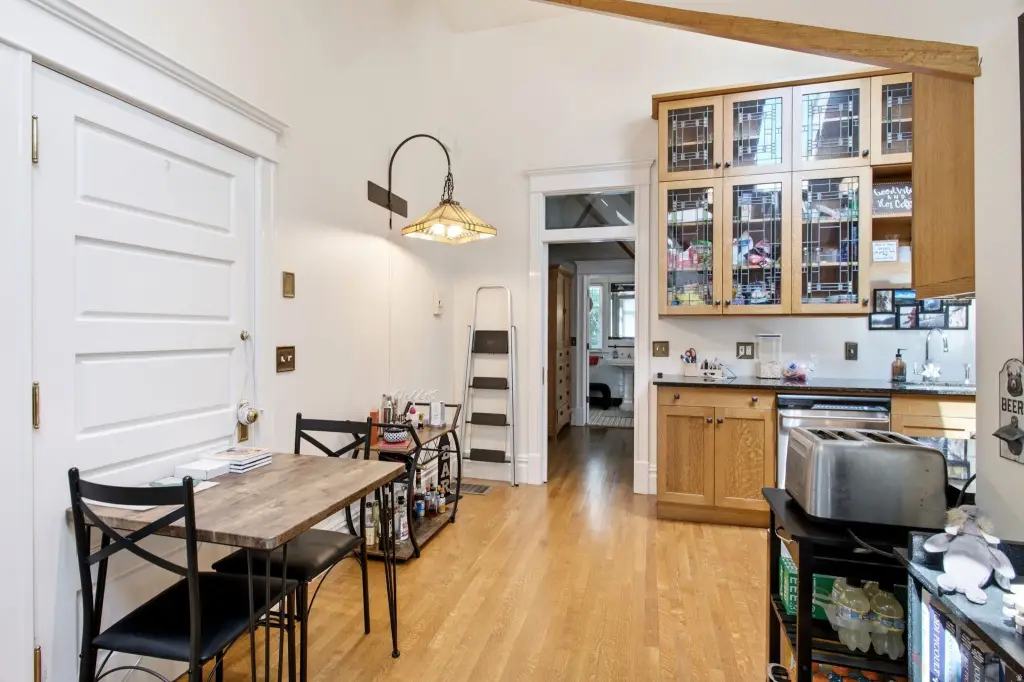
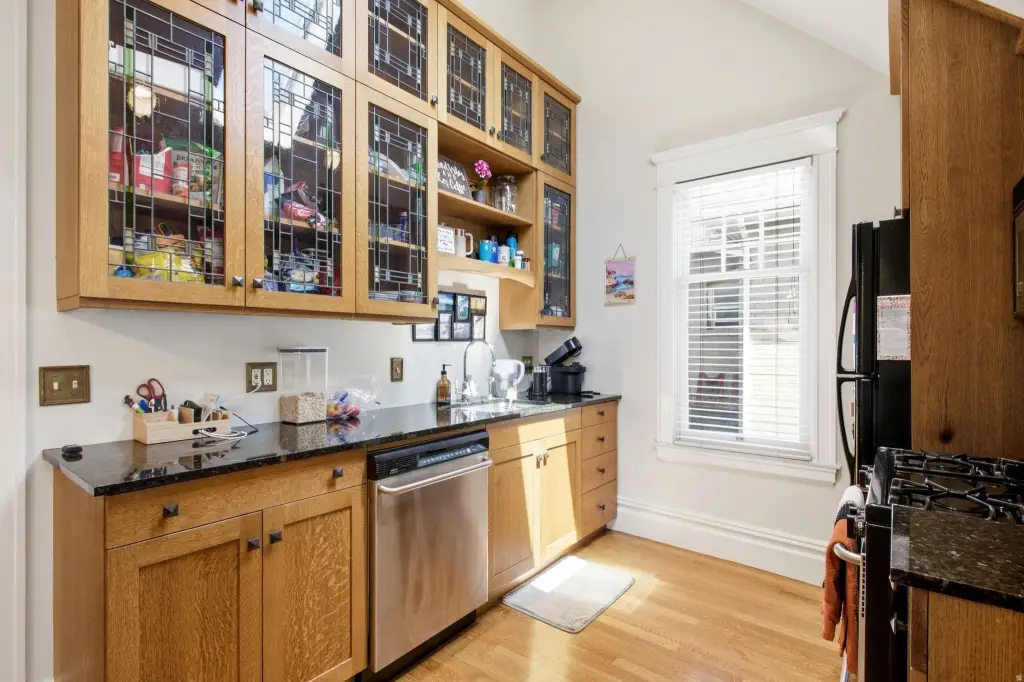
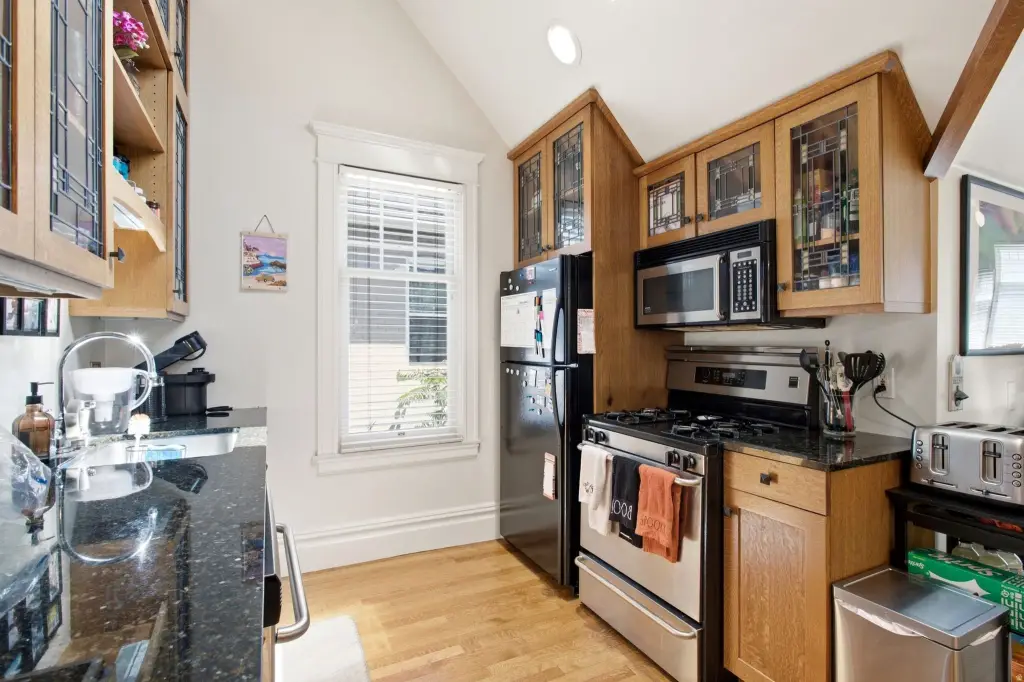
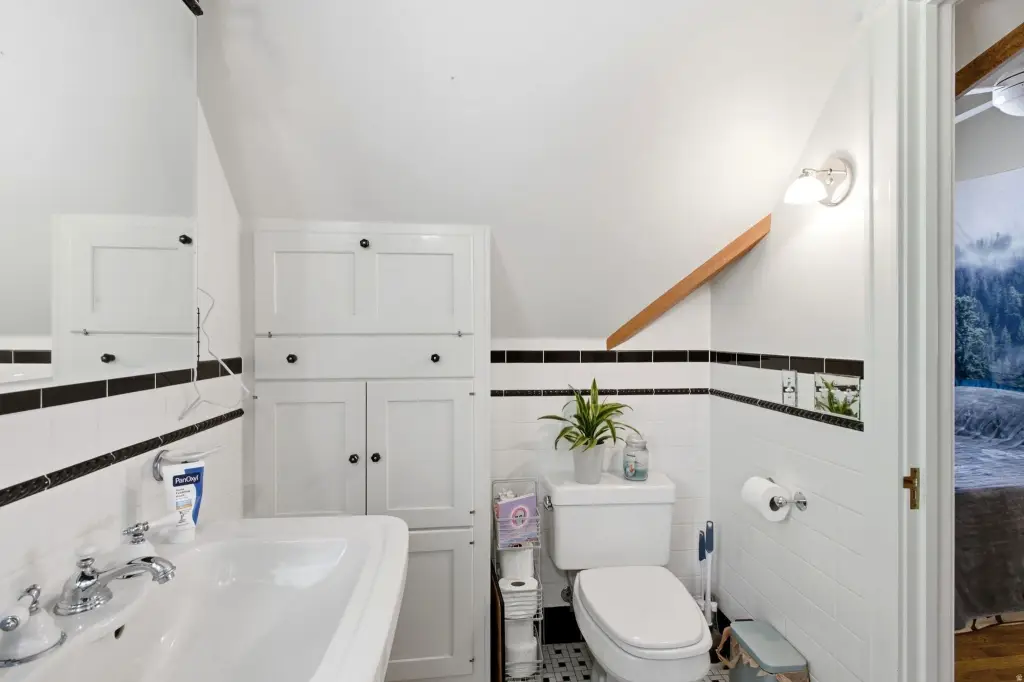
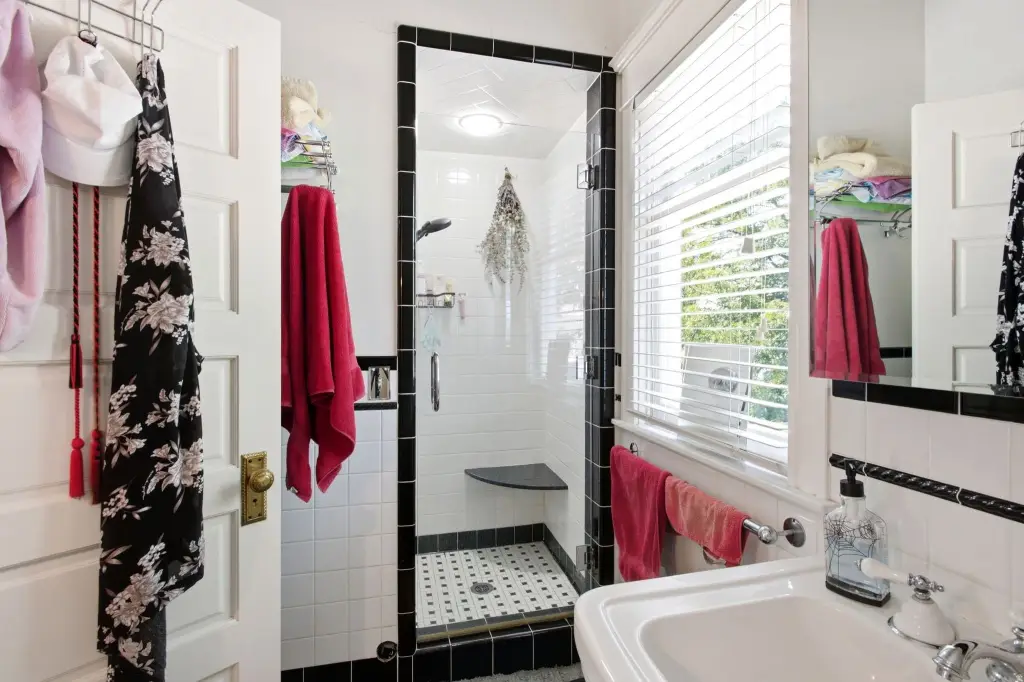
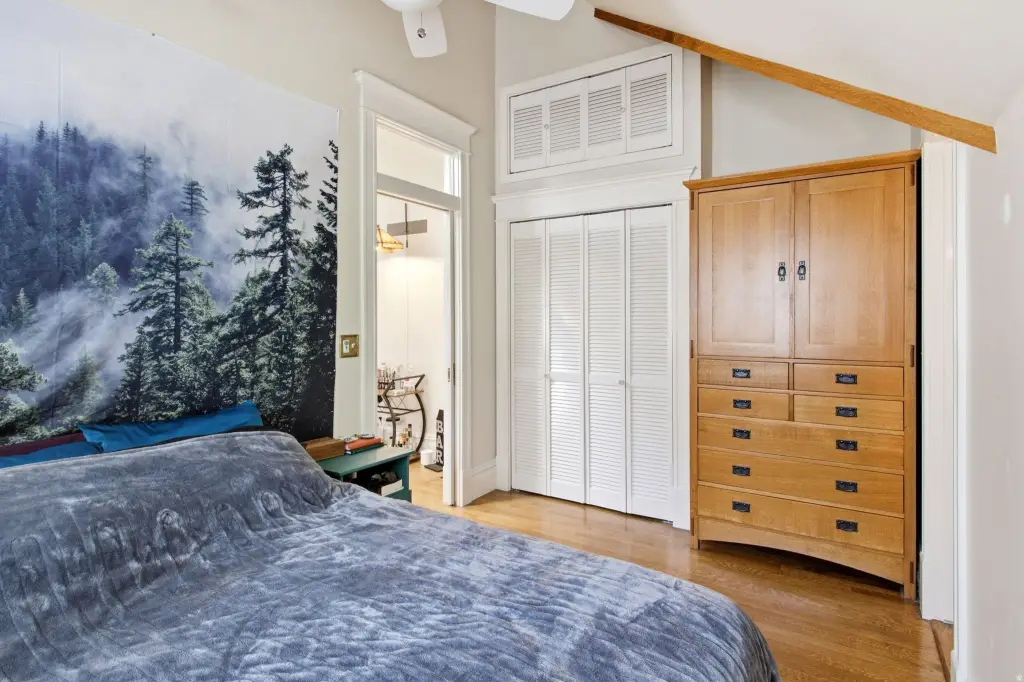
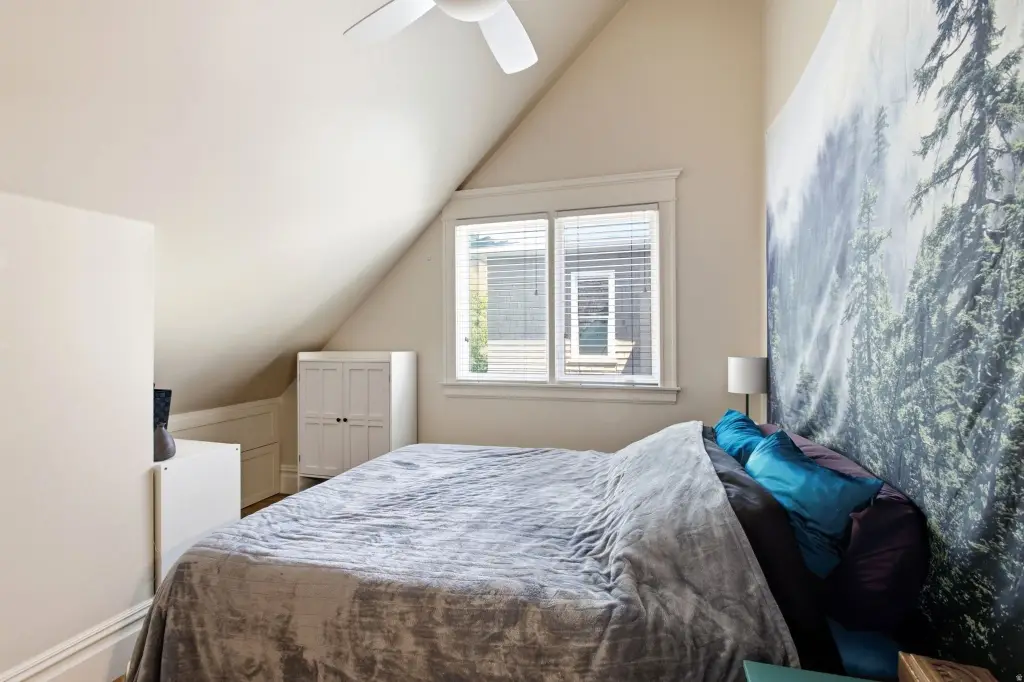
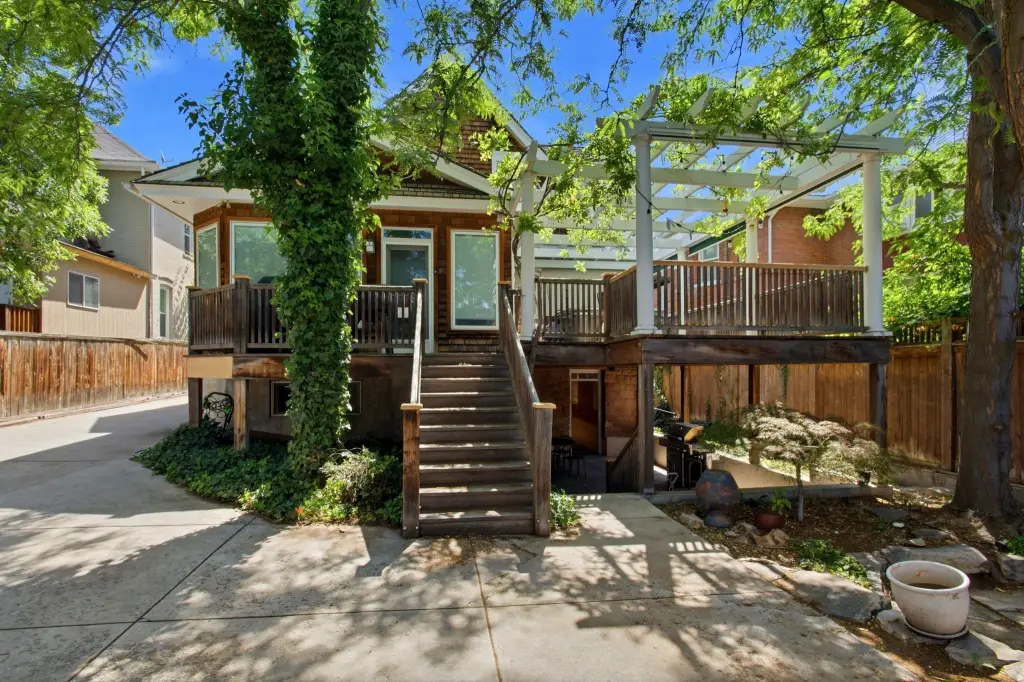
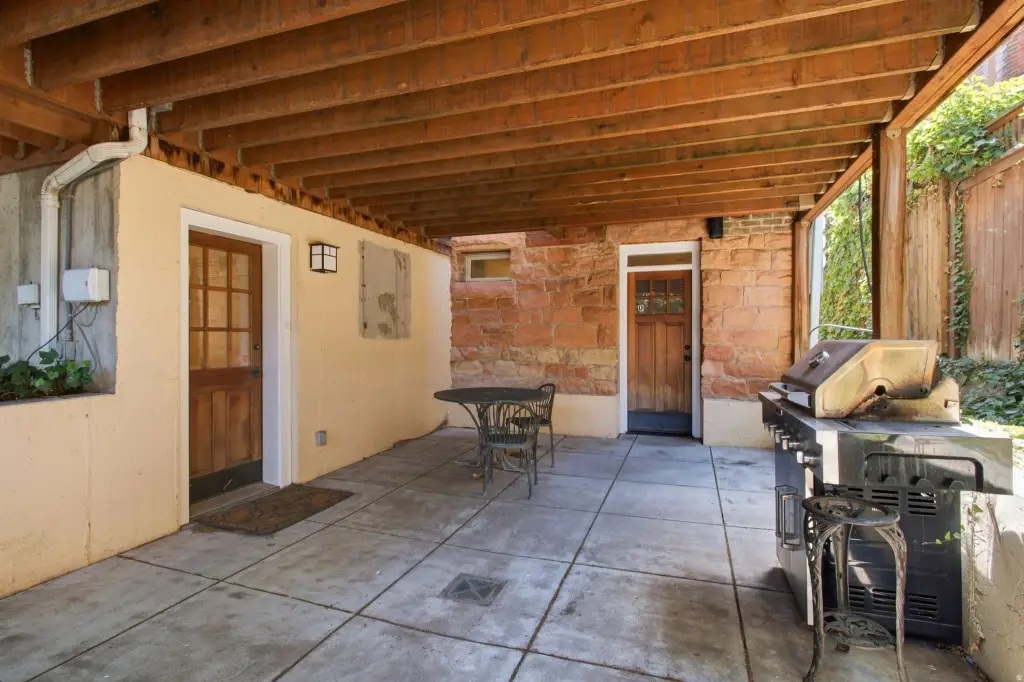
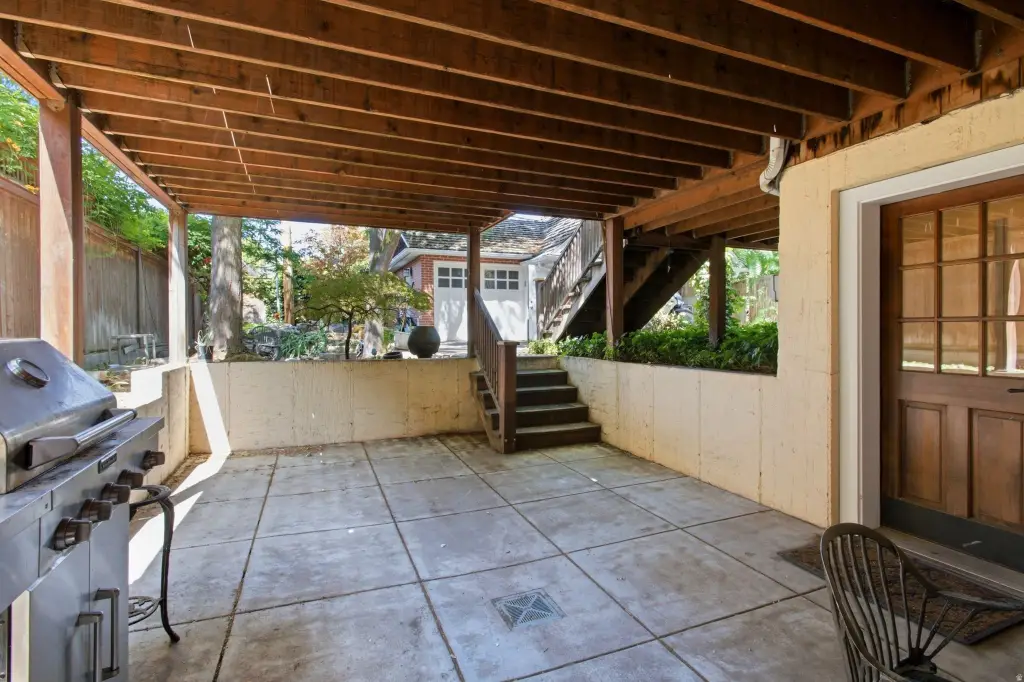
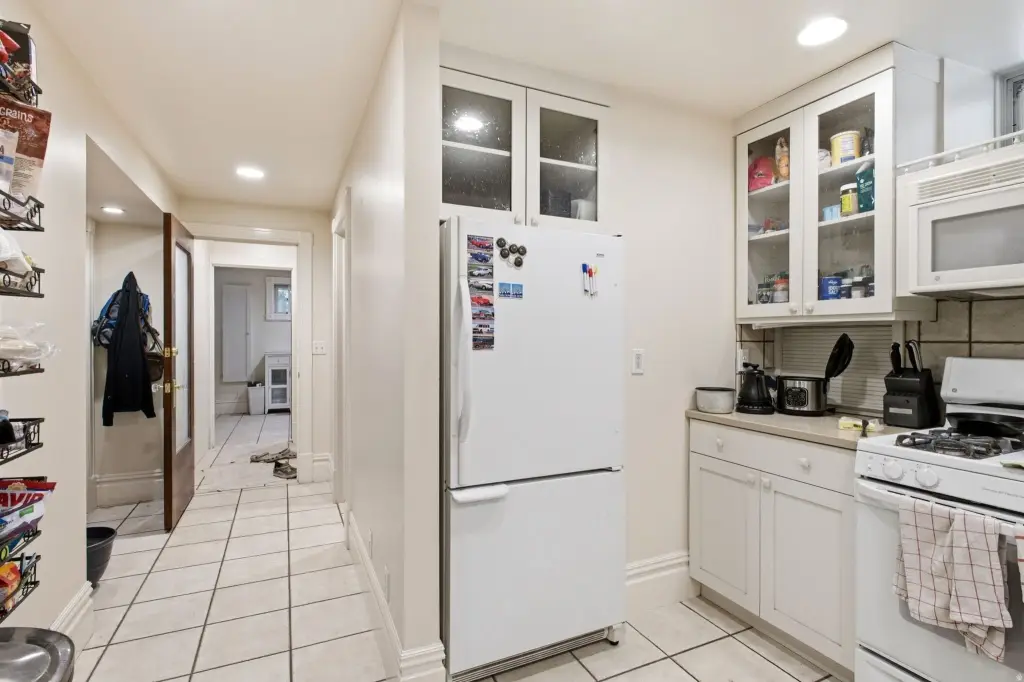
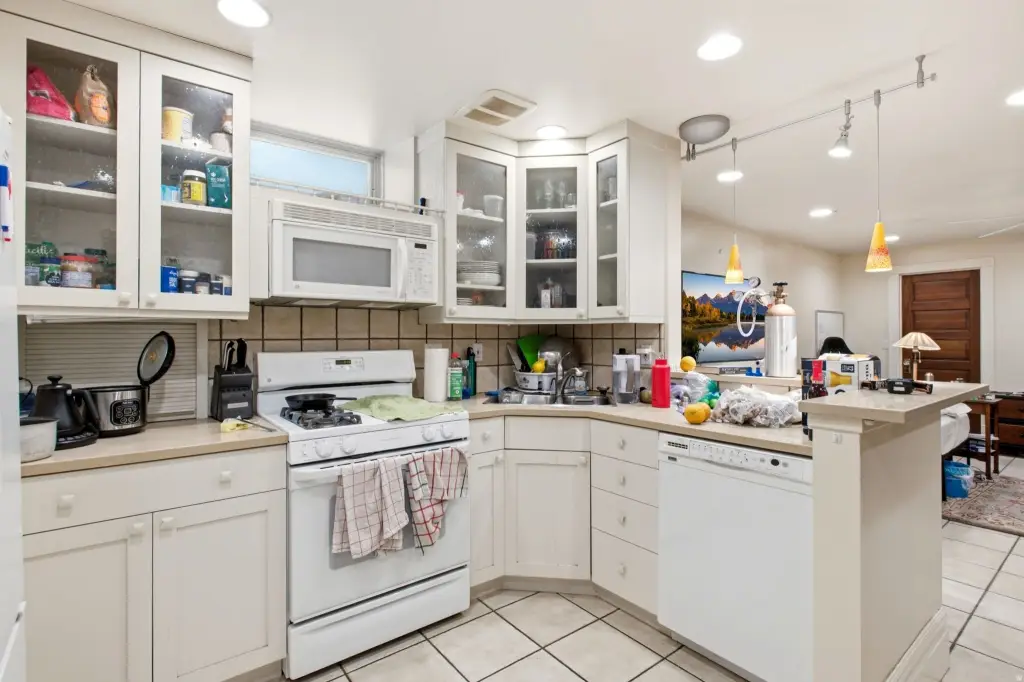
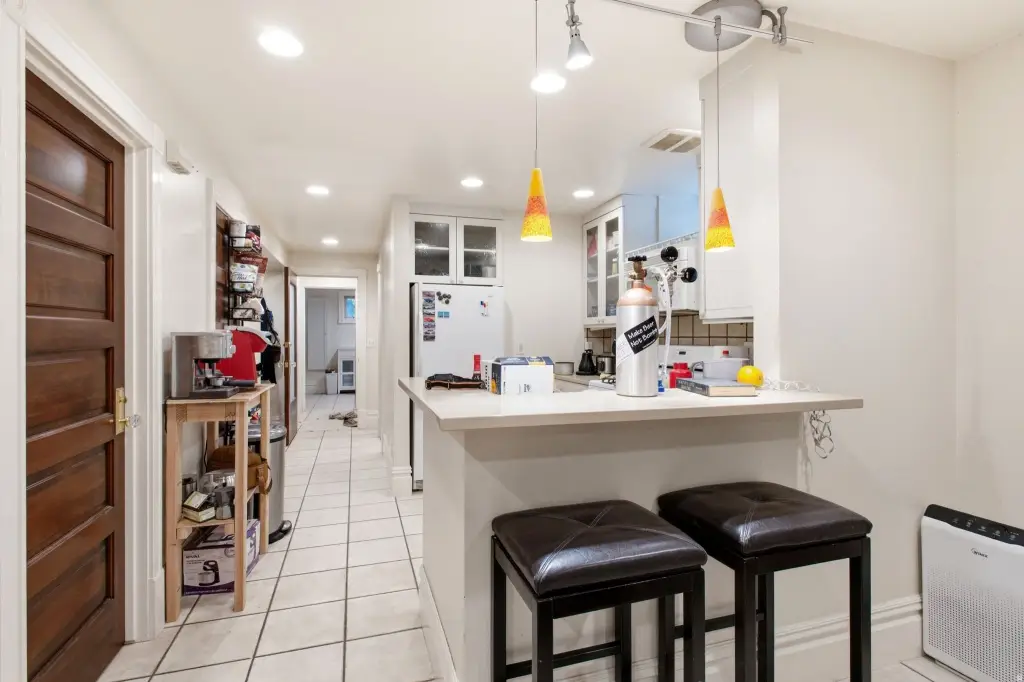
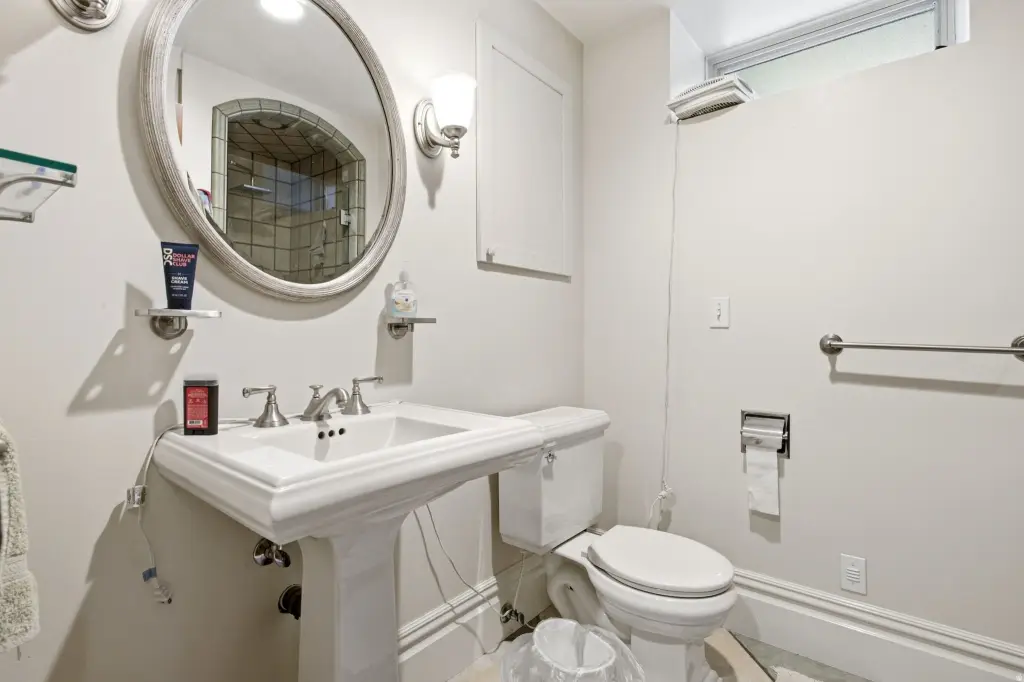
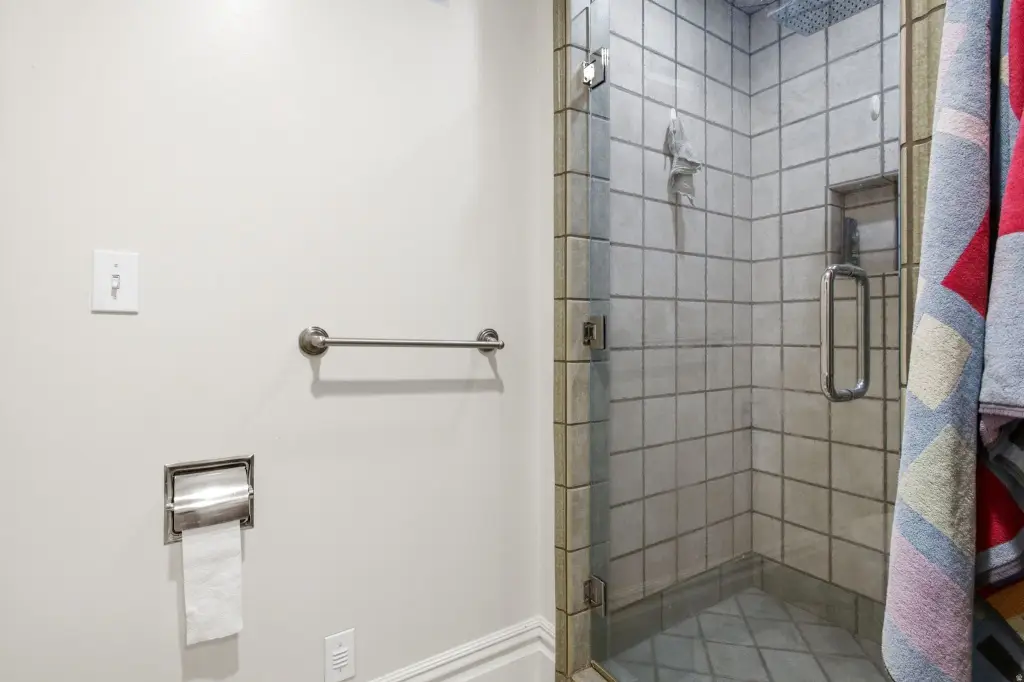
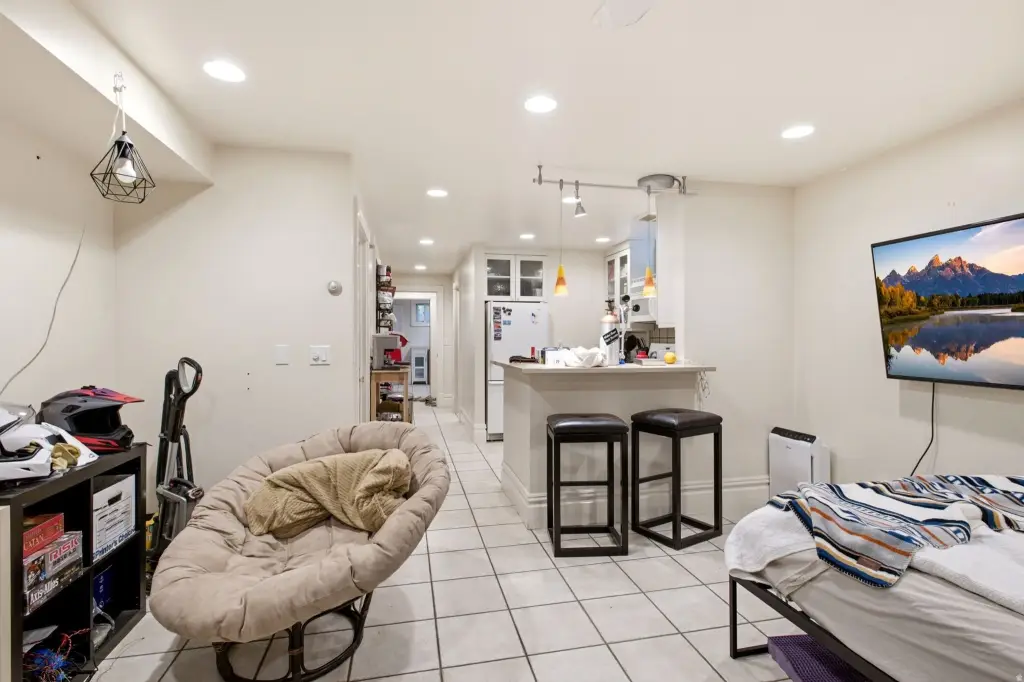
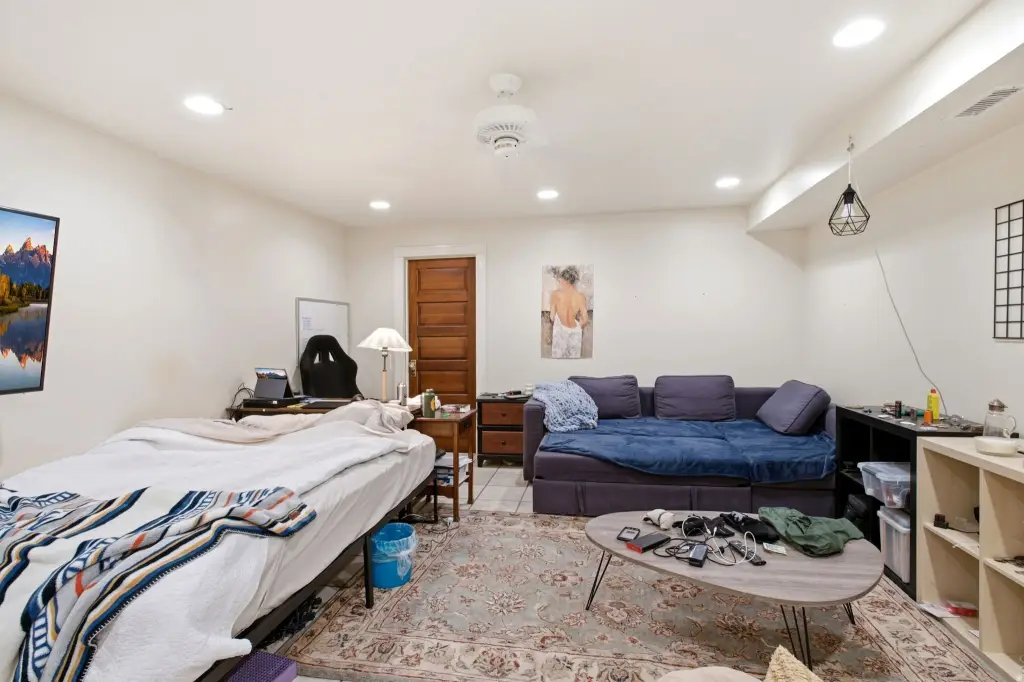
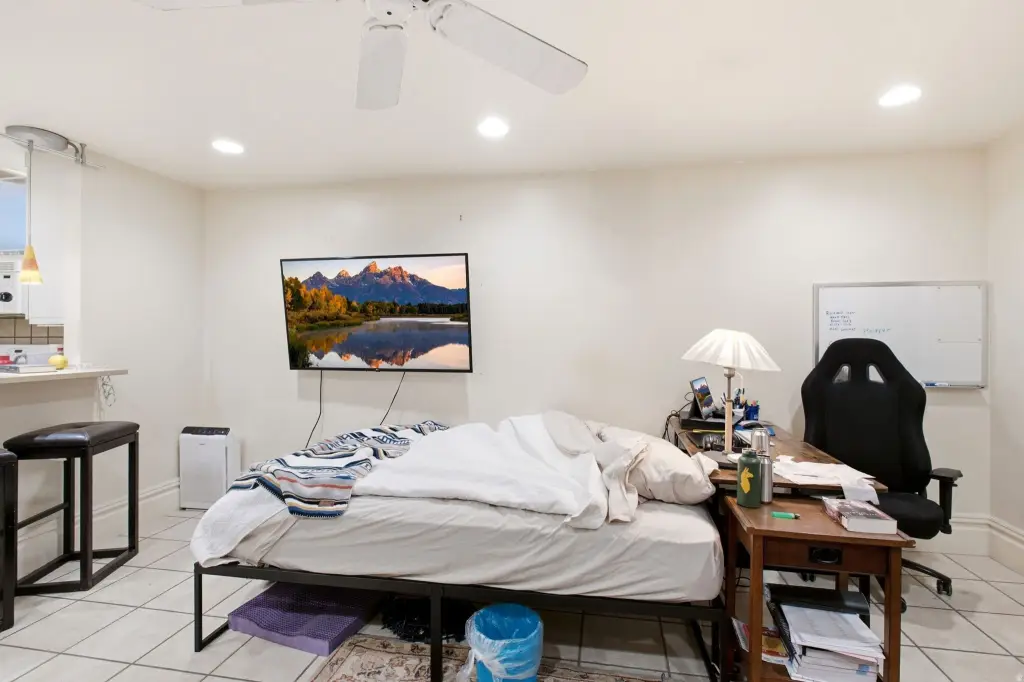
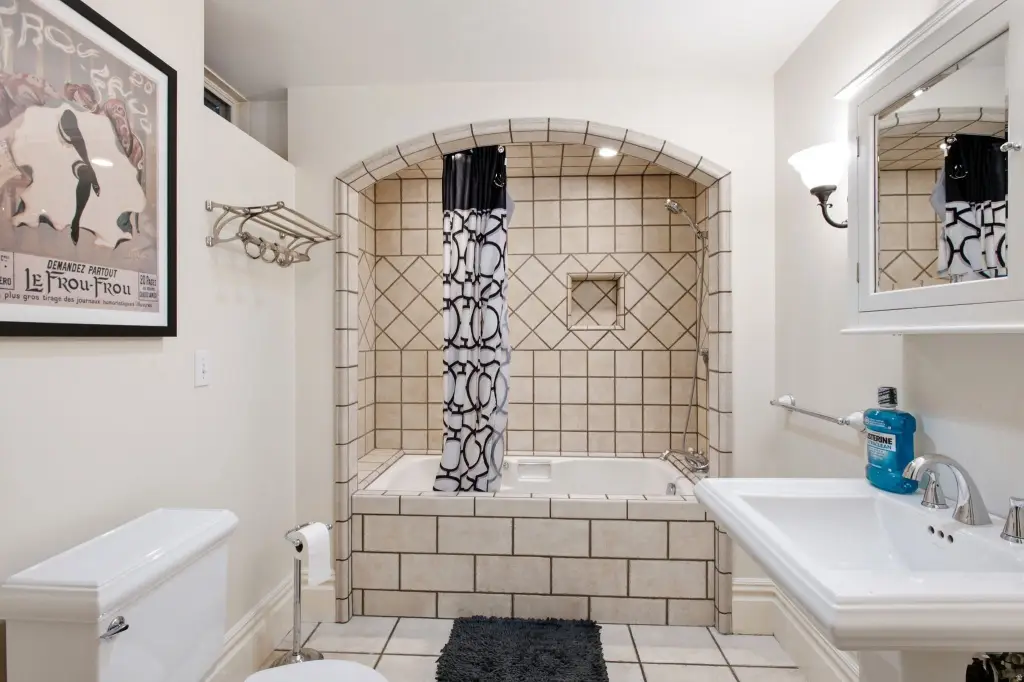
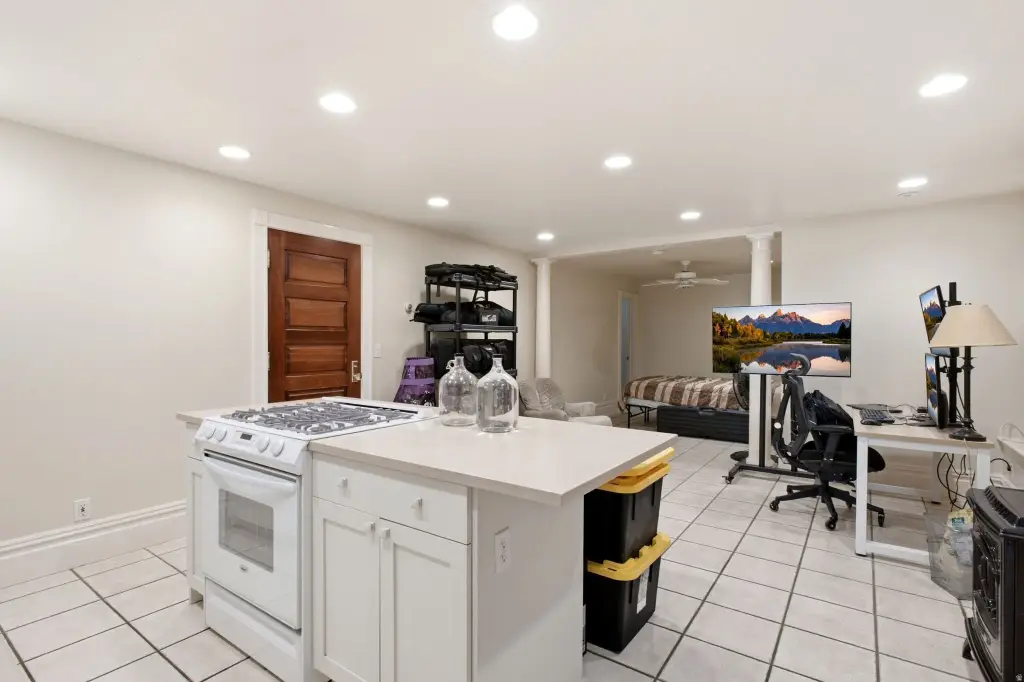
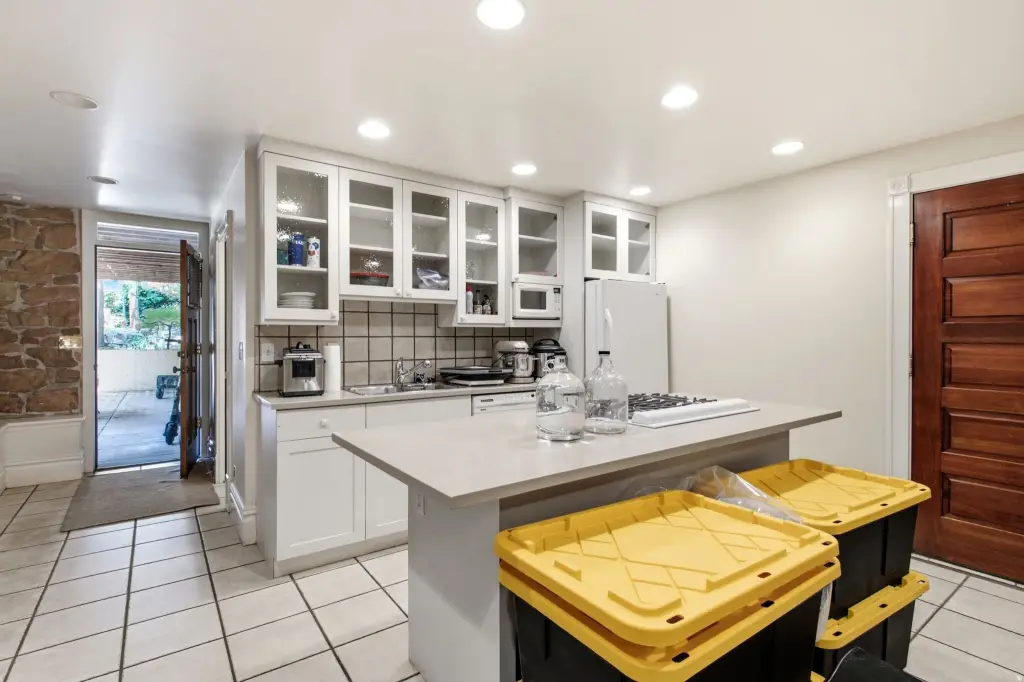
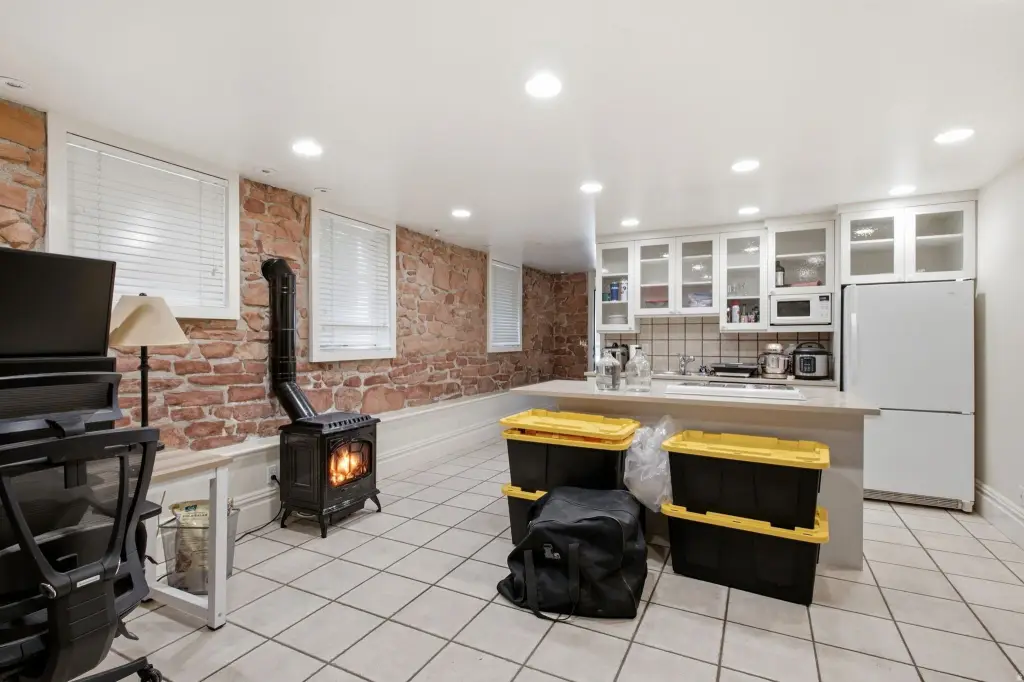
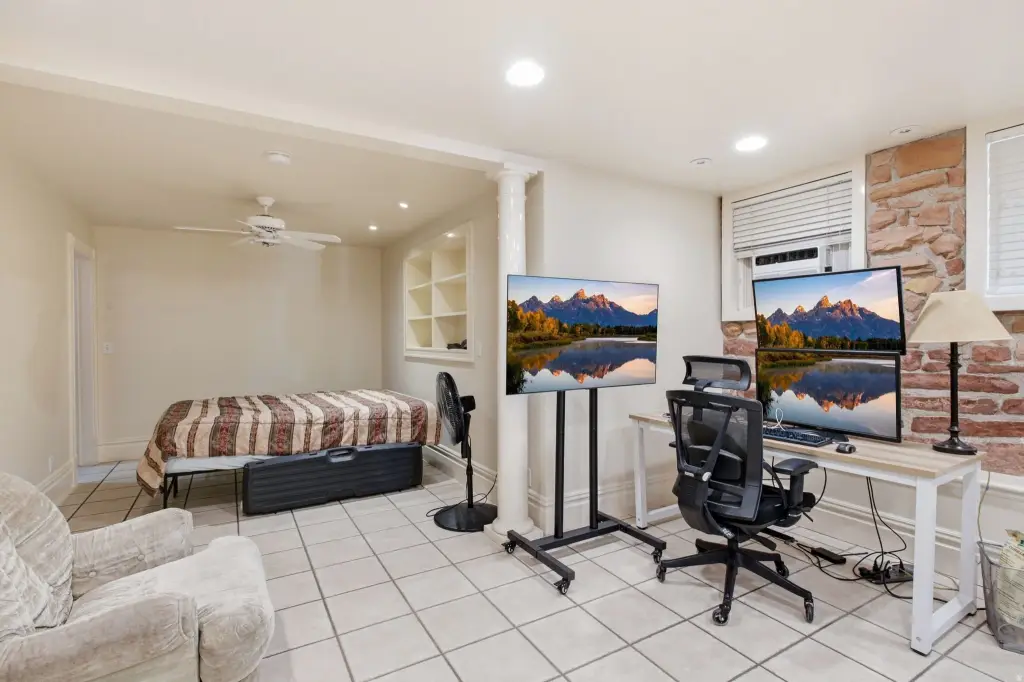
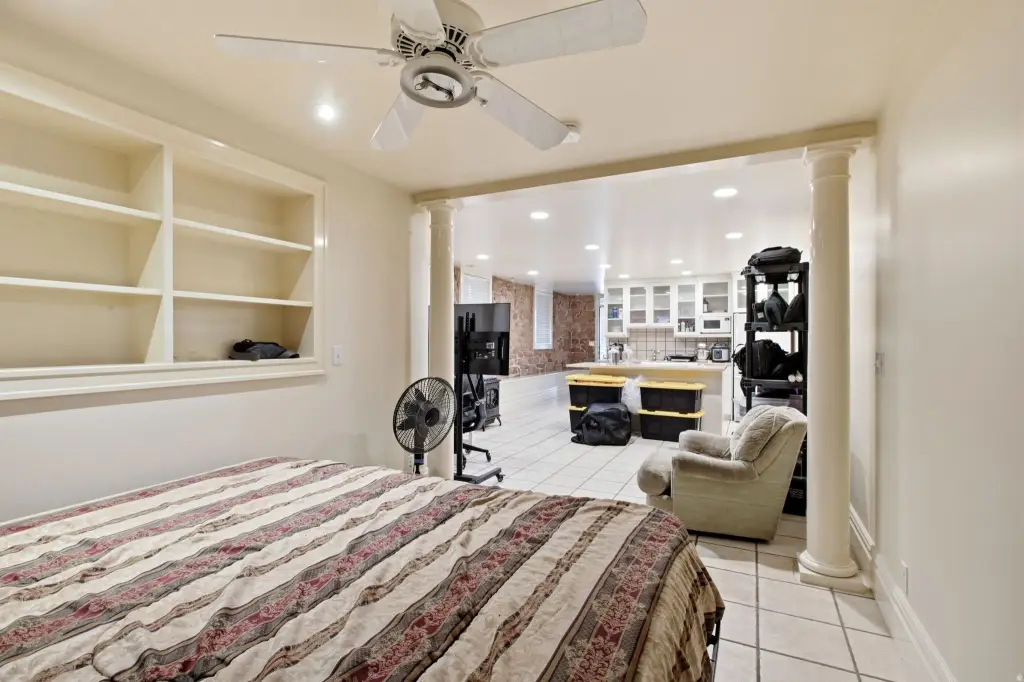
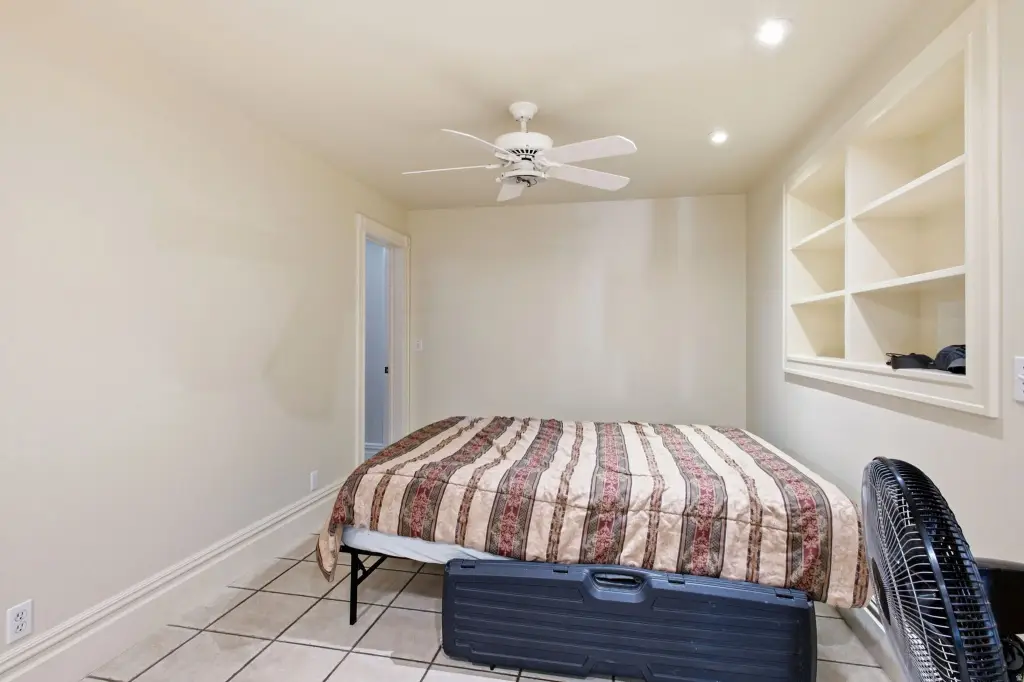
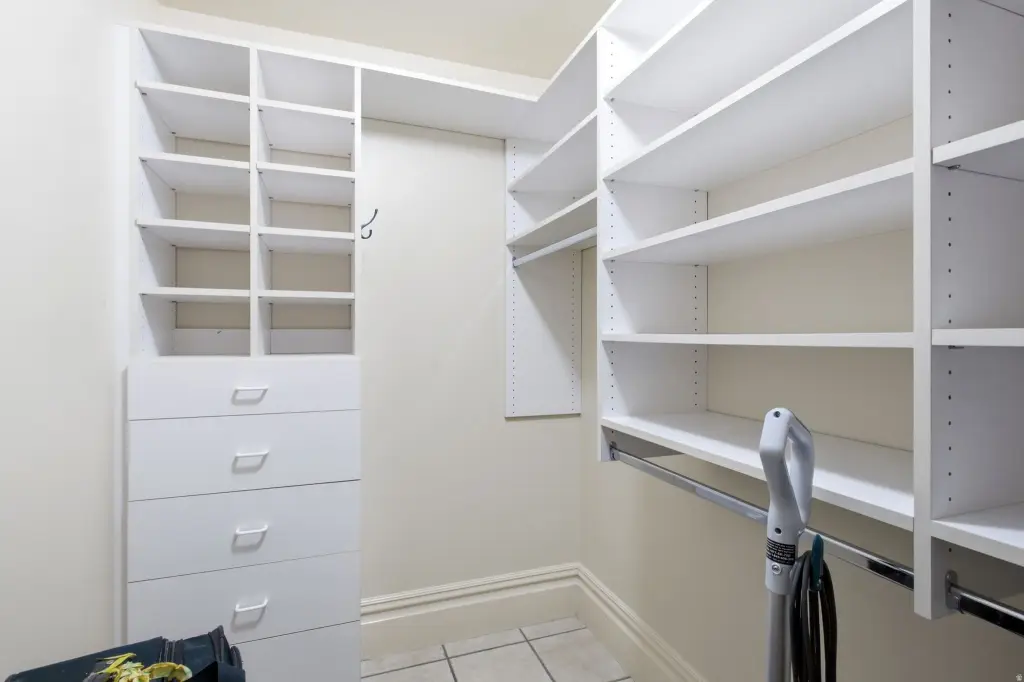
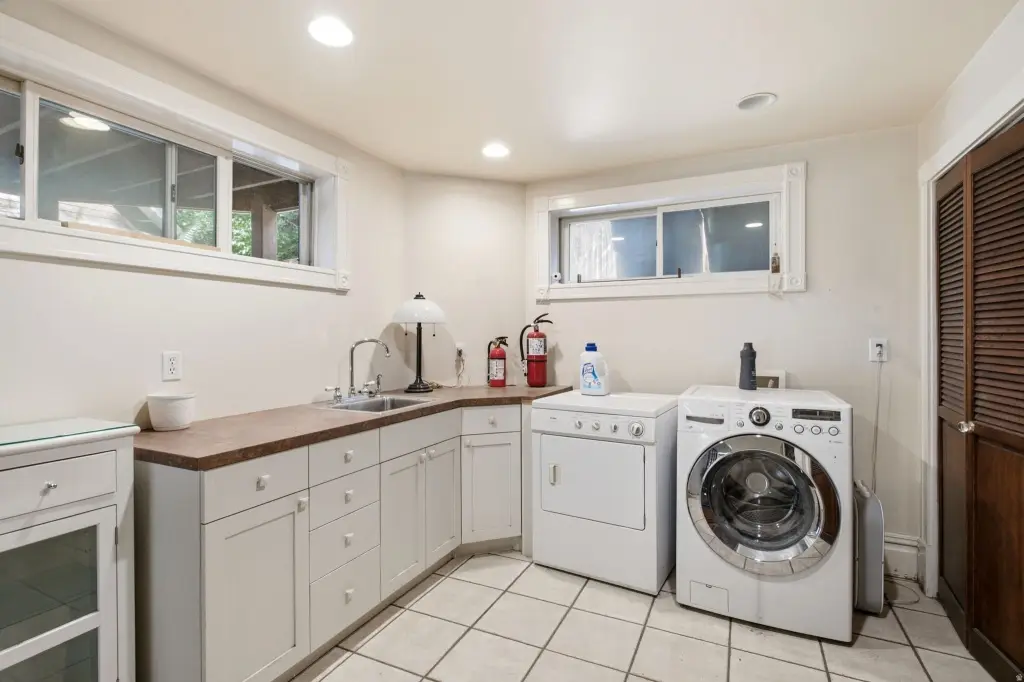
For Sale
$1,600,000
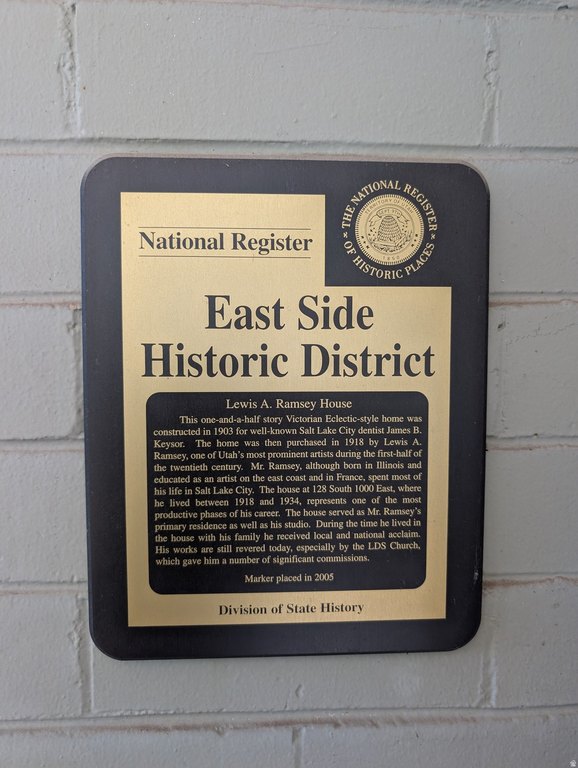
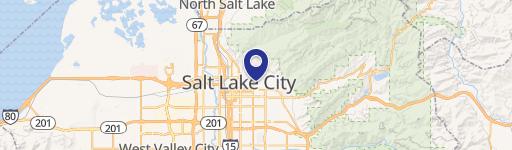
128 S 1000 E, Salt Lake City, UT 84102
Residential, Salt Lake City, UT
Property Size4,900 SF
Lot Size0.15 Acres
Price / SF$326.53
Days on Market108
Property Features for 128 S 1000 E
General Information
Property type
Residential Multi Family
Property subtype
Other
Zoning
Multi-Family
Zoning description
MF
Bedrooms
7
Bathrooms
5
Full bathrooms
5
Rooms
Bathroom 3, Bathroom 2, Bedroom 5, Bedroom 7, Bathroom 1, Bedroom 4, Bedroom 6, Bedroom 1, Bedroom 2, Bathroom 5, Bathroom 4, Bedroom 3
Parking
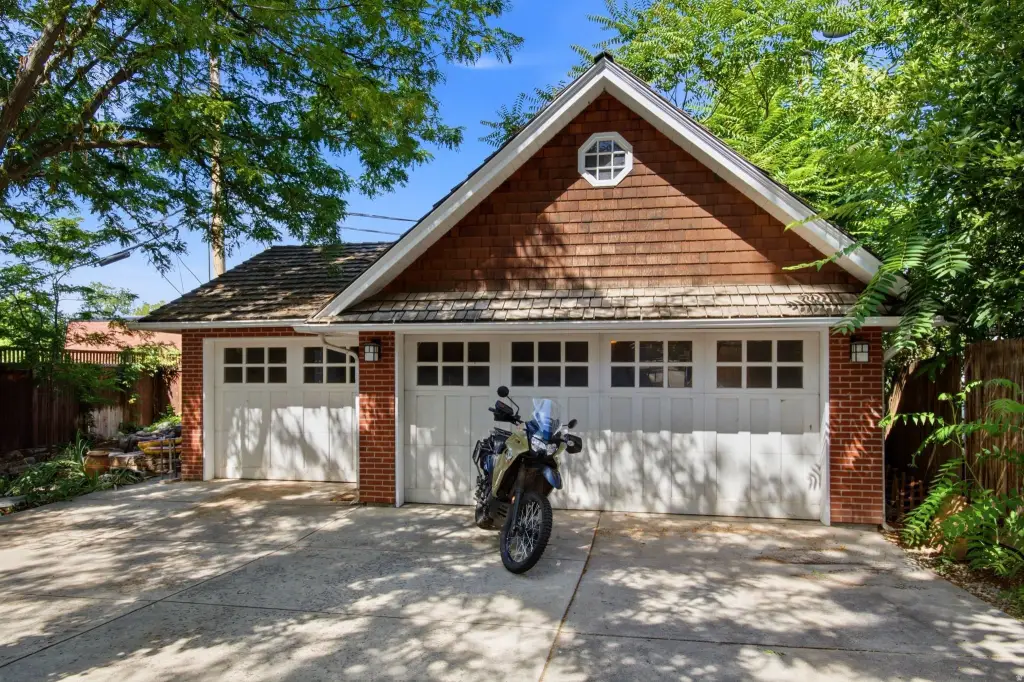
8
Parking features
Covered, Secured
Window features
Drapes, Blinds
Patio and Porch features
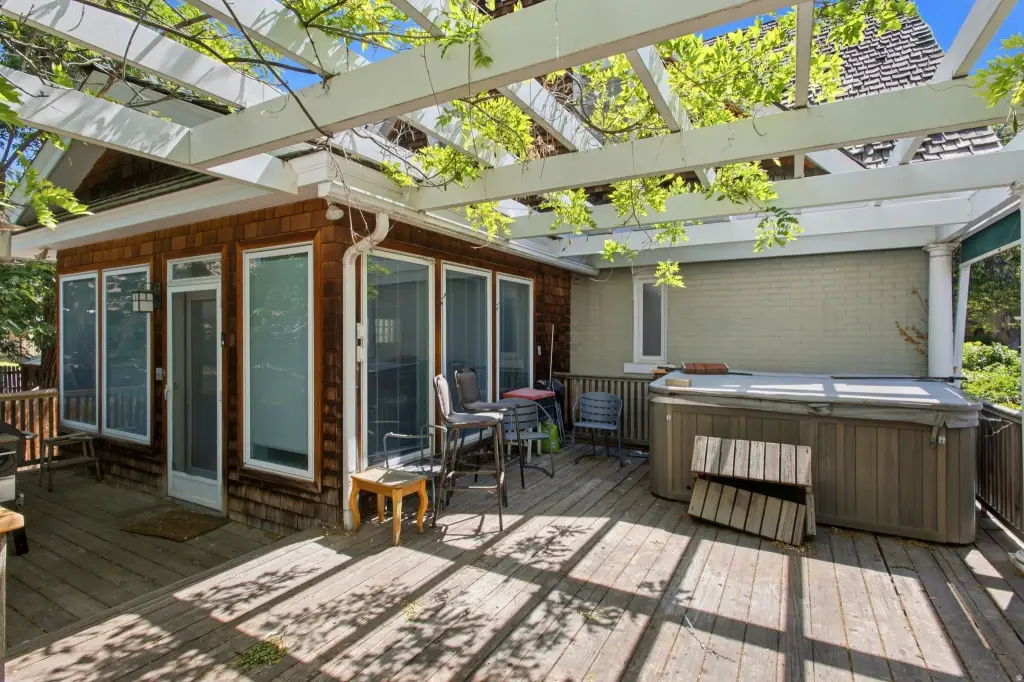
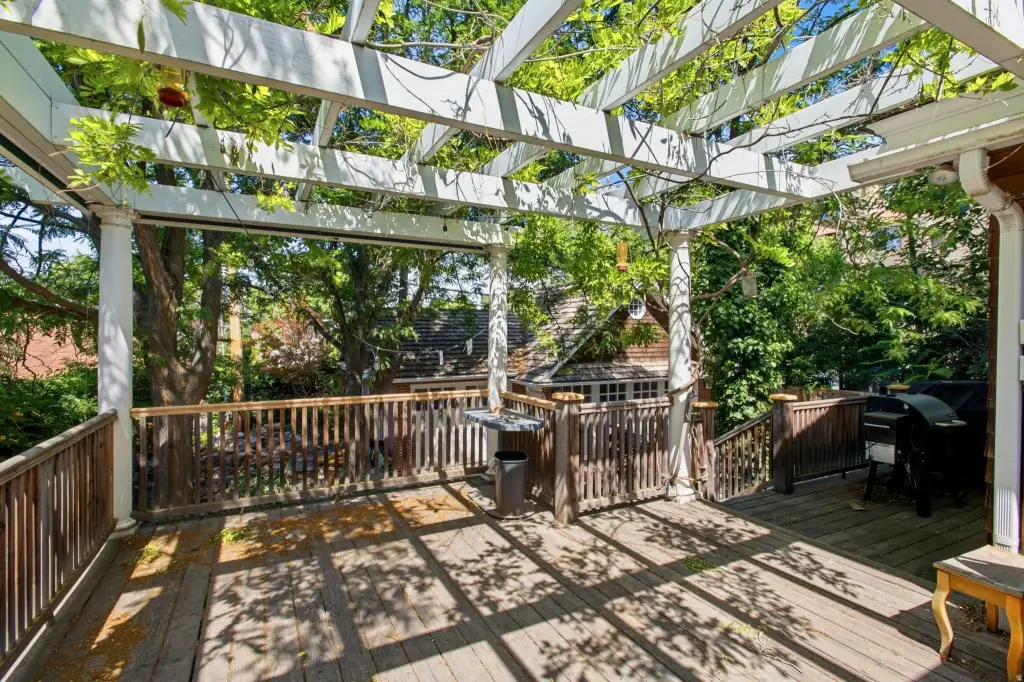
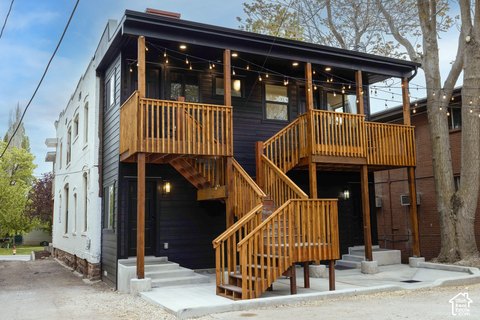
Patio, Deck
Interior features
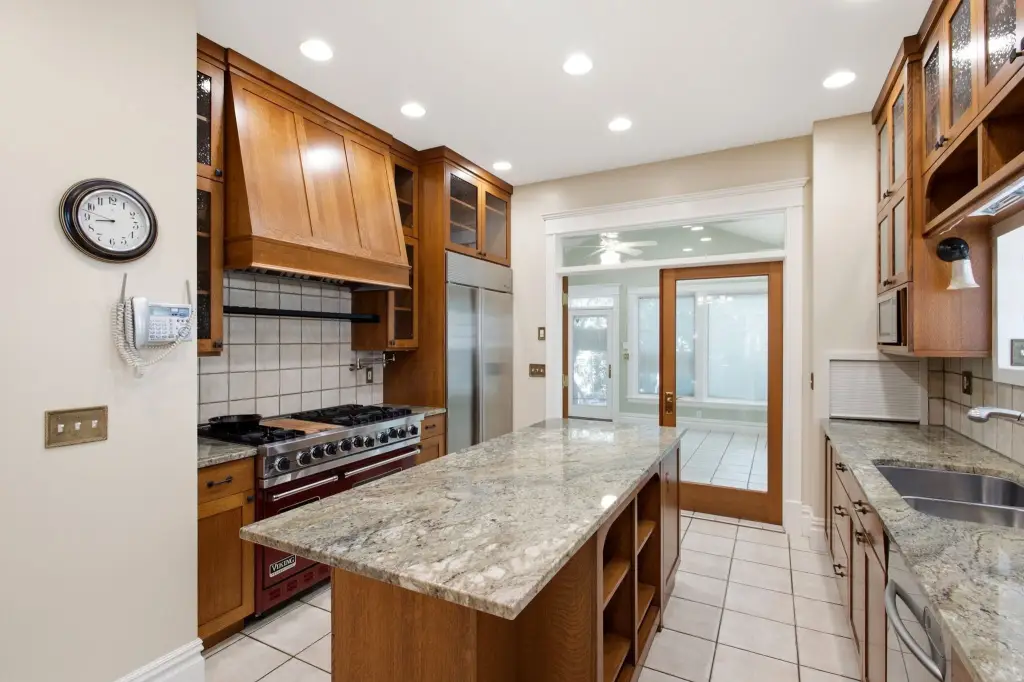
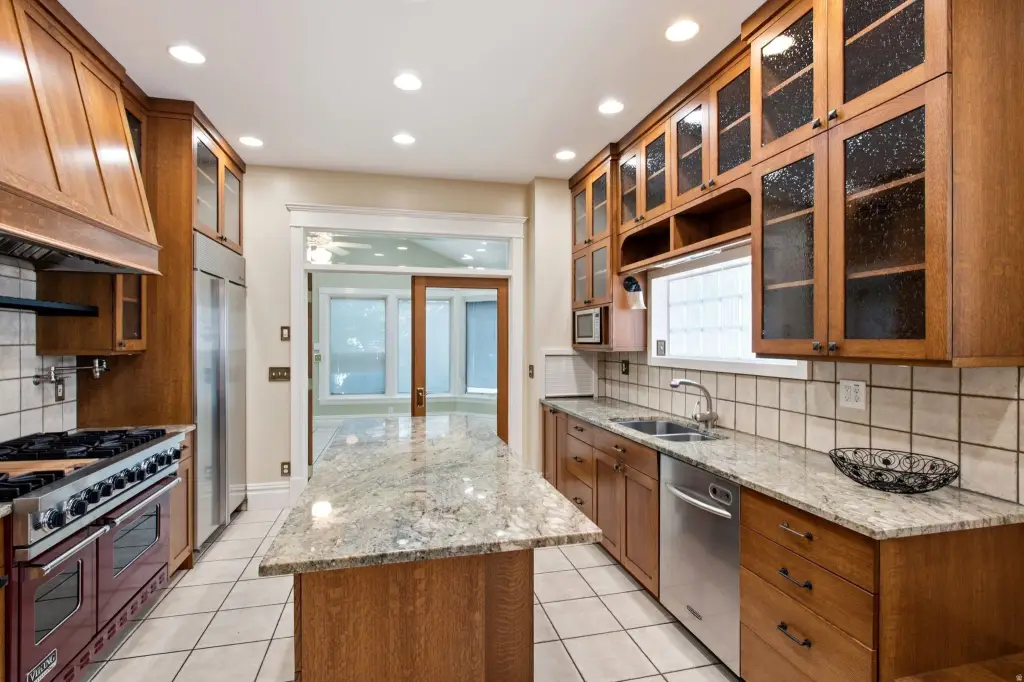
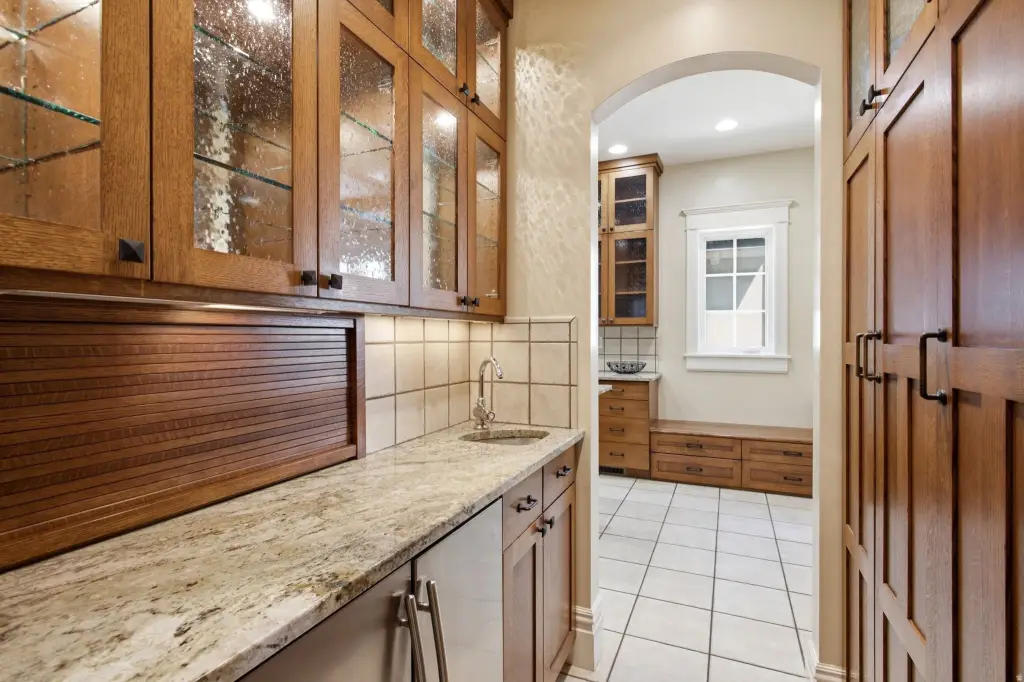
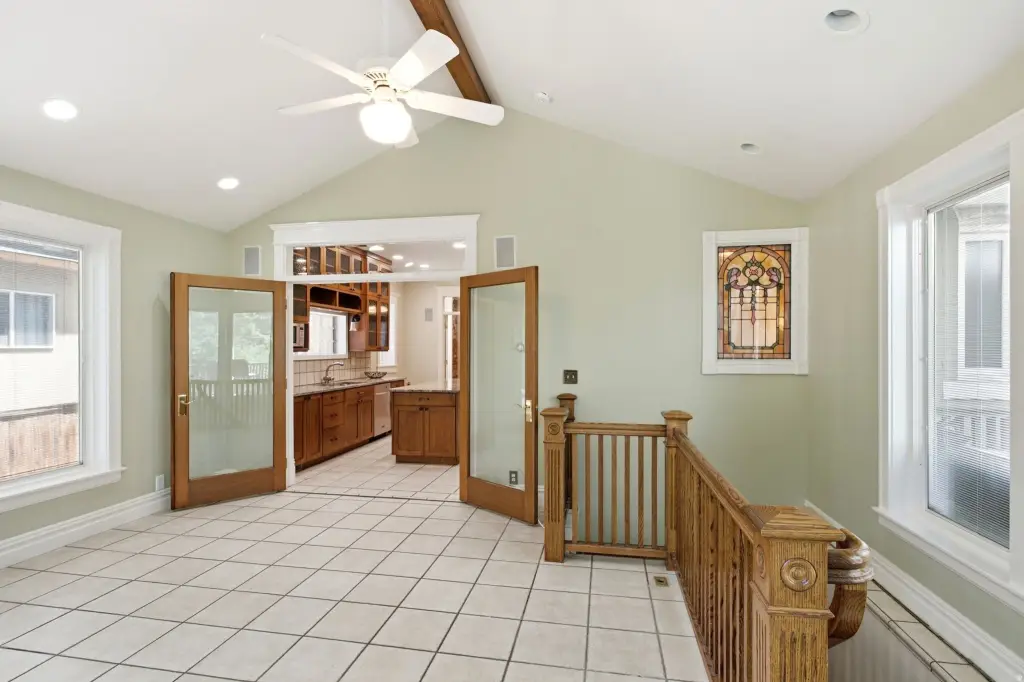
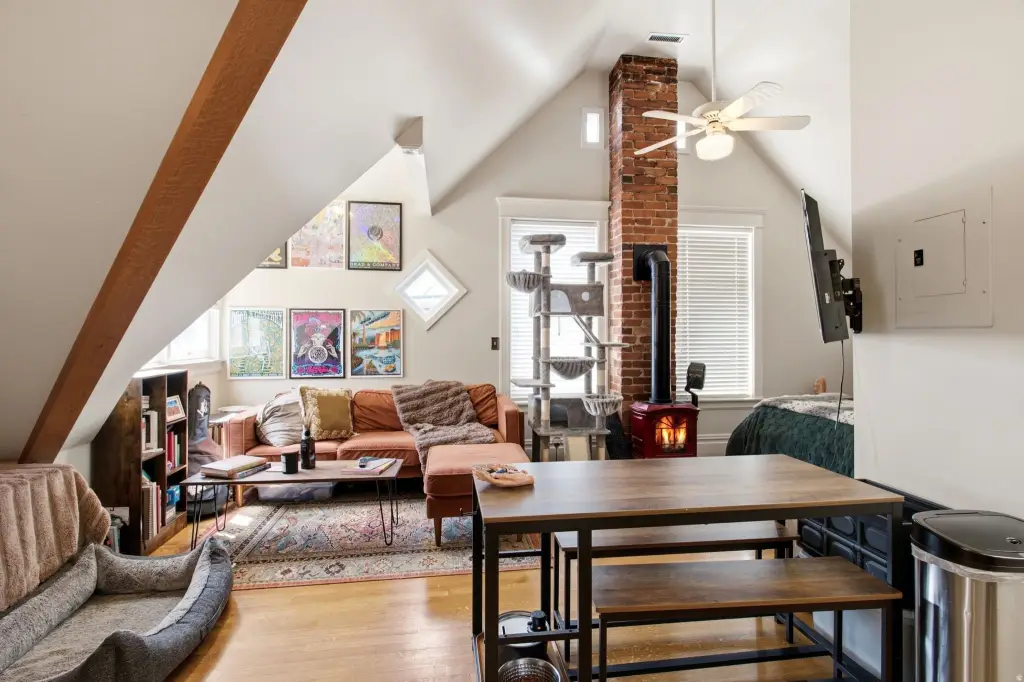
Bar: Wet, Disposal, Floor Drains, French Doors, Gas Log, Great Room, Jetted Tub, Kitchen: Updated, Oven: Double, Oven: Gas, Range: Countertop, Range: Down Vent, Range: Gas, Range/Oven: Built-In, Vaulted Ceilings, Granite Countertops, Dishwasher: Built-In
Exterior features
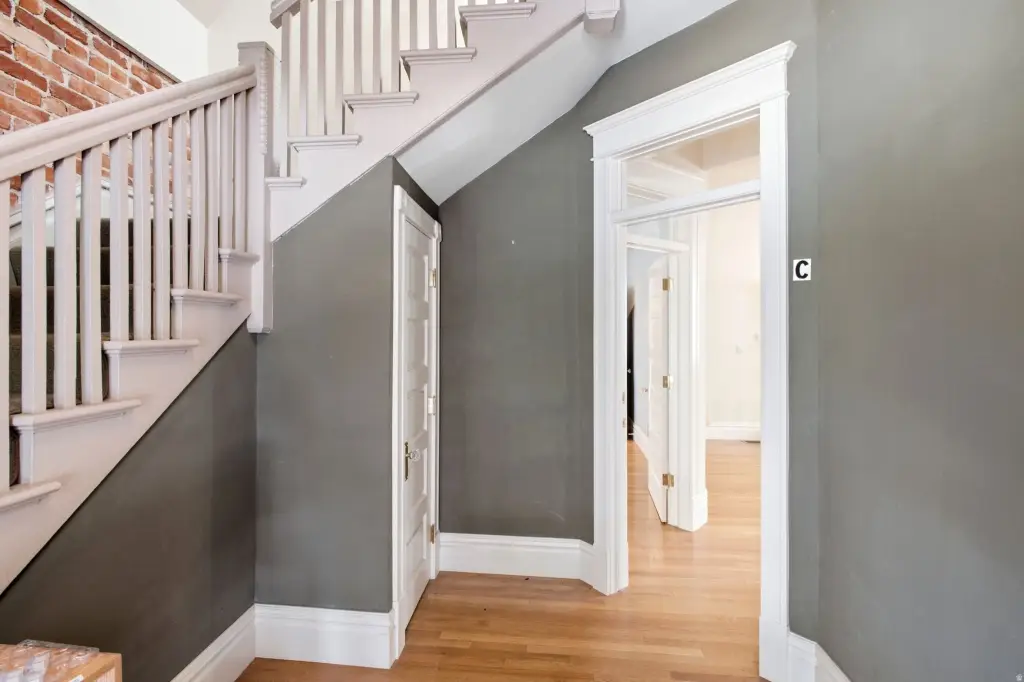
Awning(s), Balcony, Basement Entrance, Bay Box Windows, Deck; Covered, Double Pane Windows, Entry (Foyer), Out Buildings, Lighting, Patio: Covered, Secured Parking, Skylights, Stained Glass Windows, Walkout, Patio: Open
Fireplace
1
Lot features
Curb & Gutter, Fenced: Full, Road: Paved, Secluded, Sidewalks, Sprinkler: Auto- Full, View: Mountain
Elementary school
Wasatch
Middle school
Bryant
High school
East
Elementary school district
Salt Lake
Middle school district
Salt Lake
High school district
Salt Lake
Subdivision
Salt Lake City; So. Salt Lake
Standard status
Active
APN
16-05-135-017
Size
4,900 SF
Lot size
0.15 Acres
Taxes and HOA fees
Tax Annual Amount
7984
Utilities
Sewer type
Public Sewer
Heating system
Radiant, Forced Air, Radiant Floor, Natural Gas
Building Details
Year built
1910
Number of units
5
Flooring type
Hardwood, Tile
Building materials
Brick, Cedar, Stone
Roof type
Wood
Architectural style
Other
Additional Structures
Workshop
Listing Agency:
Rum Real Estate
(801) 449-0119
Listed By:
Curtis Rumel
(801) 790-4030
Added: Jul 2
Changed: Sep 18
Last Checked: Oct 17 at 1:06AM
MLS# 2169501
Copyright © 2026 UtahRealEstate.com. All rights reserved. All information provided by the listing agent/broker is deemed reliable but is not guaranteed and should be independently verified.

Ask AI about this property
Review the available facts, identify missing information and prepare questions for the agent.
Investment Insights
Based on property information with market context.
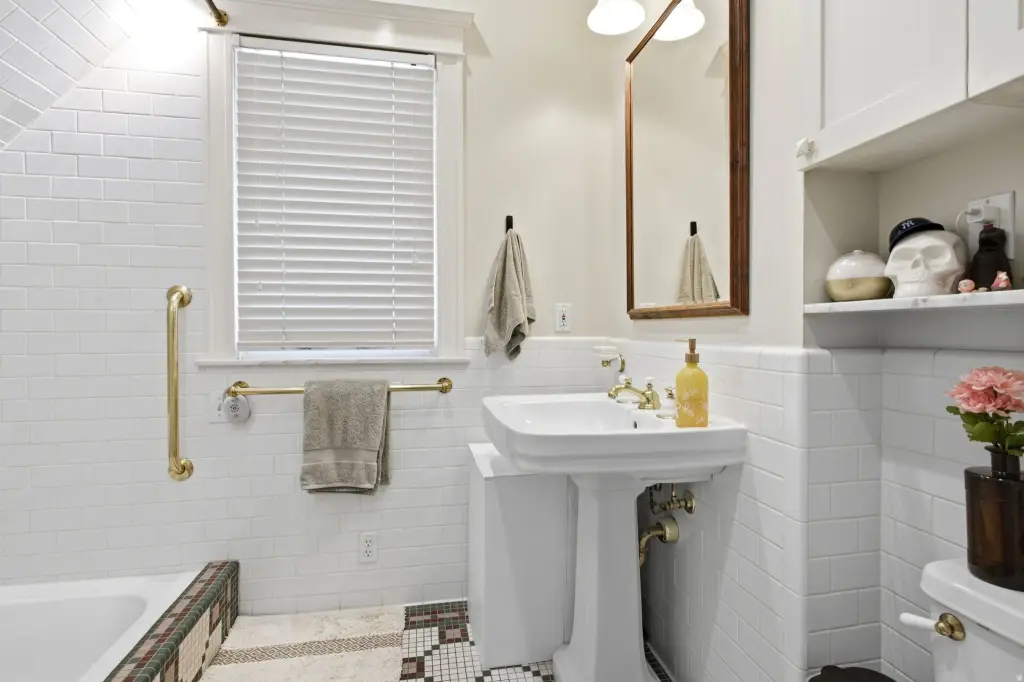
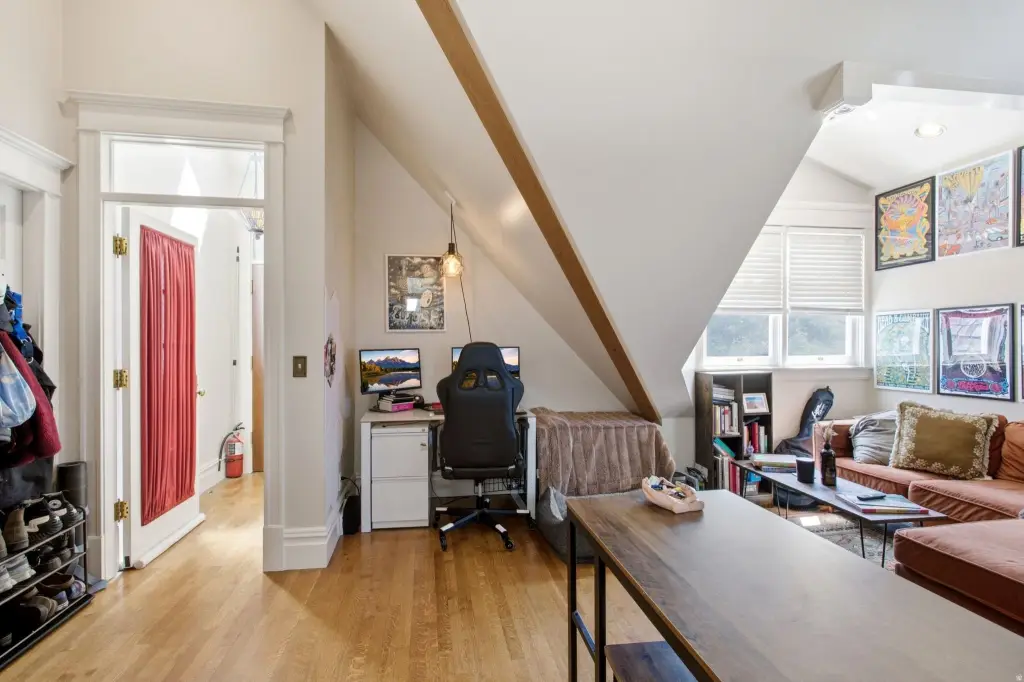
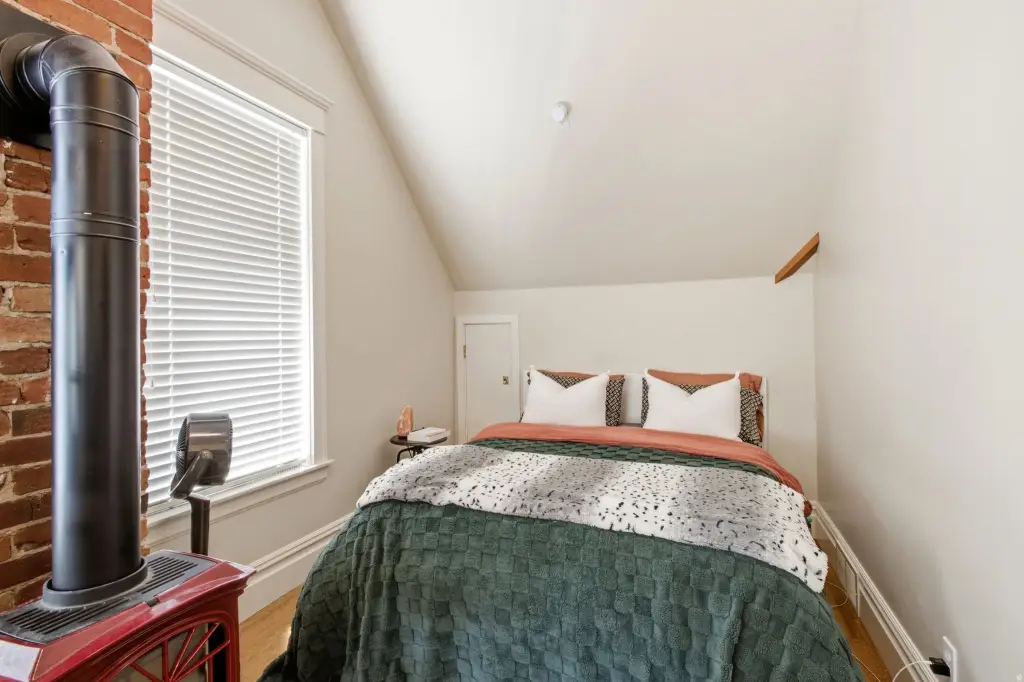
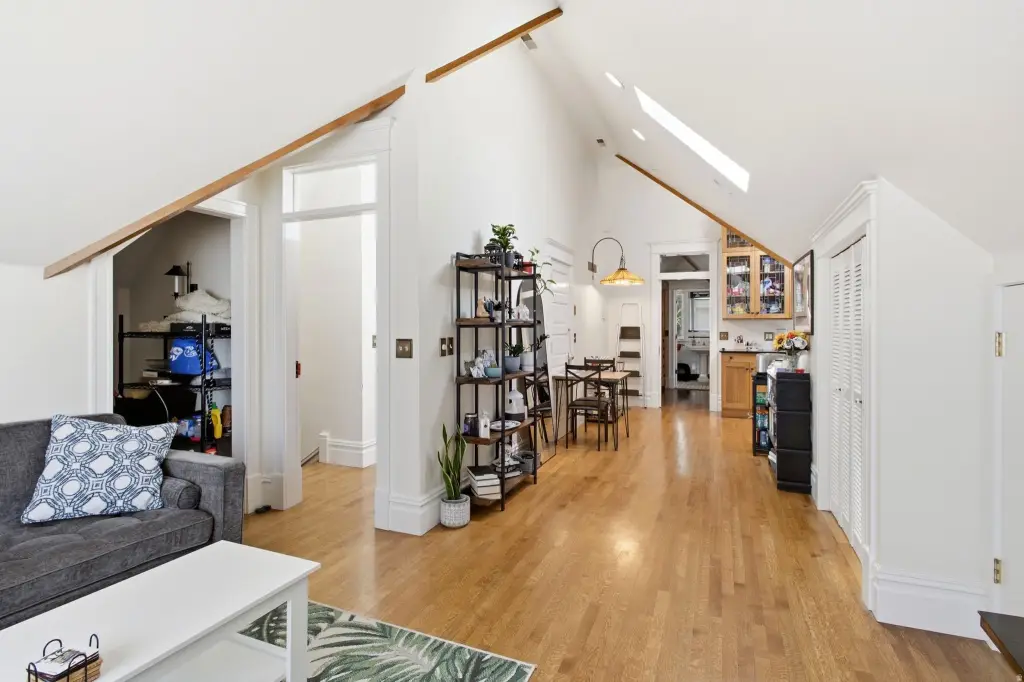
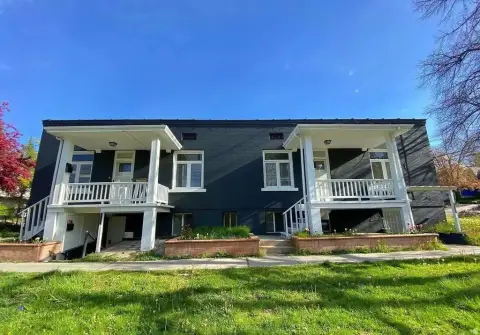
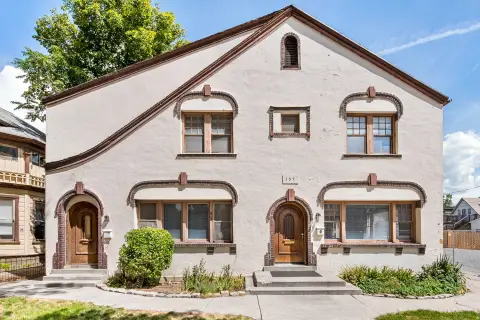
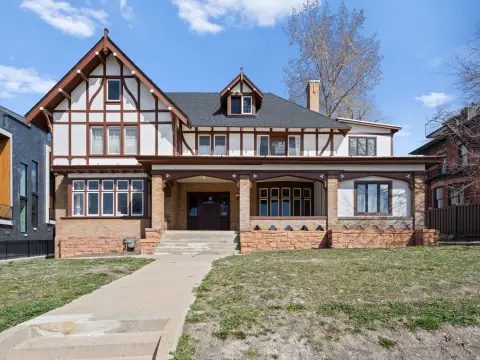
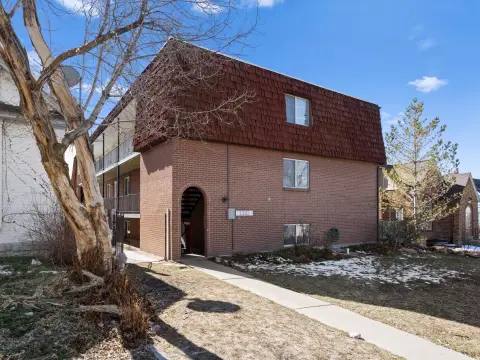
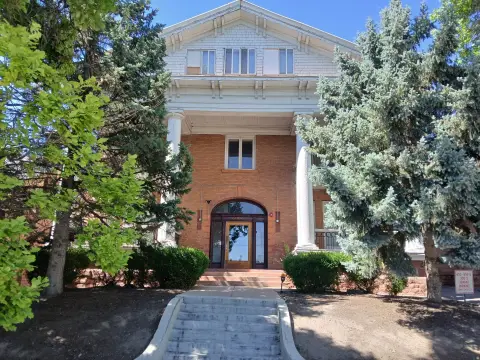
Built in 1910, this 4,900-square-foot apartment property occupies 0.15 acres and is configured as a five-unit building. The structure combines brick, cedar, and stone construction with hardwood and tile flooring, wood roofing, and a mix of natural gas radiant, radiant-floor, and forced-air heating. Interior features include an updated kitchen, granite countertops, a wet bar, vaulted ceilings, French doors, built-in appliances, and multiple bathrooms. A fireplace, jetted tub, skylights, stained glass windows, bay box windows, and a walkout add further detail to the improvements.
Exterior amenities include balconies, covered and open patios, a deck, awnings, an exterior basement entrance, outbuildings, and secured covered parking. The property has public sewer service and is zoned Multi-Family. Located at 128 S 1000 E in Salt Lake City, the asset offers a distinctive residential building with established interior and exterior features.
Exterior amenities include balconies, covered and open patios, a deck, awnings, an exterior basement entrance, outbuildings, and secured covered parking. The property has public sewer service and is zoned Multi-Family. Located at 128 S 1000 E in Salt Lake City, the asset offers a distinctive residential building with established interior and exterior features.
Key Highlights
- 5‑unit apartment property with 4,900 square feet of building area
- 0.15‑acre site with Multi‑Family zoning
- Originally constructed in 1910
Financial Insights
Estimated NOI and Cap Rate
NOI / Yr
$60,703
Cap Rate
3.79%
Suggested Prices Based on Cap Rates
Cap Rate 5%
$1,214,060
$1.2M
Cap Rate 7%
$867,186
$867.2K
Cap Rate 9%
$674,478
$674.5K
Market Conditions
NOI Build-Up for 4,900 SF
Gross rent
$116.4K $23.76/SF
− Vacancy
−$6.1K −$1.24/SF
EGI
$110.4K $22.52/SF
− OpEx
−$49.7K −$10.14/SF
NOI
$60.7K $12.39/SF
Area
Salt Lake City, UT
Vacancy
5.20%
Lease Rate
$23.76 /SF/Yr
Expense Ratio
45.00%
Simulate Cap Rate and NOI
Suggested Prices Based on Cap Rates
Cap Rate 5%
$1,214,060
Cap Rate 7%
$867,186
Cap Rate 9%
$674,478
Alternative Uses
Best Use
Apartment 5plus
$867.2K
$758.8K – $1.01M
NOI $60,703 @ 7.0% cap · market cap 3.79%
Second Best
—
—
no second resolved use
Theoretical Best
Office A
$1.32M
$1.16M – $1.54M
NOI $92,409 @ 7.0% cap · market cap 5.78%
Zoning and permitted uses should be independently verified with authorities.
How Realmo checks its estimates
Property Analytics
Unlock full access to Insights
Subscribe to Realmo Intelligence
Open Analytics
Current Use
Lease Details
5
Residential units
Location Intelligence
Trade Area within ½ mile
2,031
Businesses Nearby
Explore this area
Business Placement
Demographics for 84102, UT
18,857
Population
11,348
Households
1.7
Avg Household Size
29
Median Age
56%
College-Educated
94%
High-School Grad
1.9 sq mi
ZIP Area
9,925
Density / Sq Mi
$50,040
Median Household Income
$32,432
Median Earnings
$1,305
Median Rent
$487,200
Median Home Value
Check the figures for this property
Cap Rate, Value Estimation, Potential NOI and more
View Realmo Analytics
Market
Vacancy Rate% for Multifamily in West region




Frequently Asked Questions
What type of property is this?
Apartment building - Multi-Family zoning supports the property’s residential apartment configuration with secured covered parking.
Where is this apartment building located?
The property is located at 128 S 1000 E Salt Lake City, UT.
What is the asking price?
The asking price for this property is $1,600,000.
What are key features of this property?
This property features: 5‑unit apartment property with 4,900 square feet of building area; 0.15‑acre site with Multi‑Family zoning; Originally constructed in 1910


