Remodeled Office Space For
For Sale
$424,500
12724 SE STARK #68&69 P, Portland, OR 97233
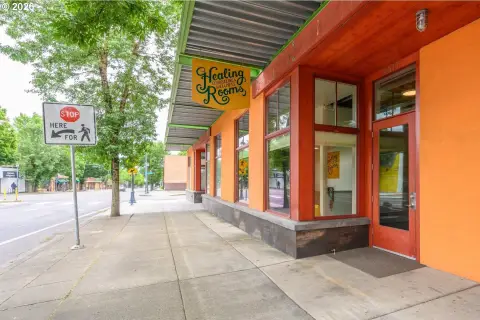
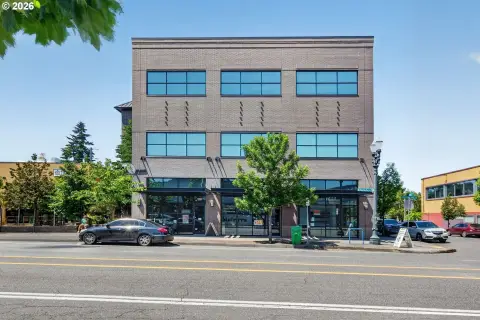
Recently remodeled office condominium, ideal for owner-occupiers or investors.
Property Size1,550 SF
Price / SF$273.87
Days on Market474
Property Features for 12724 SE STARK #68&69 P
General Information
Standard status
Active
Size
1,550 SF
Property subtype
Commercial
Taxes and HOA fees
Annual Taxes
$4,534
Amenities
Central air
Central Air Cooling
Fiberglass Roof
Forced Air Heating
On Site
Paved
Shingle Roof
Building Details
Year Built
1981
Listing Agency:
JIM KUNKEL REALTY
(503) 252-1166
Listed By:
LANCE KUNKEL
(503) 260-8906
Source:
Corcoran
Added: Jun 23, 2025
Changed: Sep 13
Last Checked: Oct 7 at 12:36PM
Displayed information is deemed reliable but is not guaranteed and should be independently verified. All listing content including descriptions, pricing, images are the copyrighted material of JIM KUNKEL REALTY
Investment Insights
Based on property information with market context.
This commercial office space presents an opportunity for ownership within an office condominium complex. The property has been recently remodeled with new paint, floor coverings, and window blinds. The office is part of a well-established and managed HOA, which covers garbage, sewer, water, exterior maintenance (including roofing), grounds keeping, and complex management. HOA dues are currently $695 per month, with additional signage space available on Stark Street for $75 per month. The 1550 square foot office space can be subdivided into two separate units, one 500 sq ft and the other 1,050 sq ft, each with independent entrance doors and bathroom facilities, allowing for separate ownership and leasing. Ample parking is available around the centrally located office. This property is for sale, the business currently located at the site is not for sale as part of this transaction.
Key Highlights
- Opportunity to own commercial office space and build equity instead of renting.
- Can be subdivided into two separate leasable units (500 sq ft and 1,050 sq ft) with independent entrances and bathrooms.
- Recently remodeled with new paint, floor coverings, and window blinds.
Financial Insights
Estimated NOI and Cap Rate
NOI / Yr
$20,064
Cap Rate
4.73%
Suggested Prices Based on Cap Rates
Cap Rate 5%
$401,280
$401.3K
Cap Rate 7%
$286,629
$286.6K
Cap Rate 9%
$222,933
$222.9K
Market Conditions
NOI Build-Up for 1,550 SF
Gross rent
$35.3K $22.80/SF
− Vacancy
−$8.6K −$5.54/SF
EGI
$26.8K $17.26/SF
− OpEx
−$6.7K −$4.31/SF
NOI
$20.1K $12.94/SF
Area
Portland, OR
Vacancy
24.30%
Lease Rate
$22.80 /SF/Yr
Expense Ratio
25.00%
Simulate Cap Rate and NOI
Suggested Prices Based on Cap Rates
Cap Rate 5%
$401,280
Cap Rate 7%
$286,629
Cap Rate 9%
$222,933
Alternative Uses
Best Use
Office B
$286.6K
$250.8K – $334.4K
NOI $20,064 @ 7.0% cap · market cap 4.73%
Second Best
—
—
no second resolved use
Theoretical Best
Office A
$435.3K
$380.9K – $507.8K
NOI $30,469 @ 7.0% cap · market cap 7.18%
Zoning and permitted uses should be independently verified with authorities.
Property Analytics
Current Use
Location Intelligence
Trade Area within ½ mile
506
Businesses Nearby
Explore this area
Business Placement
Demographics for 97233, OR
41,625
Population
14,844
Households
2.8
Avg Household Size
34
Median Age
18%
College-Educated
80%
High-School Grad
4.6 sq mi
ZIP Area
9,049
Density / Sq Mi
$54,886
Median Household Income
$37,216
Median Earnings
$1,352
Median Rent
$385,100
Median Home Value
Market
Vacancy Rate% for Office in Portland, OR

Questions? Ask Rey
Realmo’s AI knows this listing — price, zoning, demand, history. Ask anything.






Frequently Asked Questions
What type of property is this?
Office units - Recently remodeled office condominium, ideal for owner-occupiers or investors.
Where is this office units located?
The property is located at 12724 SE STARK #68&69 P Portland, OR.
What is the asking price?
The asking price for this property is $424,500.
What are key features of this property?
This property features: Opportunity to own commercial office space and build equity instead of renting.; Can be subdivided into two separate leasable units (500 sq ft and 1,050 sq ft) with independent entrances and bathrooms.; Recently remodeled with new paint, floor coverings, and window blinds.


