Freestanding Bank with Three-Lane
For Sale
$649,500
209 Skyline Dr, East Stroudsburg, PA 18301
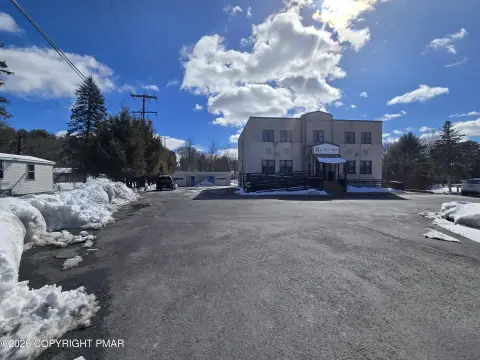
Freestanding brick building with 3-lane drive-thru, multiple office rooms, vault, and public water and septic.
Property Size4,000 SF
Lot Size0.50 Acres
Price / SF$162.38
Days on Market1261
Property Features for 209 Skyline Dr
General Information
Standard status
Active
Size
4,000 SF
Total Parking Spaces
20
Lot size
0.50 Acres
Zoning
C-2
Site & Location
Traffic Count
19,000 vehicles/day
Road Access
Yes
Utilities to Site
Yes
Additional Details
Clear Height
14 ft
Taxes and HOA fees
Annual Taxes
$22,426
Listing Agency:
MORE Modern Real Estate LLC
(570) 234-3400
Listed By:
Jaime Goulet
(610) 858-5326
Source:
Exprealty
Added: May 9, 2023
Changed: Oct 6
Last Checked: Oct 19 at 7:10AM
Displayed information is deemed reliable but is not guaranteed and should be independently verified. All listing content including descriptions, pricing, images are the copyrighted material of MORE Modern Real Estate LLC

Ask AI about this property
Review the available facts, identify missing information and prepare questions for the agent.
Investment Insights
Based on property information with market context.
A freestanding brick former bank building offering approximately 4,000 square feet and nearly 12–14-foot ceilings. The property includes all fixtures, a vault, four office rooms, two restrooms, and an impressive mechanical room. The site supports 20+ parking spaces and features a 3-lane drive-thru configuration.
Located in East Stroudsburg/Stroud Township and positioned adjacent to a busy intersection, the property is described as having high visibility and traffic volume of 19,000+ cars per day. The building is on just over a half-acre parcel and is zoned C-2.
Utilities listed include public water and septic. The combination of the drive-thru layout and existing interior improvements supports a range of C-2 compatible concepts, including medical, restaurant/fast-food, business uses, and banking.
Located in East Stroudsburg/Stroud Township and positioned adjacent to a busy intersection, the property is described as having high visibility and traffic volume of 19,000+ cars per day. The building is on just over a half-acre parcel and is zoned C-2.
Utilities listed include public water and septic. The combination of the drive-thru layout and existing interior improvements supports a range of C-2 compatible concepts, including medical, restaurant/fast-food, business uses, and banking.
Key Highlights
- Nearly 4,000 SF freestanding brick former bank building on a just‑over half‑acre parcel
- Zoned C‑2 and includes all fixtures from the former bank
- 3‑lane drive‑thru plus 20+ parking spaces
Financial Insights
Estimated NOI and Cap Rate
NOI / Yr
$51,840
Cap Rate
7.98%
Suggested Prices Based on Cap Rates
Cap Rate 5%
$1,036,800
$1.0M
Cap Rate 7%
$740,571
$740.6K
Cap Rate 9%
$576,000
$576.0K
Market Conditions
NOI Build-Up for 4,000 SF
Gross rent
$72.0K $18.00/SF
− Vacancy
−$2.9K −$0.72/SF
EGI
$69.1K $17.28/SF
− OpEx
−$17.3K −$4.32/SF
NOI
$51.8K $12.96/SF
Area
Monroe County, PA
Vacancy
4.00%
Lease Rate
$18.00 /SF/Yr
Expense Ratio
25.00%
Simulate Cap Rate and NOI
Suggested Prices Based on Cap Rates
Cap Rate 5%
$1,036,800
Cap Rate 7%
$740,571
Cap Rate 9%
$576,000
Alternative Uses
Best Use
Specialty Retail
$740.6K
$648.0K – $864.0K
NOI $51,840 @ 7.0% cap · market cap 7.98%
Second Best
Retail
$644.4K
$563.9K – $751.8K
NOI $45,108 @ 7.0% cap · market cap 6.95%
Theoretical Best
Office A
$1.20M
$1.05M – $1.40M
NOI $83,808 @ 7.0% cap · market cap 12.90%
Zoning and permitted uses should be independently verified with authorities.
How Realmo checks its estimates
Property Analytics
Unlock full access to Insights
Subscribe to Realmo Intelligence
Open Analytics
Current Use
Lease Details
14 ft
Clear height
19,000 VPD
Traffic count
Yes
Paved road access
Yes
Utilities to site
Location Intelligence
Trade Area within ½ mile
401
Businesses Nearby
106k
Monthly Visits Nearby
Explore this area
Business Placement
Foot Traffic Nearby
Groceries 32%
Superstores 22%
Dining 22%
Shops & Services 22%
Weis Markets
Groceries
34,397 visits/mo
0.2 miles
Big Lots
Superstores
23,721 visits/mo
0.5 miles
Wendy's
Dining
23,670 visits/mo
0.2 miles
Sunoco
Shops & Services
15,807 visits/mo
0.2 miles
Advance Auto Parts
Shops & Services
3,097 visits/mo
0.4 miles
Demographics for 18301, PA
29,184
Population
11,125
Households
2.6
Avg Household Size
37
Median Age
34%
College-Educated
89%
High-School Grad
38.1 sq mi
ZIP Area
766
Density / Sq Mi
$90,488
Median Household Income
$40,202
Median Earnings
$1,350
Median Rent
$246,100
Median Home Value
Check the figures for this property
Cap Rate, Value Estimation, Potential NOI and more
View Realmo Analytics
Market
Vacancy Rate% for Retail in Northeast region


Frequently Asked Questions
What type of property is this?
Bank - Freestanding brick building with 3-lane drive-thru, multiple office rooms, vault, and public water and septic.
Where is this bank located?
The property is located at 209 Skyline Dr East Stroudsburg, PA.
What is the asking price?
The asking price for this property is $649,500.
What are key features of this property?
This property features: Nearly 4,000 SF freestanding brick former bank building on a just‑over half‑acre parcel; Zoned C‑2 and includes all fixtures from the former bank; 3‑lane drive‑thru plus 20+ parking spaces


