Corner Retail and Fuel Station
For Sale
$725,000
1264 S Boston Rd, Danville, VA 24540
Highly visible corner commercial property with multi-entrance access and large parking for convenience retail or automotive uses.
Property Size3,220 SF
Price / SF$225.16
Days on Market160
Property Features for 1264 S Boston Rd
General Information
Standard status
Active
Size
3,220 SF
Property subtype
Business Opportunity
Additional Details
Traffic Count
27,000 vehicles/day
Taxes and HOA fees
Annual Taxes
$4,619
Listing Agency:
Ballard Real Estate Group LLC
(276) 236-2928
Listed By:
Jason Bowers
(276) 233-2527
Source:
Exprealty
Added: May 1
Changed: Oct 6
Last Checked: Oct 5 at 9:43PM
Displayed information is deemed reliable but is not guaranteed and should be independently verified. All listing content including descriptions, pricing, images are the copyrighted material of Ballard Real Estate Group LLC
Investment Insights
Based on property information with market context.
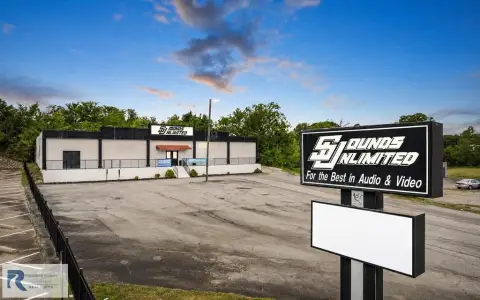
This property is a former Speedway/7-Eleven gas station offered for sale as a corner commercial site. The asset includes a large concrete parking area designed for customer accessibility, along with multiple vehicle entrances for convenient site access. The configuration supports straightforward customer flow and flexible use depending on redevelopment or re-tenanting plans.
The site sits at the corner of S. Boston Road and Williamson Road in Danville, Virginia, described as being in one of the area’s busiest corridors. Public remarks indicate over 27,000 vehicles passing daily, and the property is positioned to serve traffic from both roads. There are four total entrances, with two off S. Boston Road and two off Williamson Road, and a crossover that provides ingress and egress from multiple directions.
For operators, the site’s corner visibility and multi-directional access can support convenience retail, automotive-related use, or other retail concepts that benefit from strong drive-by exposure and easy parking. For investors or developers, the property’s established commercial presence and prominent street-corner placement may be attractive for reuse or redevelopment plans, subject to applicable approvals and use requirements.
The site sits at the corner of S. Boston Road and Williamson Road in Danville, Virginia, described as being in one of the area’s busiest corridors. Public remarks indicate over 27,000 vehicles passing daily, and the property is positioned to serve traffic from both roads. There are four total entrances, with two off S. Boston Road and two off Williamson Road, and a crossover that provides ingress and egress from multiple directions.
For operators, the site’s corner visibility and multi-directional access can support convenience retail, automotive-related use, or other retail concepts that benefit from strong drive-by exposure and easy parking. For investors or developers, the property’s established commercial presence and prominent street-corner placement may be attractive for reuse or redevelopment plans, subject to applicable approvals and use requirements.
Key Highlights
- Highly visible corner commercial property at S. Boston Road and Williamson Road in Danville, VA
- Over 27,000 vehicles pass daily, offering high traffic exposure for retail or automotive uses
- Large concrete parking area designed for customer accessibility and convenience
Financial Insights
Estimated NOI and Cap Rate
NOI / Yr
$35,383
Cap Rate
4.88%
Suggested Prices Based on Cap Rates
Cap Rate 5%
$707,660
$707.7K
Cap Rate 7%
$505,471
$505.5K
Cap Rate 9%
$393,144
$393.1K
Market Conditions
NOI Build-Up for 3,220 SF
Gross rent
$51.4K $15.96/SF
− Vacancy
−$4.2K −$1.31/SF
EGI
$47.2K $14.65/SF
− OpEx
−$11.8K −$3.66/SF
NOI
$35.4K $10.99/SF
Area
Danville County, VA
Vacancy
8.20%
Lease Rate
$15.96 /SF/Yr
Expense Ratio
25.00%
Simulate Cap Rate and NOI
Suggested Prices Based on Cap Rates
Cap Rate 5%
$707,660
Cap Rate 7%
$505,471
Cap Rate 9%
$393,144
Alternative Uses
Best Use
Industrial
$1.56M
$1.36M – $1.82M
NOI $108,955 @ 7.0% cap · market cap 15.03%
Second Best
Specialty Retail
$505.5K
$442.3K – $589.7K
NOI $35,383 @ 7.0% cap · market cap 4.88%
Theoretical Best
Warehouse
$1.89M
$1.65M – $2.21M
NOI $132,303 @ 7.0% cap · market cap 18.25%
Zoning and permitted uses should be independently verified with authorities.
Property Analytics
Unlock full access to Insights
Subscribe to Realmo Intelligence
Open Analytics
Current Use
Lease Details
27,000 VPD
Traffic count
Location Intelligence
Trade Area within ½ mile
162
Businesses Nearby
89k
Monthly Visits Nearby
Explore this area
Business Placement
Foot Traffic Nearby
Shops & Services 47%
Dining 43%
Groceries 9%
Hotels & Casinos 1%
Dollar Tree
Shops & Services
13,727 visits/mo
0.2 miles
Burger King
Dining
13,317 visits/mo
0.1 miles
Wendy's
Dining
12,451 visits/mo
0.2 miles
Hardee's
Dining
11,221 visits/mo
0.2 miles
Piggly Wiggly
Groceries
7,757 visits/mo
0.3 miles
Demographics for 24540, VA
32,094
Population
15,792
Households
2
Avg Household Size
43
Median Age
17%
College-Educated
87%
High-School Grad
75.0 sq mi
ZIP Area
428
Density / Sq Mi
$47,207
Median Household Income
$34,621
Median Earnings
$828
Median Rent
$146,100
Median Home Value
Check the figures for this property
Cap Rate, Value Estimation, Potential NOI and more
View Realmo Analytics
Market
Vacancy Rate% for Retail in South region

Questions? Ask Rey
Realmo’s AI knows this listing — price, zoning, demand, history. Ask anything.



Frequently Asked Questions
What type of property is this?
Gas station - Highly visible corner commercial property with multi-entrance access and large parking for convenience retail or automotive uses.
Where is this gas station located?
The property is located at 1264 S Boston Rd Danville, VA.
What is the asking price?
The asking price for this property is $725,000.
What are key features of this property?
This property features: Highly visible corner commercial property at S. Boston Road and Williamson Road in Danville, VA; Over 27,000 vehicles pass daily, offering high traffic exposure for retail or automotive uses; Large concrete parking area designed for customer accessibility and convenience


