Detached Two-Family Brick
1916 83rd St Brooklyn, NY 11214
For Sale
$1,349,999
As-is two-family with 2BR over 2BR layout and detached garage, suited for buyers ready for full renovation.
Property Size2,240 SF
Price / SF$602.68
Days on Market55
Property Features for 1916 83rd St
General Information
- Standard status
- Active
- Size
- 2,240 SF
- Property subtype
- Multi Family
Building Details
- Year Built
- 1930
Listing Agency:
Weichert Realtors The Franzese
(718) 232-1004
Listed By:
Jordan A. Husein
(718) 232-1004
Source:
Elliman
Added: Jun 3
Changed: Jul 10
Last Checked: Jul 26 at 8:33AM
Displayed information is deemed reliable but is not guaranteed and should be independently verified. All listing content including descriptions, pricing, images are the copyrighted material of Weichert Realtors The Franzese
Investment Insights
Based on property information with market context.
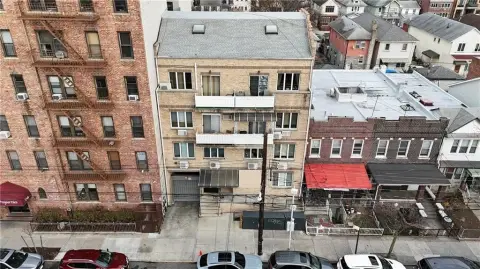
This fully detached two-family brick property is built as a 2-bedroom over 2-bedroom configuration across two stories. The building is 20 ft x 38 ft (approximately 2,240 sq. ft.) and sits on a 30 ft x 100 ft lot. A detached garage and shared driveway provide on-site parking convenience. Built in 1930, the property requires a full gut renovation and is being sold as-is, offering contractors, investors, and builders the opportunity to redesign and reimagine the interior layout.
Located at 1916 83rd St in Brooklyn, NY 11214, the home is described as being in the heart of Bensonhurst and within reach of shopping, restaurants, schools, parks, and public transportation. The listing also notes convenient access to major highways.
For a tenant or owner-operator, the appeal is straightforward: the structure supports a classic two-unit setup while allowing flexibility to update finishes, systems, and configuration through a renovation scope. For investors and builders, the as-is condition and R5 zoning context can support a value-creation approach through complete interior redevelopment, with the detached garage and shared driveway remaining fixed site features.
Located at 1916 83rd St in Brooklyn, NY 11214, the home is described as being in the heart of Bensonhurst and within reach of shopping, restaurants, schools, parks, and public transportation. The listing also notes convenient access to major highways.
For a tenant or owner-operator, the appeal is straightforward: the structure supports a classic two-unit setup while allowing flexibility to update finishes, systems, and configuration through a renovation scope. For investors and builders, the as-is condition and R5 zoning context can support a value-creation approach through complete interior redevelopment, with the detached garage and shared driveway remaining fixed site features.
Key Highlights
- Detached 2‑family brick home (built 1930) configured as 2BR over 2BR across two stories
- Lot size 30 ft x 100 ft and building size 20 ft x 38 ft; approx. 2,240 SF total
- Detached garage with shared driveway
Financial Insights For Multifamily LT 5
Simulate Cap Rate and NOI
NOI Build-Up
- Vacancy
- income lost from leasable area expected to sit empty during the year — subtracted from gross rent.
- EGI (Effective Gross Income)
- gross rent minus vacancy losses — the realistic income before paying operating costs.
- OpEx (Operating Expenses)
- recurring costs to operate the property (property tax, insurance, utilities, maintenance, management) — excludes financing and capital improvements.
- NOI (Net Operating Income)
- income a property generates after operating costs but before financing and taxes.
| Component | $ | $/SF |
|---|---|---|
| Gross rent | $91.4k | $40.80 |
| − Vacancy | −$4.1k | −$1.84 |
| EGI | $87.3k | $38.96 |
| − OpEx | −$26.2k | −$11.69 |
| NOI | $61.1k | $27.27 |
2,240 SF · lease $40.80/SF/yr · vacancy 4.50% · expense 30.00%
Alternative Uses
Best Use
Multifamily LT 5
$872.8K
$763.7K – $1.02M
NOI $61,096 @ 7.0% cap · market cap 4.53%
Second Best
Apartment 5plus
$782.2K
$684.5K – $912.6K
NOI $54,756 @ 7.0% cap · market cap 4.06%
Theoretical Best
Office A
$1.31M
$1.14M – $1.52M
NOI $91,469 @ 7.0% cap · market cap 6.78%
Zoning and permitted uses should be independently verified with local authorities.
Property Analytics
Property Profile
Location Intelligence
Current Use by Public Records
Duplexes


FAQs
What type of property is this?
Duplex - As-is two-family with 2BR over 2BR layout and detached garage, suited for buyers ready for full renovation.
Where is this duplex located?
The property is located at 1916 83rd St Brooklyn, NY.
What is the asking price?
The asking price for this property is $1,349,999.
What are key features of this property?
This property features: Detached 2‑family brick home (built 1930) configured as 2BR over 2BR across two stories; Lot size 30 ft x 100 ft and building size 20 ft x 38 ft; approx. 2,240 SF total; Detached garage with shared driveway


