Iconic Restaurant and Bowling
For Sale
$1,500,000
Pending
430 & 422 N 5th Street, Roscommon, MI 48653
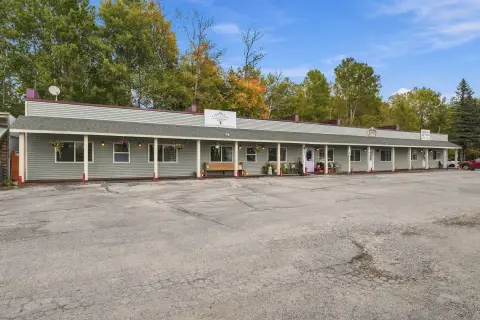
Established restaurant, banquet rooms, bar, and bowling alley.
Property Size14,392 SF
Days on Market673
Property Features for 430 & 422 N 5th Street
General Information
Standard status
Pending
Size
14,392 SF
Property subtype
Commercial/Industrial
Building Details
Year Built
1956
Listing Agency:
COLDWELL BANKER SCHMIDT REALTORS-HL
(989) 366-5522
Listed By:
RUTH CLEMENS · License #6506043271
(989) 429-3100
Source:
Exitrealty
Added: Dec 11, 2024
Changed: Sep 10
Last Checked: Sep 15 at 5:29AM
Displayed information is deemed reliable but is not guaranteed and should be independently verified. All listing content including descriptions, pricing, images are the copyrighted material of COLDWELL BANKER SCHMIDT REALTORS-HL
Investment Insights
Based on property information with market context.
This property, known as the Iconic Fred's Restaurant of Roscommon, features a large dining room, a well-appointed kitchen, banquet rooms, and a lounge with a bar. It also includes a billiards corner and an additional 7,000 square feet with 8 bowling lanes. Established in 1956, Fred's was renovated and expanded in 1980 to its current size, which accommodates a seating capacity of over 200. In 2008, new owners completed a remodel, including a makeover of the bowling alley area with state-of-the-art bowling lanes and equipment. The business has grown to be well-established with excellent cash flow. The property is located in the Heart of Northern Michigan, offering four seasons of outdoor activities in a popular resort and recreation area. The total property size is 14,392 square feet. The property is suitable for conventional restaurants, sports and entertainment venues, bars, and pubs.
Key Highlights
- Well‑established restaurant with excellent cash flow.
- Includes a fully equipped kitchen, dining room, banquet rooms, and lounge with bar.
- Features a modern, remodeled bowling alley with state‑of‑the‑art equipment.
Financial Insights
Estimated NOI and Cap Rate
NOI / Yr
$109,569
Cap Rate
7.30%
Suggested Prices Based on Cap Rates
Cap Rate 5%
$2,191,380
$2.2M
Cap Rate 7%
$1,565,271
$1.6M
Cap Rate 9%
$1,217,433
$1.2M
Market Conditions
NOI Build-Up for 14,392 SF
Gross rent
$202.1K $14.04/SF
− Vacancy
−$56.0K −$3.89/SF
EGI
$146.1K $10.15/SF
− OpEx
−$36.5K −$2.54/SF
NOI
$109.6K $7.61/SF
Area
Roscommon County, MI
Vacancy
27.70%
Lease Rate
$14.04 /SF/Yr
Expense Ratio
25.00%
Simulate Cap Rate and NOI
Suggested Prices Based on Cap Rates
Cap Rate 5%
$2,191,380
Cap Rate 7%
$1,565,271
Cap Rate 9%
$1,217,433
Alternative Uses
Best Use
Specialty Retail
$1.57M
$1.37M – $1.83M
NOI $109,569 @ 7.0% cap · market cap 7.30%
Second Best
—
—
no second resolved use
Theoretical Best
Office A
$2.37M
$2.07M – $2.76M
NOI $165,796 @ 7.0% cap · market cap 11.05%
Zoning and permitted uses should be independently verified with authorities.
How Realmo checks its estimates
Property Analytics
Unlock full access to Insights
Subscribe to Realmo Intelligence
Open Analytics
Current Use
Location Intelligence
Trade Area within ½ mile
292
Businesses Nearby
Balanced
Demand for This Use
Explore this area
Business Placement
Demographics for 48653, MI
9,598
Population
9,814
Households
1
Avg Household Size
55
Median Age
27%
College-Educated
93%
High-School Grad
241.8 sq mi
ZIP Area
40
Density / Sq Mi
$67,708
Median Household Income
$41,548
Median Earnings
$801
Median Rent
$161,800
Median Home Value
Check the figures for this property
Cap Rate, Value Estimation, Potential NOI and more
View Realmo Analytics
Market
Vacancy Rate% for Retail in Midwest region

Questions? Ask Rey
Realmo’s AI knows this listing — price, zoning, demand, history. Ask anything.



Frequently Asked Questions
What type of property is this?
Conventional restaurant - Established restaurant, banquet rooms, bar, and bowling alley.
Where is this conventional restaurant located?
The property is located at 430 & 422 N 5th Street Roscommon, MI.
What is the asking price?
The asking price for this property is $1,500,000.
What are key features of this property?
This property features: Well‑established restaurant with excellent cash flow.; Includes a fully equipped kitchen, dining room, banquet rooms, and lounge with bar.; Features a modern, remodeled bowling alley with state‑of‑the‑art equipment.