Turnkey Mixed-Use Investment
For Sale
$799,900
1242 Whitney Avenue, Hamden, CT 06517
Fully occupied mixed-use property in Whitneyville neighborhood with strong income.
Property Size5,058 SF
Lot Size0.18 Acres
Price / SF$158.15
Days on Market195
Property Features for 1242 Whitney Avenue
General Information
Standard status
Active
Size
5,058 SF
Lot size
0.18 Acres
Property subtype
Commercial
Taxes and HOA fees
Annual Taxes
$18,318
Amenities
Central air
Asphalt Shingle Roof
Central Air Cooling
Hot Air Heating
Level Lot
Building Details
Year Built
1900
Listing Agency:
Press/Cuozzo Realtors
(203) 288-1900
Listed By:
MARK FOREMAN · License #RES.0827812
(203) 981-4551
Source:
Corcoran
Added: Mar 25
Changed: Aug 14
Last Checked: Aug 21 at 3:45AM
Displayed information is deemed reliable but is not guaranteed and should be independently verified. All listing content including descriptions, pricing, images are the copyrighted material of Press/Cuozzo Realtors
Investment Insights
Based on property information with market context.
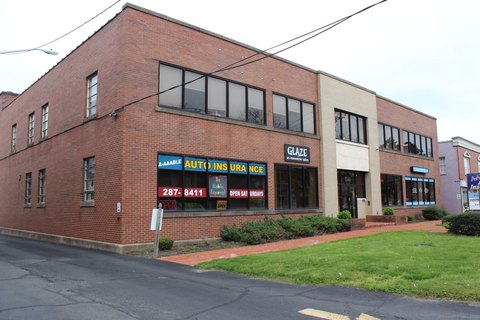
Located in the heart of the Whitneyville neighborhood, 1242 Whitney Avenue is a mixed-use investment property. The building is fully occupied and turnkey, offering strong in-place income. The property features two established retail tenants on the ground floor and a fully leased residential apartment on the second floor. A full basement provides ample storage. Five paved off-street parking spaces are included. The building is in excellent condition, with a new roof installed in 2023. The property is strategically located, offering quick access to downtown New Haven and is just minutes from Yale University, Quinnipiac University, major employment centers, and key transportation routes. The area's mix of local businesses, residential density, and strong community character enhances the property's appeal. The property size is 5058 square feet.
Key Highlights
- Fully occupied, turnkey mixed‑use investment property with strong in‑place income.
- Five paved off‑street parking spaces, a premium in the area.
- New roof installed in 2023, indicating excellent condition.
Financial Insights
Estimated NOI and Cap Rate
NOI / Yr
$69,800
Cap Rate
8.73%
Suggested Prices Based on Cap Rates
Cap Rate 5%
$1,396,000
$1.4M
Cap Rate 7%
$997,143
$997.1K
Cap Rate 9%
$775,556
$775.6K
Market Conditions
NOI Build-Up for 5,058 SF
Gross rent
$121.4K $24.00/SF
− Vacancy
−$9.7K −$1.92/SF
EGI
$111.7K $22.08/SF
− OpEx
−$41.9K −$8.28/SF
NOI
$69.8K $13.80/SF
Area
New Haven, CT
Vacancy
8.00%
Lease Rate
$24.00 /SF/Yr
Expense Ratio
37.50%
Simulate Cap Rate and NOI
Suggested Prices Based on Cap Rates
Cap Rate 5%
$1,396,000
Cap Rate 7%
$997,143
Cap Rate 9%
$775,556
Alternative Uses
Best Use
Mixed Use
$997.1K
$872.5K – $1.16M
NOI $69,800 @ 7.0% cap · market cap 8.73%
Second Best
—
—
no second resolved use
Theoretical Best
Office A
$1.63M
$1.42M – $1.90M
NOI $113,892 @ 7.0% cap · market cap 14.24%
Zoning and permitted uses should be independently verified with authorities.
Property Analytics
Unlock full access to Insights
Subscribe to Realmo Intelligence
Open Analytics
Current Use
Location Intelligence
Trade Area within ½ mile
287
Businesses Nearby
Explore this area
Business Placement
Demographics for 06517, CT
14,954
Population
6,875
Households
2.2
Avg Household Size
45
Median Age
52%
College-Educated
96%
High-School Grad
5.0 sq mi
ZIP Area
2,991
Density / Sq Mi
$97,154
Median Household Income
$58,025
Median Earnings
$1,351
Median Rent
$313,000
Median Home Value
Check the figures for this property
Cap Rate, Value Estimation, Potential NOI and more
View Realmo Analytics

Questions? Ask Rey
Realmo’s AI knows this listing — price, zoning, demand, history. Ask anything.






Frequently Asked Questions
What type of property is this?
Mixed-use property - Fully occupied mixed-use property in Whitneyville neighborhood with strong income.
Where is this mixed-use property located?
The property is located at 1242 Whitney Avenue Hamden, CT.
What is the asking price?
The asking price for this property is $799,900.
What are key features of this property?
This property features: Fully occupied, turnkey mixed‑use investment property with strong in‑place income.; Five paved off‑street parking spaces, a premium in the area.; New roof installed in 2023, indicating excellent condition.



