Two-Unit Residential Income
For Sale
$262,500
124 NASSAU STREET, Trenton, NJ 08638
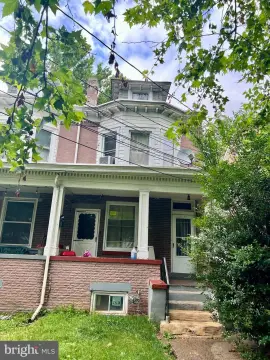
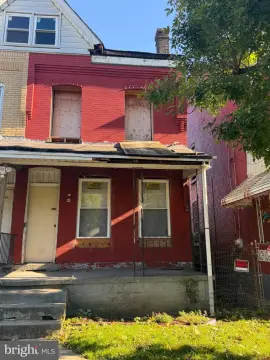
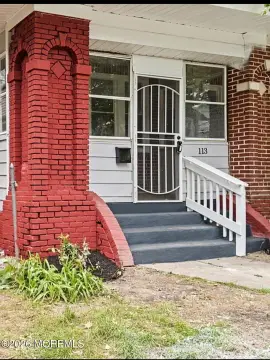
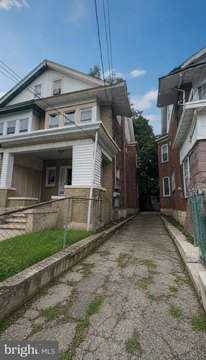
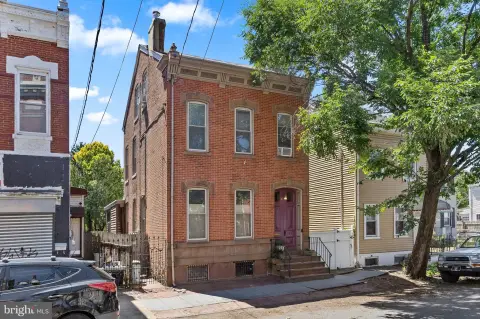
Two separate units offer flexible occupancy or rental options with separate utilities for each unit.
Property SizeContact for details
Days on Market135
Property Features for 124 NASSAU STREET
General Information
Standard status
Active
Property subtype
Duplex
Additional Details
Multifamily Units
2
Amenities
Radiator
Refrigerator
Stove
Cable TV Available, Electric Available, Natural Gas Available, Sewer Available, Water Available, Phone Available, Shingle
Building Details
Year Built
1920
Stories
3
Listing Agency:
Cherry Hill
Listed By:
Janeira Charles · License #2081974
(609) 556-3155
Source:
Kw
Added: Jun 3
Changed: Oct 15
Last Checked: Oct 14 at 9:27PM
Displayed information is deemed reliable but is not guaranteed and should be independently verified. All listing content including descriptions, pricing, images are the copyrighted material of Cherry Hill

Ask AI about this property
Review the available facts, identify missing information and prepare questions for the agent.
Investment Insights
Based on property information with market context.
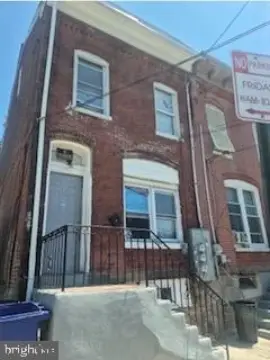
This well-maintained two-family duplex includes two separate units. Unit 1 has two bedrooms and one bathroom and is described as currently rented for $1,400. Unit 2 has three bedrooms and one bathroom and is currently vacant, with separate utilities for each unit. The property is being sold strictly as-is, with the buyer responsible for all inspections and certifications.
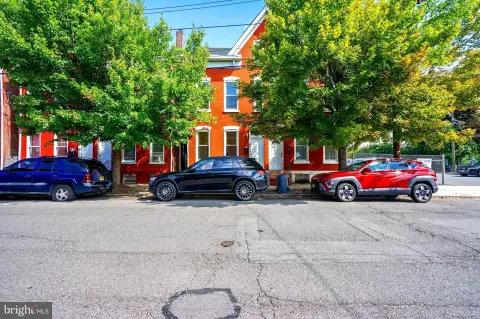
The property is located in Trenton in Mercer County. Transportation and access are supported by nearby public transit options, including a bus stop less than one mile, and commuter rail and lots within five miles. The listing also notes proximity to an airport under 10 miles, along with access to shopping and dining.
For buyers seeking residential income or flexible living arrangements, the duplex layout allows one unit to be owner-occupied while the other supports rental income. The presence of separate utilities may help simplify tenant billing and unit-level management. Buyers should factor in the as-is condition and plan for due diligence accordingly.
The property is located in Trenton in Mercer County. Transportation and access are supported by nearby public transit options, including a bus stop less than one mile, and commuter rail and lots within five miles. The listing also notes proximity to an airport under 10 miles, along with access to shopping and dining.
For buyers seeking residential income or flexible living arrangements, the duplex layout allows one unit to be owner-occupied while the other supports rental income. The presence of separate utilities may help simplify tenant billing and unit-level management. Buyers should factor in the as-is condition and plan for due diligence accordingly.
Key Highlights
- Two‑family home built in 1920 with 2 separate units in Trenton City (21111)
- Unit 1: 2 bed, 1 bath rented for $1,400
- Unit 2: 3 bed, 1 bath is vacant with separate utilities for each unit
Property Analytics
Unlock full access to Insights
Subscribe to Realmo Intelligence
Open Analytics
Current Use
Lease Details
2
Residential units
Location Intelligence
Trade Area within ½ mile
1,313
Businesses Nearby
Explore this area
Business Placement
Demographics for 08638, NJ
23,548
Population
10,148
Households
2.3
Avg Household Size
38
Median Age
31%
College-Educated
89%
High-School Grad
5.4 sq mi
ZIP Area
4,361
Density / Sq Mi
$65,650
Median Household Income
$40,374
Median Earnings
$1,499
Median Rent
$226,700
Median Home Value
Check the figures for this property
Cap Rate, Value Estimation, Potential NOI and more
View Realmo Analytics
Market
Vacancy Rate% for Multifamily in Northeast region





Frequently Asked Questions
What type of property is this?
Duplex - Two separate units offer flexible occupancy or rental options with separate utilities for each unit.
Where is this duplex located?
The property is located at 124 NASSAU STREET Trenton, NJ.
What is the asking price?
The asking price for this property is $262,500.
What are key features of this property?
This property features: Two‑family home built in 1920 with 2 separate units in Trenton City (21111); Unit 1: 2 bed, 1 bath rented for $1,400; Unit 2: 3 bed, 1 bath is vacant with separate utilities for each unit


