Kahului Industrial Warehouse
For Sale
$5,529,953
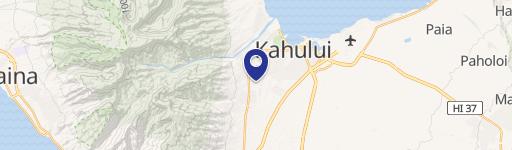
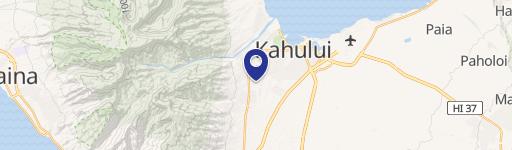
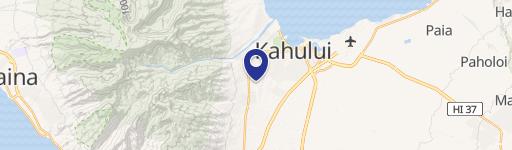
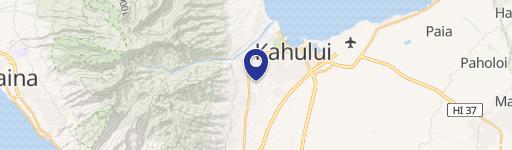
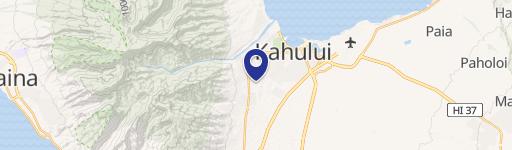
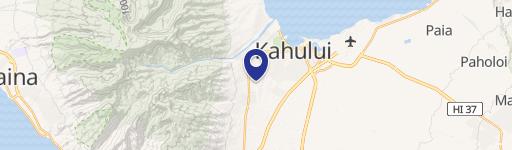
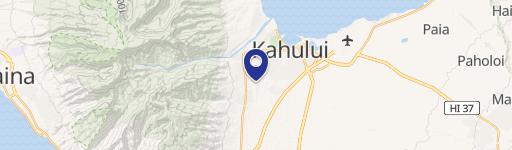
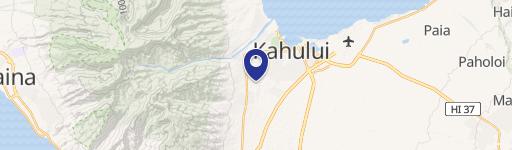
220 Lalo Street, Kahului, HI 96732
Industrial asset with expansion potential in Maui's supply-constrained submarket.
Property Size11,334 SF
Lot Size2.00 Acres
Price / SF$487.91
Days on Market195
Property Features for 220 Lalo Street
General Information
Standard status
Active
Size
11,334 SF
Lot size
2.00 Acres
Property subtype
Industrial
Listed By:
Nicholas Adler · License #RS-78419
(808) 541-5149
Source:
Cbre
Added: Mar 25
Changed: Oct 4
Last Checked: Oct 4 at 7:30AM
Displayed information is deemed reliable but is not guaranteed and should be independently verified. All listing content including descriptions, pricing, images are the copyrighted material of Nicholas Adler
Investment Insights
Based on property information with market context.
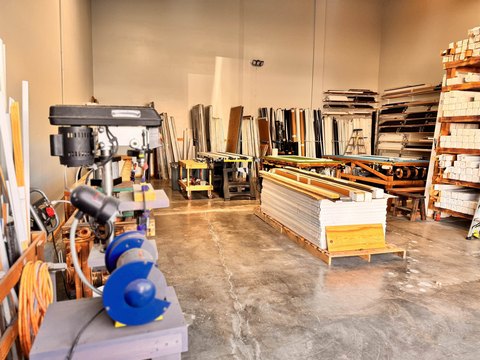
Located in the Kahului Industrial Area on Maui, Hawaii, this property provides logistical advantages due to its proximity to Kahului Harbor and island-wide access. The property features a steel-frame light industrial warehouse with an attached wood-frame retail/office facility. The gross leasable area is approximately 12,000 square feet. A photo voltaic system is in place. Situated on a 2-acre parcel, the property has a coverage ratio of 13%, while typical commercial/industrial properties have a 40-60% coverage ratio. The estimated surplus land area is approximately 63,930 square feet. Zoned M-2 Heavy Industrial, the property offers expansion potential supported by market fundamentals. This property presents an opportunity for investors and owner-users to acquire an industrial asset in a supply-constrained submarket.
Key Highlights
- Prime location in Kahului Industrial Area, near Kahului Harbor, providing superior logistics and island‑wide access.
- Significant expansion potential due to M‑2 Heavy Industrial zoning and low 13% site coverage.
- Large 2‑acre parcel (approximately 63,930 sq. ft. surplus land area) offering operational flexibility and outdoor yard usage.
Financial Insights
Estimated NOI and Cap Rate
NOI / Yr
$270,765
Cap Rate
4.90%
Suggested Prices Based on Cap Rates
Cap Rate 5%
$5,415,300
$5.4M
Cap Rate 7%
$3,868,071
$3.9M
Cap Rate 9%
$3,008,500
$3.0M
Market Conditions
NOI Build-Up for 11,334 SF
Gross rent
$408.0K $36.00/SF
− Vacancy
−$21.2K −$1.87/SF
EGI
$386.8K $34.13/SF
− OpEx
−$116.0K −$10.24/SF
NOI
$270.8K $23.89/SF
Area
Maui County, HI
Vacancy
5.20%
Lease Rate
$36.00 /SF/Yr
Expense Ratio
30.00%
Simulate Cap Rate and NOI
Suggested Prices Based on Cap Rates
Cap Rate 5%
$5,415,300
Cap Rate 7%
$3,868,071
Cap Rate 9%
$3,008,500
Alternative Uses
Best Use
Retail
$3.87M
$3.38M – $4.51M
NOI $270,765 @ 7.0% cap · market cap 4.90%
Second Best
Office B
$3.22M
$2.82M – $3.76M
NOI $225,433 @ 7.0% cap · market cap 4.08%
Theoretical Best
Specialty Retail
$4.58M
$4.01M – $5.35M
NOI $320,948 @ 7.0% cap · market cap 5.80%
Zoning and permitted uses should be independently verified with authorities.
Property Analytics
Unlock full access to Insights
Subscribe to Realmo Intelligence
Open Analytics
Current Use
Location Intelligence
Demographics for 96732, HI
27,507
Population
8,728
Households
3.2
Avg Household Size
40
Median Age
26%
College-Educated
88%
High-School Grad
11.9 sq mi
ZIP Area
2,312
Density / Sq Mi
$94,360
Median Household Income
$45,071
Median Earnings
$1,479
Median Rent
$832,700
Median Home Value
Check the figures for this property
Cap Rate, Value Estimation, Potential NOI and more
View Realmo Analytics
Market
Vacancy Rate% for Office in West region

Questions? Ask Rey
Realmo’s AI knows this listing — price, zoning, demand, history. Ask anything.
Frequently Asked Questions
What type of property is this?
Warehouse - Industrial asset with expansion potential in Maui's supply-constrained submarket.
Where is this warehouse located?
The property is located at 220 Lalo Street Kahului, HI.
What is the asking price?
The asking price for this property is $5,529,953.
What are key features of this property?
This property features: Prime location in Kahului Industrial Area, near Kahului Harbor, providing superior logistics and island‑wide access.; Significant expansion potential due to M‑2 Heavy Industrial zoning and low 13% site coverage.; Large 2‑acre parcel (approximately 63,930 sq. ft. surplus land area) offering operational flexibility and outdoor yard usage.


