Renovated Downtown Office
For Sale
$1,576,000
123 N College Ave 200 & 300, Fort Collins, CO 80524
Recently renovated office suite with modern upgrades and parking passes.
Property Size6,023 SF
Days on Market229
Property Features for 123 N College Ave 200 & 300
General Information
Standard status
Active
Size
6,023 SF
Property subtype
Commercial
Taxes and HOA fees
Annual Taxes
$14,770
Building Details
Building Size
6,023 SF
Year Built
1900
Listing Agency:
Cushman & Wakefield
Listed By:
Travis Ackerman · License #100014006
(970) 222-6452
Source:
Elliman
Added: Mar 5
Changed: Oct 5
Last Checked: Oct 19 at 6:58AM
Displayed information is deemed reliable but is not guaranteed and should be independently verified. All listing content including descriptions, pricing, images are the copyrighted material of Cushman & Wakefield

Ask AI about this property
Review the available facts, identify missing information and prepare questions for the agent.
Investment Insights
Based on property information with market context.
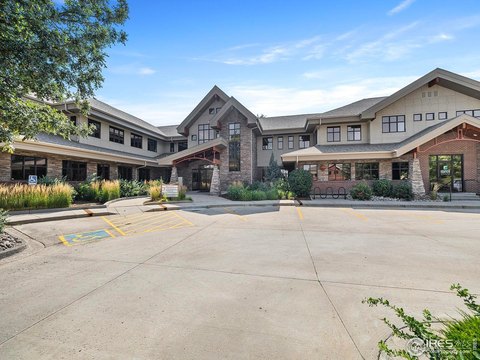
This downtown office suite, located in the Opera Galleria, has been recently renovated. It features additional glass store fronts and windows fronting College Avenue on the east, the Atrium entry to the south, and the main Atrium area to the west. The suite includes a balanced mix of offices and open-office areas, exposed historic brick, new LED efficiency lighting, and modern flooring upgrades. The expanded, open layout is designed to meet a variety of user needs. The space has the ability to convert office space to glass-enclosed conference space and features a renovated and expanded bistro kitchenette. There is also the ability to open up additional space for employee creativity and activity centers. The Atrium entry and main Atrium areas were significantly remodeled by the Downtown Development Authority in the fall of 2019, presenting a more modern common area with enhanced lighting, decor, and an openness that promotes pedestrian traffic and accessibility. Five reserved parking passes for the attached LaPorte parking garage are associated with Unit 250, with additional passes available directly from the City of Fort Collins. The LaPorte parking garage is attached to the Opera Galleria with a 2nd floor bridge that connects directly to the walkway leading to Unit 250, providing safe, convenient, and temperature-conditioned access to this convenient parking structure. This property is intended for use as office space.
Key Highlights
- Prime downtown location in the Opera Galleria with high visibility on College Avenue and access to the Atrium.
- Includes 5 reserved parking passes in the attached LaPorte parking garage with climate‑controlled access.
- Recently renovated with modern upgrades including new LED lighting and flooring, with an expanded, open layout.
Financial Insights
Estimated NOI and Cap Rate
NOI / Yr
$84,517
Cap Rate
5.36%
Suggested Prices Based on Cap Rates
Cap Rate 5%
$1,690,340
$1.7M
Cap Rate 7%
$1,207,386
$1.2M
Cap Rate 9%
$939,078
$939.1K
Market Conditions
NOI Build-Up for 6,023 SF
Gross rent
$132.3K $21.96/SF
− Vacancy
−$19.6K −$3.25/SF
EGI
$112.7K $18.71/SF
− OpEx
−$28.2K −$4.68/SF
NOI
$84.5K $14.03/SF
Area
Fort Collins, CO
Vacancy
14.80%
Lease Rate
$21.96 /SF/Yr
Expense Ratio
25.00%
Simulate Cap Rate and NOI
Suggested Prices Based on Cap Rates
Cap Rate 5%
$1,690,340
Cap Rate 7%
$1,207,386
Cap Rate 9%
$939,078
Alternative Uses
Best Use
Office B
$1.21M
$1.06M – $1.41M
NOI $84,517 @ 7.0% cap · market cap 5.36%
Second Best
—
—
no second resolved use
Theoretical Best
Office A
$1.57M
$1.37M – $1.83M
NOI $109,787 @ 7.0% cap · market cap 6.97%
Zoning and permitted uses should be independently verified with authorities.
How Realmo checks its estimates
Property Analytics
Unlock full access to Insights
Subscribe to Realmo Intelligence
Open Analytics
Current Use
Location Intelligence
Trade Area within ½ mile
3,558
Businesses Nearby
Explore this area
Business Placement
Demographics for 80524, CO
39,030
Population
17,548
Households
2.2
Avg Household Size
37
Median Age
52%
College-Educated
94%
High-School Grad
122.7 sq mi
ZIP Area
318
Density / Sq Mi
$84,440
Median Household Income
$45,046
Median Earnings
$1,623
Median Rent
$527,700
Median Home Value
Check the figures for this property
Cap Rate, Value Estimation, Potential NOI and more
View Realmo Analytics
Market
Vacancy Rate% for Office in West region



Frequently Asked Questions
What type of property is this?
Office unit - Recently renovated office suite with modern upgrades and parking passes.
Where is this office unit located?
The property is located at 123 N College Ave 200 & 300 Fort Collins, CO.
What is the asking price?
The asking price for this property is $1,576,000.
What are key features of this property?
This property features: Prime downtown location in the Opera Galleria with high visibility on College Avenue and access to the Atrium.; Includes 5 reserved parking passes in the attached LaPorte parking garage with climate‑controlled access.; Recently renovated with modern upgrades including new LED lighting and flooring, with an expanded, open layout.


