Storefront Property with
For Sale
$735,000
123 E Maple St, Jeffersonville, IN 47130
Three-building commercial property with adaptable interior areas, garage-door access, and ample electrical service.
Property Size8,352 SF
Price / SF$88
Days on Market56
Property Features for 123 E Maple St
General Information
Standard status
Active
Size
8,352 SF
Property subtype
Retail
Zoning
CD
Amenities
Power
Water
Sewer
Natural Gas
Vacant
Listing Agency:
REMAX FIRST
Listed By:
Michael Kopp
(502) 386-9022
Source:
Kcrea.resimplifi
Added: Aug 21
Changed: Sep 29
Last Checked: Oct 14 at 7:52PM
Displayed information is deemed reliable but is not guaranteed and should be independently verified. All listing content including descriptions, pricing, images are the copyrighted material of REMAX FIRST
Investment Insights
Based on property information with market context.
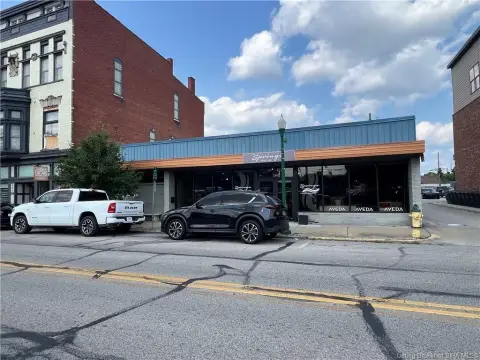
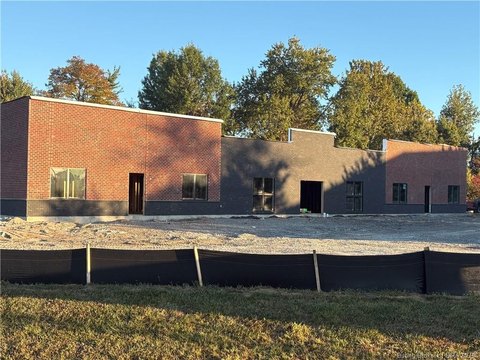
This commercial assemblage includes three buildings on two parcels with approximately 8,352 square feet of combined space. The Maple Street storefront building was formerly used as a bank and includes an area behind the retail structure that may accommodate covered outdoor seating. Two additional metal warehouse buildings provide approximately 1,200 and 4,000 square feet, respectively, with high ceilings, small doors, and garage doors. The buildings may function independently or connect internally, and the larger warehouse may accommodate separate retail areas or a commercial kitchen, subject to approvals.
The property is located at 123 E Maple St in Jeffersonville, Indiana, within the TIF District, Overlay District, Riverfront District, and designated Storefront and Facade Grant area. It is also within the Local and National Register Historic District. DC zoning supports personal services, professional offices, and retail, while food sales and service, institutional uses, and recreation are identified as special exceptions. Permitted uses and special exceptions should be confirmed with the City of Jeffersonville.
The property is located at 123 E Maple St in Jeffersonville, Indiana, within the TIF District, Overlay District, Riverfront District, and designated Storefront and Facade Grant area. It is also within the Local and National Register Historic District. DC zoning supports personal services, professional offices, and retail, while food sales and service, institutional uses, and recreation are identified as special exceptions. Permitted uses and special exceptions should be confirmed with the City of Jeffersonville.
Key Highlights
- Approximately 8352sf across 3 buildings on 2 parcels
- Maple Street storefront building formerly used as a bank
- Additional warehouse buildings measure apprx 1200sf and apprx 4000sf
Financial Insights
Estimated NOI and Cap Rate
NOI / Yr
$40,626
Cap Rate
5.53%
Suggested Prices Based on Cap Rates
Cap Rate 5%
$812,520
$812.5K
Cap Rate 7%
$580,371
$580.4K
Cap Rate 9%
$451,400
$451.4K
Market Conditions
NOI Build-Up for 8,352 SF
Gross rent
$51.4K $6.16/SF
− Vacancy
−$3.7K −$0.44/SF
EGI
$47.8K $5.72/SF
− OpEx
−$7.2K −$0.86/SF
NOI
$40.6K $4.86/SF
Area
Clark County, IN
Vacancy
7.10%
Lease Rate
$6.16 /SF/Yr
Expense Ratio
15.00%
Simulate Cap Rate and NOI
Suggested Prices Based on Cap Rates
Cap Rate 5%
$812,520
Cap Rate 7%
$580,371
Cap Rate 9%
$451,400
Alternative Uses
Best Use
Retail
$1.44M
$1.26M – $1.68M
NOI $100,815 @ 7.0% cap · market cap 13.72%
Second Best
Flex RnD
$1.04M
$910.7K – $1.21M
NOI $72,859 @ 7.0% cap · market cap 9.91%
Theoretical Best
Office A
$2.43M
$2.12M – $2.83M
NOI $169,980 @ 7.0% cap · market cap 23.13%
Zoning and permitted uses should be independently verified with authorities.
How Realmo checks its estimates
Property Analytics
Unlock full access to Insights
Subscribe to Realmo Intelligence
Open Analytics
Current Use
Location Intelligence
Trade Area within ½ mile
1,394
Businesses Nearby
Well-served
Demand for This Use
Explore this area
Business Placement
Demographics for 47130, IN
48,481
Population
22,602
Households
2.1
Avg Household Size
39
Median Age
25%
College-Educated
92%
High-School Grad
33.9 sq mi
ZIP Area
1,430
Density / Sq Mi
$68,412
Median Household Income
$40,941
Median Earnings
$1,090
Median Rent
$203,800
Median Home Value
Check the figures for this property
Cap Rate, Value Estimation, Potential NOI and more
View Realmo Analytics
Market
Vacancy Rate% for Industrial in Midwest region

Questions? Ask Rey
Realmo’s AI knows this listing — price, zoning, demand, history. Ask anything.




Similar Off Market Nearby
- Thrive Floral Studio — 1400 Main St Suite Number, 113, Clarksville, IN 47129
- Fleur de Lis Events & Design — 500 Missouri Ave, Jeffersonville, IN 47130
- Lavender Hill — 359 Spring St, Jeffersonville, IN 47130
- Affairs of the Heart Florist — 415 Meigs Ave, Jeffersonville, IN 47130
- Gigi's Blooms and More — 714 e 10th st, jeffersonville, in 47130
Frequently Asked Questions
What type of property is this?
Storefront property - Three-building commercial property with adaptable interior areas, garage-door access, and ample electrical service.
Where is this storefront property located?
The property is located at 123 E Maple St Jeffersonville, IN.
What is the asking price?
The asking price for this property is $735,000.
What are key features of this property?
This property features: Approximately 8352sf across 3 buildings on 2 parcels; Maple Street storefront building formerly used as a bank; Additional warehouse buildings measure apprx 1200sf and apprx 4000sf


