Turnkey Restaurant and Bar
For Sale
$750,000
12227-12229 Seymour Road, Grass Lake, MI 49240
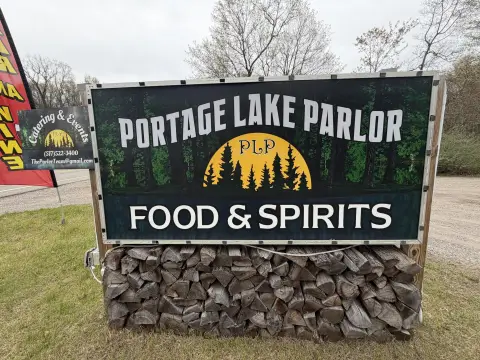
Fully operational restaurant and bar with commercial kitchen, liquor license, and multiple indoor and outdoor seating areas.
Property Size5,310 SF
Lot Size1.09 Acres
Price / SF$141.24
Days on Market139
Property Features for 12227-12229 Seymour Road
General Information
Standard status
Active
Size
5,310 SF
Lot size
1.09 Acres
Property subtype
Retail
Zoning
C-1 (Local Commercial District) and R-3 (Residential)
Additional Details
Business Included
Yes
Liquor License
Yes
Listing Agency:
Swisher Commercial
Listed By:
Charlie Koenn · License #MI #6506040186
(734) 926-0230
Source:
Swishercommercial
Added: Jun 2
Changed: Oct 11
Last Checked: Oct 16 at 6:26AM
Displayed information is deemed reliable but is not guaranteed and should be independently verified. All listing content including descriptions, pricing, images are the copyrighted material of Swisher Commercial

Ask AI about this property
Review the available facts, identify missing information and prepare questions for the agent.
Investment Insights
Based on property information with market context.
A rare opportunity to acquire a fully operational restaurant/bar property designed for a turnkey hospitality operation. The offering includes FF&E and a Class C Liquor License, along with a fully equipped commercial kitchen and bar. The primary building is approximately 3,414 SF and the site also includes an approximately 1,896 SF ranch-style residence with 2 bedrooms, 2.5 baths, a 450 SF basement, and an attached garage.
The property is located within the Waterloo Recreation Area and supports a destination-style experience. Indoor dining is complemented by a covered outdoor patio with additional outdoor seating and a smoker station. There is also a private game room/event space, along with landscaped grounds featuring a pond and lounge area. The property offers ample on-site parking, and horse access/parking is available from Waterloo Trail. Utilities include well and septic.
This configuration offers strong fit for owner-operators, investors, or hospitality groups looking for a restaurant and bar that can host both everyday service and events. The combination of dining areas, private space, and a prepared operations package (equipment and liquor license) is well suited for operators aiming to open, scale, or acquire a venue with immediate functional readiness.
The property is located within the Waterloo Recreation Area and supports a destination-style experience. Indoor dining is complemented by a covered outdoor patio with additional outdoor seating and a smoker station. There is also a private game room/event space, along with landscaped grounds featuring a pond and lounge area. The property offers ample on-site parking, and horse access/parking is available from Waterloo Trail. Utilities include well and septic.
This configuration offers strong fit for owner-operators, investors, or hospitality groups looking for a restaurant and bar that can host both everyday service and events. The combination of dining areas, private space, and a prepared operations package (equipment and liquor license) is well suited for operators aiming to open, scale, or acquire a venue with immediate functional readiness.
Key Highlights
- Fully operational restaurant/bar with included FF&E and a Class C liquor license
- 3,414 SF commercial building plus a 1.09‑acre property with indoor dining and a covered outdoor patio
- Fully equipped commercial kitchen and bar
Financial Insights
Estimated NOI and Cap Rate
NOI / Yr
$50,452
Cap Rate
6.73%
Suggested Prices Based on Cap Rates
Cap Rate 5%
$1,009,040
$1.0M
Cap Rate 7%
$720,743
$720.7K
Cap Rate 9%
$560,578
$560.6K
Market Conditions
NOI Build-Up for 5,310 SF
Gross rent
$73.3K $13.80/SF
− Vacancy
−$6.0K −$1.13/SF
EGI
$67.3K $12.67/SF
− OpEx
−$16.8K −$3.17/SF
NOI
$50.5K $9.50/SF
Area
Jackson County, MI
Vacancy
8.20%
Lease Rate
$13.80 /SF/Yr
Expense Ratio
25.00%
Simulate Cap Rate and NOI
Suggested Prices Based on Cap Rates
Cap Rate 5%
$1,009,040
Cap Rate 7%
$720,743
Cap Rate 9%
$560,578
Alternative Uses
Best Use
Specialty Retail
$720.7K
$630.7K – $840.9K
NOI $50,452 @ 7.0% cap · market cap 6.73%
Second Best
—
—
no second resolved use
Theoretical Best
Office A
$847.7K
$741.7K – $988.9K
NOI $59,336 @ 7.0% cap · market cap 7.91%
Zoning and permitted uses should be independently verified with authorities.
How Realmo checks its estimates
Property Analytics
Unlock full access to Insights
Subscribe to Realmo Intelligence
Open Analytics
Current Use
Lease Details
Turnkey business
Opportunity
Yes
Liquor license
Location Intelligence
Trade Area within ½ mile
9
Businesses Nearby
Well-served
Demand for This Use
Explore this area
Business Placement
Demographics for 49240, MI
9,213
Population
4,050
Households
2.3
Avg Household Size
45
Median Age
33%
College-Educated
97%
High-School Grad
104.1 sq mi
ZIP Area
89
Density / Sq Mi
$95,307
Median Household Income
$49,705
Median Earnings
$1,178
Median Rent
$272,300
Median Home Value
Check the figures for this property
Cap Rate, Value Estimation, Potential NOI and more
View Realmo Analytics
Market
Vacancy Rate% for Retail in Midwest region

Frequently Asked Questions
What type of property is this?
Conventional restaurant - Fully operational restaurant and bar with commercial kitchen, liquor license, and multiple indoor and outdoor seating areas.
Where is this conventional restaurant located?
The property is located at 12227-12229 Seymour Road Grass Lake, MI.
What is the asking price?
The asking price for this property is $750,000.
What are key features of this property?
This property features: Fully operational restaurant/bar with included FF&E and a Class C liquor license; 3,414 SF commercial building plus a 1.09‑acre property with indoor dining and a covered outdoor patio; Fully equipped commercial kitchen and bar


