Former Senior Care
For Sale
$978,000
34 NE 20th Ave, Portland, OR 97232
Former senior care facility ideal for multifamily and senior living.
Property Size7,315 SF
Lot Size0.17 Acres
Price / SF$133.70
Days on Market253
Property Features for 34 NE 20th Ave
General Information
Standard status
Active
Size
7,315 SF
Lot size
0.17 Acres
Property subtype
Multifamily
Building Details
Building Size
7,315 SF
Year Built
1904
Listing Agency:
Capacity Commercial Group
Listed By:
Jason VanAbrams
(503) 314-1099
Source:
Capacitycommercial
Added: Jan 26
Changed: Sep 13
Last Checked: Oct 5 at 3:16PM
Displayed information is deemed reliable but is not guaranteed and should be independently verified. All listing content including descriptions, pricing, images are the copyrighted material of Capacity Commercial Group
Investment Insights
Based on property information with market context.
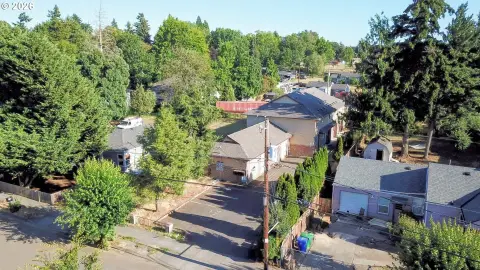
The property is a former senior care facility encompassing approximately 7,315 square feet across three floors, situated on a lot of approximately 7,500 square feet. The mixed-use (CM2) zoning allows for retail, office, multifamily, and limited manufacturing. It is located in NE Portland, with nearby attractions including Laurelhurst Park and the Lloyd Center. The location provides access to diverse dining, boutique shops, and cultural attractions. The vacant former care facility has room for up to 30 beds and is ideal for rehab, seniors, sober living, hostel, government, or nonprofit uses. There is potential for conversion to multifamily.
Key Highlights
- Mixed‑use (CM2) zoning allows for retail, office, multifamily, and limited manufacturing uses.
- Ideal for multifamily and senior living developments.
- Potential for conversion to multifamily.
Financial Insights
Estimated NOI and Cap Rate
NOI / Yr
$85,256
Cap Rate
8.72%
Suggested Prices Based on Cap Rates
Cap Rate 5%
$1,705,120
$1.7M
Cap Rate 7%
$1,217,943
$1.2M
Cap Rate 9%
$947,289
$947.3K
Market Conditions
NOI Build-Up for 7,315 SF
Gross rent
$131.7K $18.00/SF
− Vacancy
−$9.9K −$1.35/SF
EGI
$121.8K $16.65/SF
− OpEx
−$36.5K −$5.00/SF
NOI
$85.3K $11.66/SF
Area
Portland, OR
Vacancy
7.50%
Lease Rate
$18.00 /SF/Yr
Expense Ratio
30.00%
Simulate Cap Rate and NOI
Suggested Prices Based on Cap Rates
Cap Rate 5%
$1,705,120
Cap Rate 7%
$1,217,943
Cap Rate 9%
$947,289
Alternative Uses
Best Use
Office B
$1.35M
$1.18M – $1.58M
NOI $94,690 @ 7.0% cap · market cap 9.68%
Second Best
Apartment 5plus
$1.34M
$1.17M – $1.57M
NOI $93,924 @ 7.0% cap · market cap 9.60%
Theoretical Best
Office A
$2.05M
$1.80M – $2.40M
NOI $143,796 @ 7.0% cap · market cap 14.70%
Zoning and permitted uses should be independently verified with authorities.
Property Analytics
Unlock full access to Insights
Subscribe to Realmo Intelligence
Open Analytics
Current Use
Location Intelligence
Trade Area within ½ mile
3,757
Businesses Nearby
Under-served
Demand for This Use
Explore this area
Business Placement
Demographics for 97232, OR
15,382
Population
9,594
Households
1.6
Avg Household Size
37
Median Age
65%
College-Educated
96%
High-School Grad
1.9 sq mi
ZIP Area
8,096
Density / Sq Mi
$71,278
Median Household Income
$49,794
Median Earnings
$1,584
Median Rent
$801,300
Median Home Value
Check the figures for this property
Cap Rate, Value Estimation, Potential NOI and more
View Realmo Analytics
Market
Vacancy Rate% for Office in Portland, OR

Questions? Ask Rey
Realmo’s AI knows this listing — price, zoning, demand, history. Ask anything.







Similar Off Market Nearby
- Long Term Care Center — 3088 SE Stark St, Portland, OR 97214
Frequently Asked Questions
What type of property is this?
Senior housing / Retirement Home - Former senior care facility ideal for multifamily and senior living.
Where is this senior housing / retirement home located?
The property is located at 34 NE 20th Ave Portland, OR.
What is the asking price?
The asking price for this property is $978,000.
What are key features of this property?
This property features: Mixed‑use (CM2) zoning allows for retail, office, multifamily, and limited manufacturing uses.; Ideal for multifamily and senior living developments.; Potential for conversion to multifamily.