Single-Tenant Industrial
For Sale
$10,400,000
1216 W Amelia St, Orlando, FL 32805
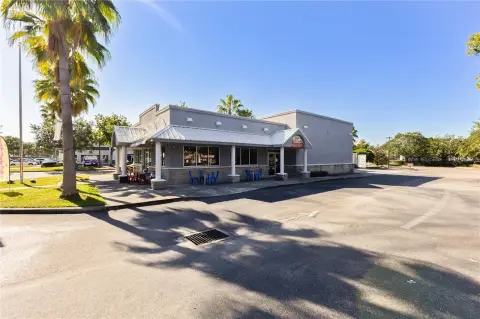
Fully leased industrial facility with multiple loading docks and drive-in doors on two parcels totaling 2.38 acres.
Property Size57,160 SF
Lot Size2.38 Acres
Price / SF$181.95
Days on Market94
Property Features for 1216 W Amelia St
General Information
Standard status
Active
Size
57,160 SF
Lot size
2.38 Acres
Property subtype
Single-Tenant Industrial
Occupancy
100%
Site & Location
Neighborhood
Lake Dot
Highway Access
Yes
Road Access
Yes
Outdoor Storage
Yes
Warehouse & Industrial
Dock-High Doors
5
Drive-In Doors
2
Additional Details
Cap Rate
6%
Amenities
LONG-TERM, CONTRACTUALLY GROWING NNN INCOME: The property is 100% leased to Memoir Agency LLC through July 31, 2031 on a net basis, with 3.5% annual rent escalations built into every lease year.
VALUE-ADD TWO-PARCEL FOOTPRINT WITH ADDITIONAL PARKING AND STORAGE: The offering includes a separate 0.77-acre parcel, diagonally across the intersection from the main 1.61-acre building parcel.
INFILL LOCATION POSITIONED AHEAD OF A CONSTRAINED SUPPLY PIPELINE: Orlando's industrial market is entering its slowest delivery pace in a decade, with 2026 inventory growth of just 1.1%.
RECENT CAPITAL INVESTMENT REDUCES NEAR-TERM CAPEX RISK: The roof was substantially upgraded in 2017 & 2020.
FUNCTIONAL INDUSTRIAL DESIGN WITH OUTSIZED LOADING: The building offers five truck-height loading docks and two drive-in doors.
Building Details
Building Size
57,160 SF
Year Built
1954
Construction
CMU
Tenancy
Single
Listing Agency:
Fort Lauderdale Office
Listed By:
Doug Mandel · License #License(s): FL: SL3090637
(954) 245-3465
Source:
Marcusmillichap
Added: Jul 24
Changed: Oct 23
Last Checked: Oct 24 at 1:32PM
Displayed information is deemed reliable but is not guaranteed and should be independently verified. All listing content including descriptions, pricing, images are the copyrighted material of Fort Lauderdale Office

Ask AI about this property
Review the available facts, identify missing information and prepare questions for the agent.
Investment Insights
Based on property information with market context.
1216 W Amelia Street is a 57,160-square-foot single-tenant industrial building built in 1954 and maintained over time. The structure features load-bearing CMU perimeter walls with a steel-framed roof. Recent capital improvements include a 2017 TPO roof replacement at the northeast corner and a 2020 spray-applied foam roof coating over the remaining warehouse and office areas, backed by a 20-year warranty.
The property consists of two non-contiguous parcels totaling 2.38 acres at the intersection of W Amelia Street and Hames Avenue. The southeast corner parcel (1.61 acres) includes the building, five truck-height loading docks, and two drive-in doors. The separate northwest corner parcel (0.77 acres) provides additional paved parking and open outdoor storage to support expanded yard capacity.
The facility is fully leased to Memoir Agency LLC under a long-term NNN lease commencing May 1, 2026 through July 31, 2031, with 3.5% annual rent escalations. The location provides immediate access to Downtown Orlando and the I-4 corridor, positioned just west of Interstate 4 and Orange Blossom Trail.
The property consists of two non-contiguous parcels totaling 2.38 acres at the intersection of W Amelia Street and Hames Avenue. The southeast corner parcel (1.61 acres) includes the building, five truck-height loading docks, and two drive-in doors. The separate northwest corner parcel (0.77 acres) provides additional paved parking and open outdoor storage to support expanded yard capacity.
The facility is fully leased to Memoir Agency LLC under a long-term NNN lease commencing May 1, 2026 through July 31, 2031, with 3.5% annual rent escalations. The location provides immediate access to Downtown Orlando and the I-4 corridor, positioned just west of Interstate 4 and Orange Blossom Trail.
Key Highlights
- 57,160 SF single‑tenant industrial building built in 1954 and fully leased to Memoir Agency LLC on a long‑term NNN lease.
- Lease term runs from May 1, 2026 through July 31, 2031 with 3.5% annual rent escalations.
- Roof improvements include a 2017 TPO roof replacement and a 2020 spray‑applied foam roof coating with a 20‑year warranty.
Financial Insights
Estimated NOI and Cap Rate
NOI / Yr
$387,734
Cap Rate
3.73%
Suggested Prices Based on Cap Rates
Cap Rate 5%
$7,754,680
$7.8M
Cap Rate 7%
$5,539,057
$5.5M
Cap Rate 9%
$4,308,156
$4.3M
Market Conditions
NOI Build-Up for 57,160 SF
Gross rent
$500.7K $8.76/SF
− Vacancy
−$44.6K −$0.78/SF
EGI
$456.2K $7.98/SF
− OpEx
−$68.4K −$1.20/SF
NOI
$387.7K $6.78/SF
Area
Orlando, FL
Vacancy
8.90%
Lease Rate
$8.76 /SF/Yr
Expense Ratio
15.00%
Simulate Cap Rate and NOI
Suggested Prices Based on Cap Rates
Cap Rate 5%
$7,754,680
Cap Rate 7%
$5,539,057
Cap Rate 9%
$4,308,156
Alternative Uses
Best Use
Warehouse
$5.54M
$4.85M – $6.46M
NOI $387,734 @ 7.0% cap · market cap 3.73%
Second Best
Industrial
$4.56M
$3.99M – $5.32M
NOI $319,310 @ 7.0% cap · market cap 3.07%
Theoretical Best
Office A
$18.41M
$16.11M – $21.48M
NOI $1,288,926 @ 7.0% cap · market cap 12.39%
Zoning and permitted uses should be independently verified with authorities.
How Realmo checks its estimates
Property Analytics
Who owns this building?
See the owner, sales and loan history
Open Analytics
Current Use
Lease Details
5
Dock-high doors
2
Drive-in doors
100%
Occupancy
Single-tenant
Tenancy
Yes
Highway access
Yes
Paved road access
Location Intelligence
Trade Area within ½ mile
1,763
Businesses Nearby
Explore this area
Business Placement
Demographics for 32805, FL
23,331
Population
9,332
Households
2.5
Avg Household Size
39
Median Age
16%
College-Educated
78%
High-School Grad
6.8 sq mi
ZIP Area
3,431
Density / Sq Mi
$39,425
Median Household Income
$29,592
Median Earnings
$1,112
Median Rent
$226,100
Median Home Value
Check the figures for this property
Cap Rate, Value Estimation, Potential NOI and more
View Realmo Analytics
Market
Vacancy Rate% for Industrial in Orlando, FL



Frequently Asked Questions
What type of property is this?
Distribution center - Fully leased industrial facility with multiple loading docks and drive-in doors on two parcels totaling 2.38 acres.
Where is this distribution center located?
The property is located at 1216 W Amelia St Orlando, FL.
What is the asking price?
The asking price for this property is $10,400,000.
What are key features of this property?
This property features: 57,160 SF single‑tenant industrial building built in 1954 and fully leased to Memoir Agency LLC on a long‑term NNN lease.; Lease term runs from May 1, 2026 through July 31, 2031 with 3.5% annual rent escalations.; Roof improvements include a 2017 TPO roof replacement and a 2020 spray‑applied foam roof coating with a 20‑year warranty.