Historic Mixed-Use
For Sale
$575,000
1216 Bienville St, New Orleans, LA 70112
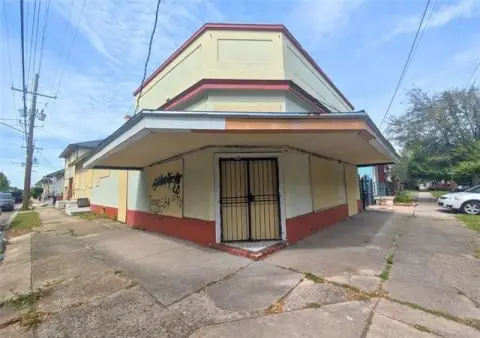
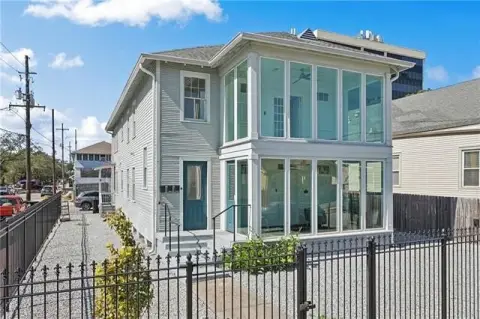
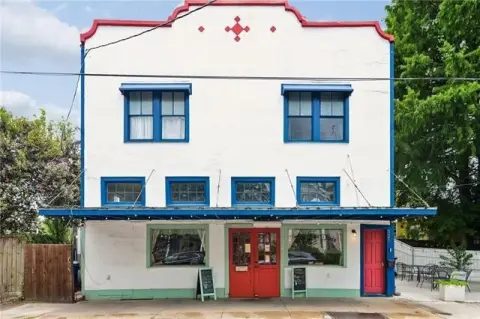
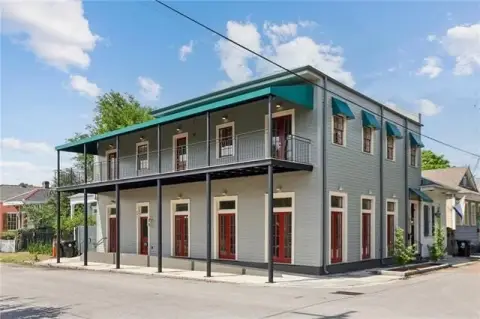
Two-level property with approved renovation plans, adaptable commercial space, and a planned three-bedroom residential layout.
Property Size4,237 SF
Price / SF$135.71
Days on Market198
Property Features for 1216 Bienville St
General Information
Standard status
Active
Size
4,237 SF
Property subtype
Retail
Zoning
HU-MU
Building Details
Year Built
1897
Listing Agency:
Z Group, LLC
Listed By:
Zella May · License #995704404
(504) 494-4463
Source:
Lacdb.resimplifi
Added: Apr 1
Changed: Oct 9
Last Checked: Oct 14 at 7:44PM
Displayed information is deemed reliable but is not guaranteed and should be independently verified. All listing content including descriptions, pricing, images are the copyrighted material of Z Group, LLC

Ask AI about this property
Review the available facts, identify missing information and prepare questions for the agent.
Investment Insights
Based on property information with market context.
Built in 1897, this mixed-use property contains 4,237 square feet across a ground-floor commercial area and an upper-level residential component. The first floor is currently vacant and was formerly configured as a convenience store, with plans identifying restaurant, retail, or office conversion options. Architectural drawings by Adamick Architecture include a restaurant concept for the commercial level and a three-bedroom, two-bath apartment design upstairs.
The renovation has received approvals from the Historic District Landmarks Commission and the Department of Safety and Permits. Federal and State Historic Tax Credits have also been approved for Part I and Part II work. Zoned HU-MU, the property is at 1216 Bienville St in New Orleans, near Basin Street, Canal Street, and the French Quarter.
The sale includes the architectural plans for both floors, providing a defined framework for renovation of the historic structure.
The renovation has received approvals from the Historic District Landmarks Commission and the Department of Safety and Permits. Federal and State Historic Tax Credits have also been approved for Part I and Part II work. Zoned HU-MU, the property is at 1216 Bienville St in New Orleans, near Basin Street, Canal Street, and the French Quarter.
The sale includes the architectural plans for both floors, providing a defined framework for renovation of the historic structure.
Key Highlights
- 4,237‑square‑foot mixed‑use property built in 1897
- Ground floor is vacant with plans for restaurant, retail, or office conversion
- Second‑floor plans show a three‑bedroom, two‑bath apartment
Financial Insights
Estimated NOI and Cap Rate
NOI / Yr
$52,318
Cap Rate
9.10%
Suggested Prices Based on Cap Rates
Cap Rate 5%
$1,046,360
$1.0M
Cap Rate 7%
$747,400
$747.4K
Cap Rate 9%
$581,311
$581.3K
Market Conditions
NOI Build-Up for 4,237 SF
Gross rent
$76.3K $18.00/SF
− Vacancy
−$1.5K −$0.36/SF
EGI
$74.7K $17.64/SF
− OpEx
−$22.4K −$5.29/SF
NOI
$52.3K $12.35/SF
Area
New Orleans, LA
Vacancy
2.00%
Lease Rate
$18.00 /SF/Yr
Expense Ratio
30.00%
Simulate Cap Rate and NOI
Suggested Prices Based on Cap Rates
Cap Rate 5%
$1,046,360
Cap Rate 7%
$747,400
Cap Rate 9%
$581,311
Alternative Uses
Best Use
Mixed Use
$817.1K
$715.0K – $953.3K
NOI $57,200 @ 7.0% cap · market cap 9.95%
Second Best
Retail
$747.4K
$654.0K – $872.0K
NOI $52,318 @ 7.0% cap · market cap 9.10%
Theoretical Best
Office A
$1.08M
$942.3K – $1.26M
NOI $75,383 @ 7.0% cap · market cap 13.11%
Zoning and permitted uses should be independently verified with authorities.
How Realmo checks its estimates
Property Analytics
Unlock full access to Insights
Subscribe to Realmo Intelligence
Open Analytics
Current Use
Location Intelligence
Trade Area within ½ mile
8,709
Businesses Nearby
272k
Monthly Visits Nearby
Explore this area
Business Placement
Foot Traffic Nearby
Hotels & Casinos 69%
Shops & Services 13%
Dining 9%
Apparel 4%
The Ritz-Carlton, New Orleans
Hotels & Casinos
59,768 visits/mo
0.3 miles
Chevron
Shops & Services
23,516 visits/mo
0.2 miles
Holiday Inn New Orleans-Downtown Superdome
Hotels & Casinos
20,500 visits/mo
0.4 miles
Wyndham New Orleans - French Quarter
Hotels & Casinos
15,753 visits/mo
0.5 miles
Hampton Inn & Suites New Orleans Downtown
Hotels & Casinos
15,344 visits/mo
0.5 miles
Demographics for 70112, LA
4,988
Population
3,711
Households
1.3
Avg Household Size
35
Median Age
44%
College-Educated
91%
High-School Grad
1.0 sq mi
ZIP Area
4,988
Density / Sq Mi
$23,052
Median Household Income
$36,029
Median Earnings
$1,063
Median Rent
$398,400
Median Home Value
Check the figures for this property
Cap Rate, Value Estimation, Potential NOI and more
View Realmo Analytics
Market
Vacancy Rate% for Retail in New Orleans, LA






Frequently Asked Questions
What type of property is this?
Mixed-use property - Two-level property with approved renovation plans, adaptable commercial space, and a planned three-bedroom residential layout.
Where is this mixed-use property located?
The property is located at 1216 Bienville St New Orleans, LA.
What is the asking price?
The asking price for this property is $575,000.
What are key features of this property?
This property features: 4,237‑square‑foot mixed‑use property built in 1897; Ground floor is vacant with plans for restaurant, retail, or office conversion; Second‑floor plans show a three‑bedroom, two‑bath apartment


