Renovated Two-Family House in
For Sale
$690,000
Pending
2524 RADCLIFF Ave The, Bronx, NY 10469
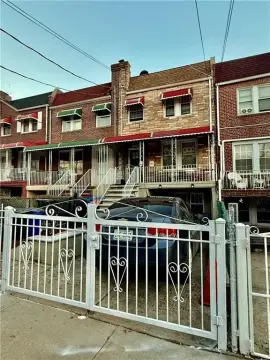
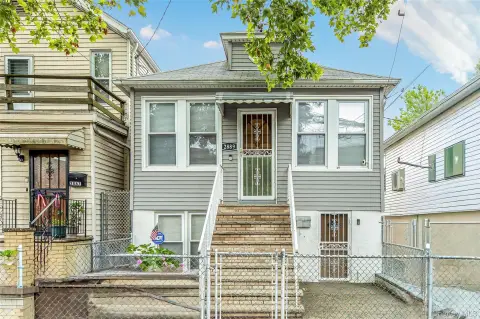
Renovated two-family house with rental income potential in Bronxwood.
Property Size1,800 SF
Lot Size0.04 Acres
Days on Market314
Property Features for 2524 RADCLIFF Ave The
General Information
Standard status
Pending
Size
1,800 SF
Lot size
0.04 Acres
Property subtype
Multi Family
Taxes and HOA fees
Annual Taxes
$6,348
Building Details
Building Size
1,800 SF
Year Built
1965
Units
2
Listing Agency:
Brown Harris Stevens Residential Sales LLC
Listed By:
Traci Byers
(212) 381-2578
Source:
Elliman
Added: Nov 28, 2025
Changed: Oct 4
Last Checked: Oct 7 at 12:23PM
Displayed information is deemed reliable but is not guaranteed and should be independently verified. All listing content including descriptions, pricing, images are the copyrighted material of Brown Harris Stevens Residential Sales LLC
Investment Insights
Based on property information with market context.
Located on Radcliff Avenue in Bronxwood, this renovated two-family house presents an opportunity for homeowners and investors. Constructed in 1965, the two-story home features two separate units. The upper floor includes 3 bedrooms and 1.5 baths. The ground-level unit is a studio with its own entrance, kitchen, and full bath. The property also features a garage, private driveway, large deck, and a spacious backyard. The location provides convenient access to public transportation and major highways, with restaurants, shops, parks, and schools nearby.
Key Highlights
- Renovated two‑family house in Bronxwood.
- Two separate units: 3‑bedroom, 1.5‑bath unit and a studio apartment with a full bath, kitchen, and private entrance, offering flexibility for homeowners or rental income.
- Large deck and spacious backyard** are ideal for outdoor gatherings and relaxation.
Financial Insights
Estimated NOI and Cap Rate
NOI / Yr
$45,723
Cap Rate
6.63%
Suggested Prices Based on Cap Rates
Cap Rate 5%
$914,460
$914.5K
Cap Rate 7%
$653,186
$653.2K
Cap Rate 9%
$508,033
$508.0K
Market Conditions
NOI Build-Up for 1,800 SF
Gross rent
$69.1K $38.40/SF
− Vacancy
−$3.8K −$2.11/SF
EGI
$65.3K $36.29/SF
− OpEx
−$19.6K −$10.89/SF
NOI
$45.7K $25.40/SF
Area
Bronx, NY
Vacancy
5.50%
Lease Rate
$38.40 /SF/Yr
Expense Ratio
30.00%
Simulate Cap Rate and NOI
Suggested Prices Based on Cap Rates
Cap Rate 5%
$914,460
Cap Rate 7%
$653,186
Cap Rate 9%
$508,033
Alternative Uses
Best Use
Multifamily LT 5
$653.2K
$571.5K – $762.1K
NOI $45,723 @ 7.0% cap · market cap 6.63%
Second Best
Apartment 5plus
$591.5K
$517.6K – $690.1K
NOI $41,407 @ 7.0% cap · market cap 6.00%
Theoretical Best
Warehouse
$1.25M
$1.09M – $1.46M
NOI $87,309 @ 7.0% cap · market cap 12.65%
Zoning and permitted uses should be independently verified with authorities.
Property Analytics
Unlock full access to Insights
Subscribe to Realmo Intelligence
Open Analytics
Current Use
Location Intelligence
Trade Area within ½ mile
2,850
Businesses Nearby
Explore this area
Business Placement
Demographics for 10469, NY
71,571
Population
25,082
Households
2.9
Avg Household Size
39
Median Age
29%
College-Educated
83%
High-School Grad
2.4 sq mi
ZIP Area
29,821
Density / Sq Mi
$76,018
Median Household Income
$45,857
Median Earnings
$1,653
Median Rent
$640,400
Median Home Value
Check the figures for this property
Cap Rate, Value Estimation, Potential NOI and more
View Realmo Analytics
Market
Vacancy Rate% for Multifamily in Northeast region

Questions? Ask Rey
Realmo’s AI knows this listing — price, zoning, demand, history. Ask anything.






Frequently Asked Questions
What type of property is this?
Duplex - Renovated two-family house with rental income potential in Bronxwood.
Where is this duplex located?
The property is located at 2524 RADCLIFF Ave The Bronx, NY.
What is the asking price?
The asking price for this property is $690,000.
What are key features of this property?
This property features: Renovated two‑family house in Bronxwood.; Two separate units: **3‑bedroom, 1.5‑bath unit and a studio apartment** with a full bath, kitchen, and private entrance, offering flexibility for homeowners or rental income.; Large deck and spacious backyard** are ideal for outdoor gatherings and relaxation.


