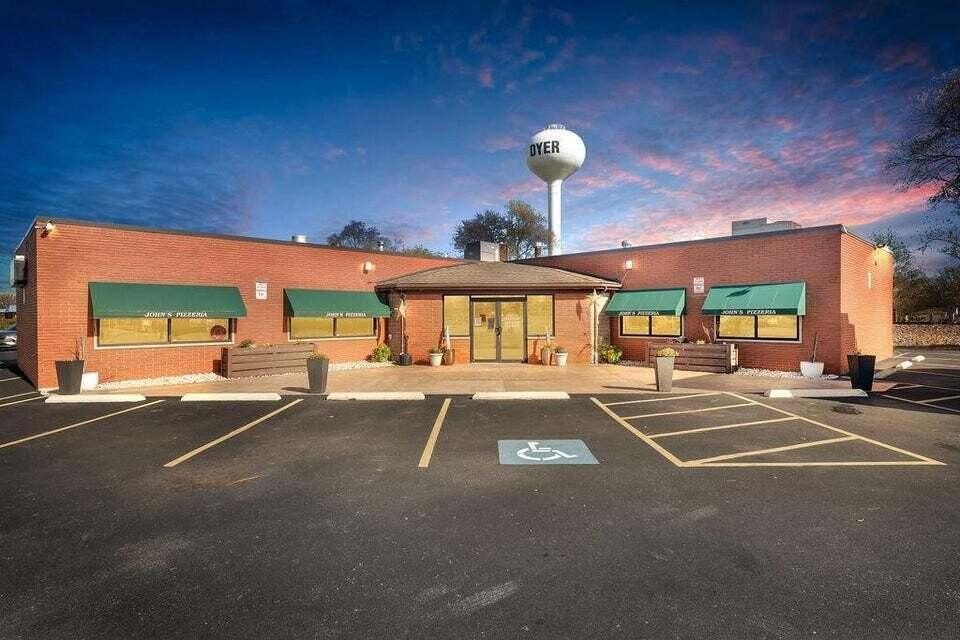
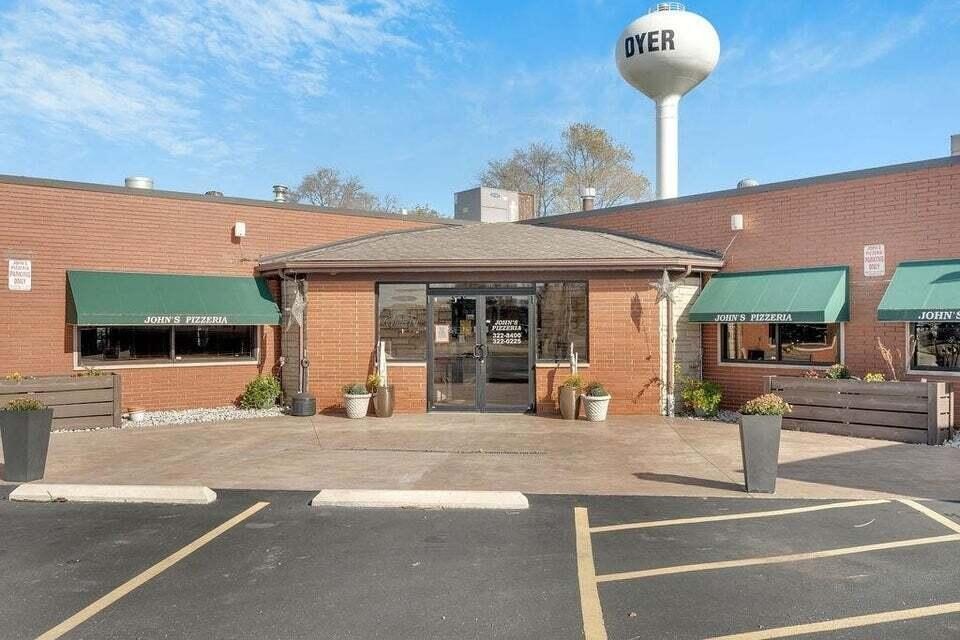
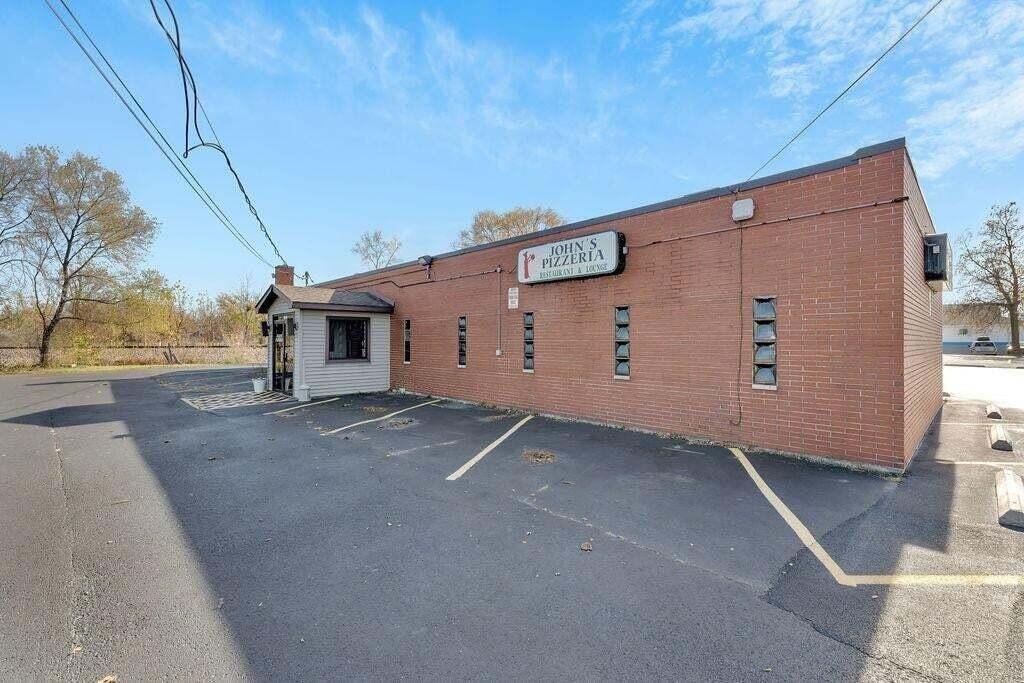
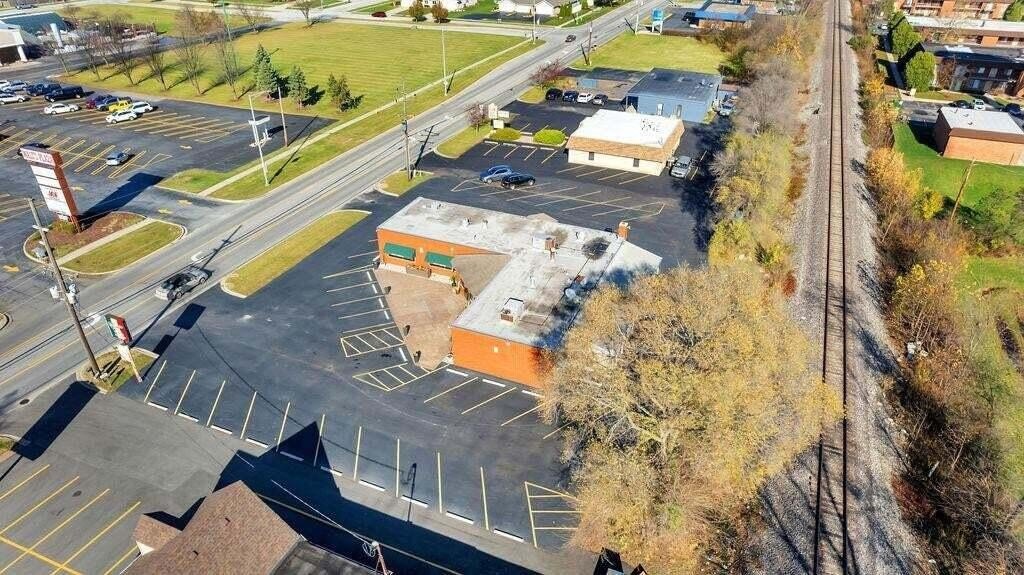
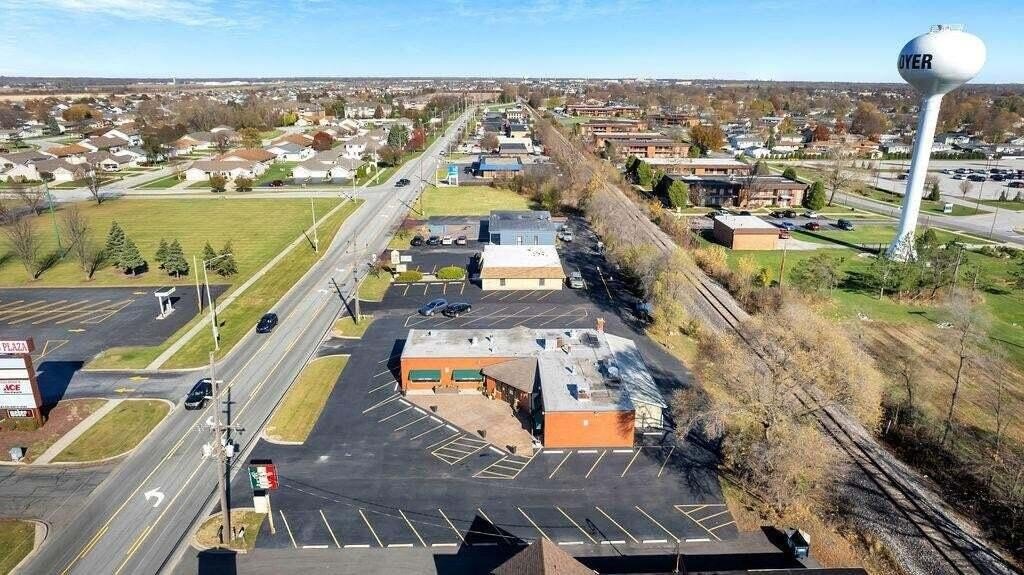
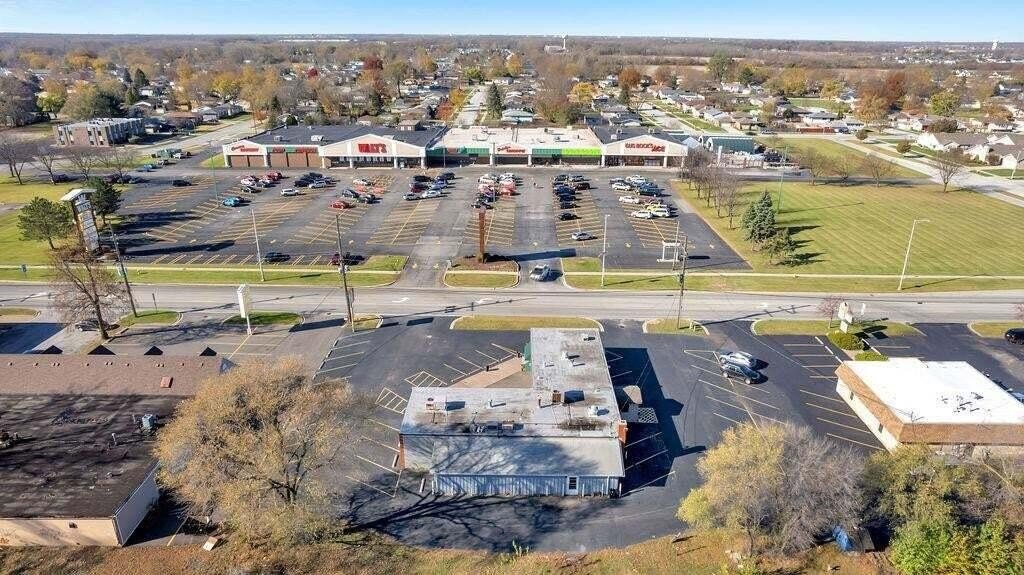
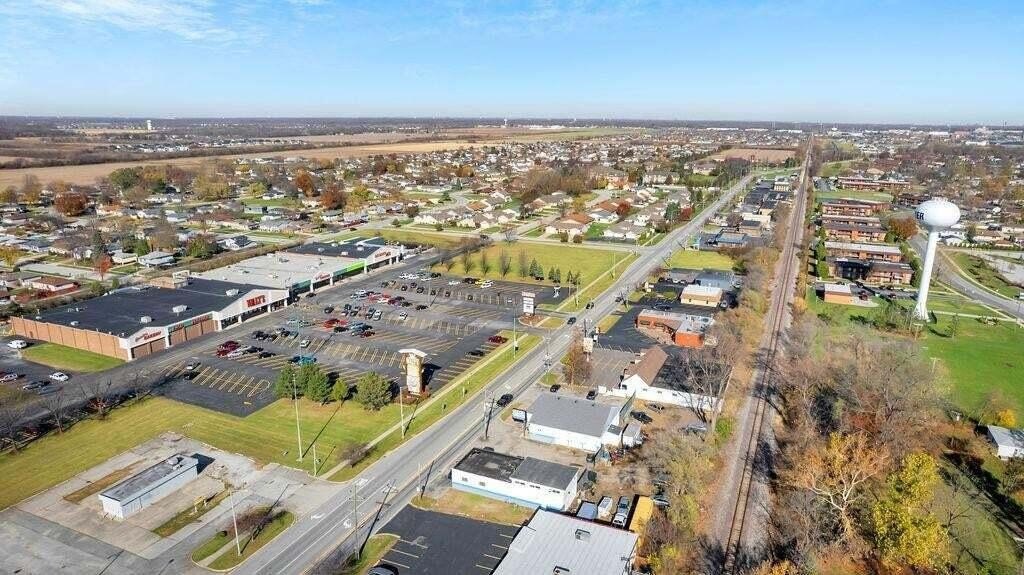
Brick Restaurant Building with

For Sale
$649,900
1209 Sheffield Avenue, Dyer, IN 46311
Commercial Sale, Dyer, IN
Property Size3,970 SF
Lot Size0.68 Acres
Price / SF$163.70
Days on Market683
Property Features for 1209 Sheffield Avenue
General Information
Property type
Commercial Sale
Property subtype
Other
Zoning description
Commercial
Parking
35
Security features
Security Lighting
Interior features
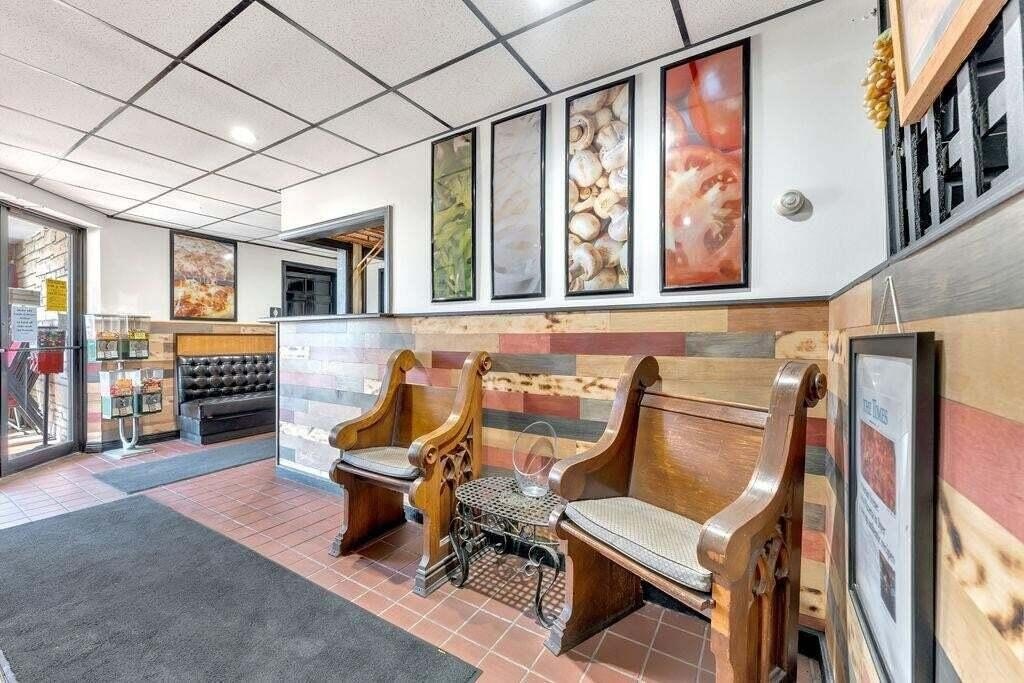
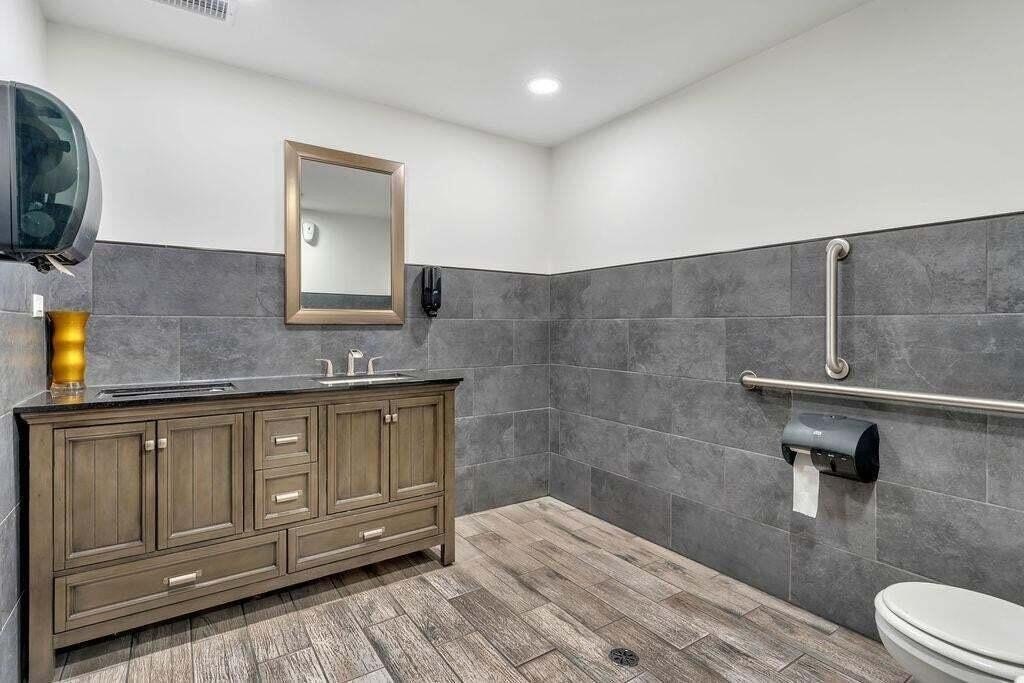
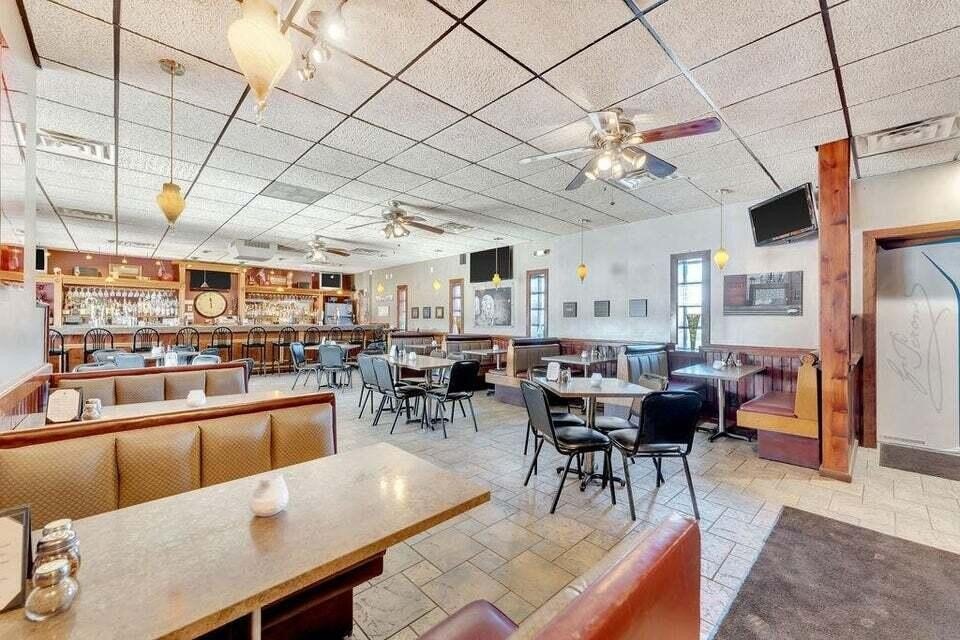
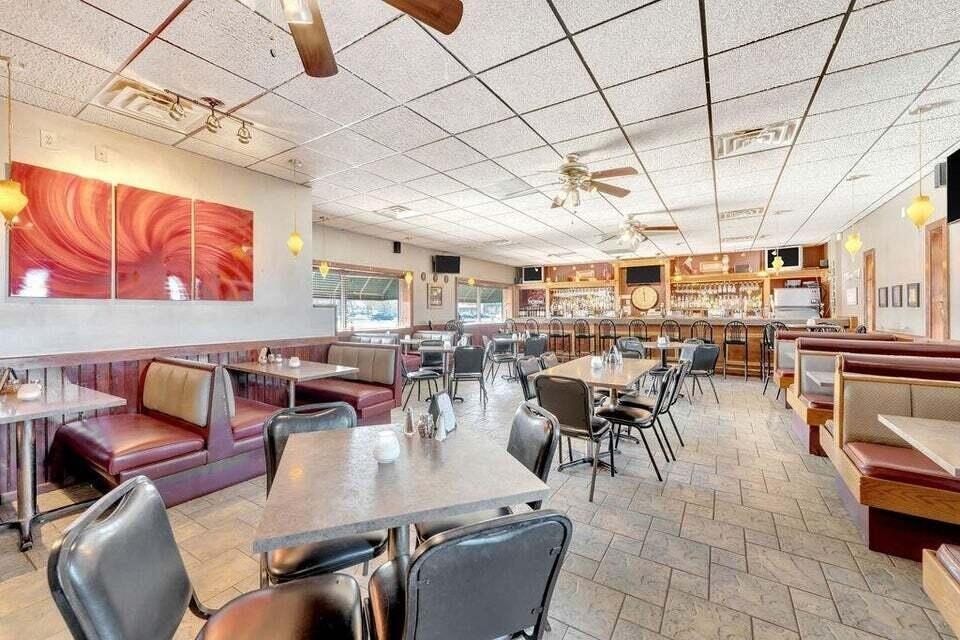
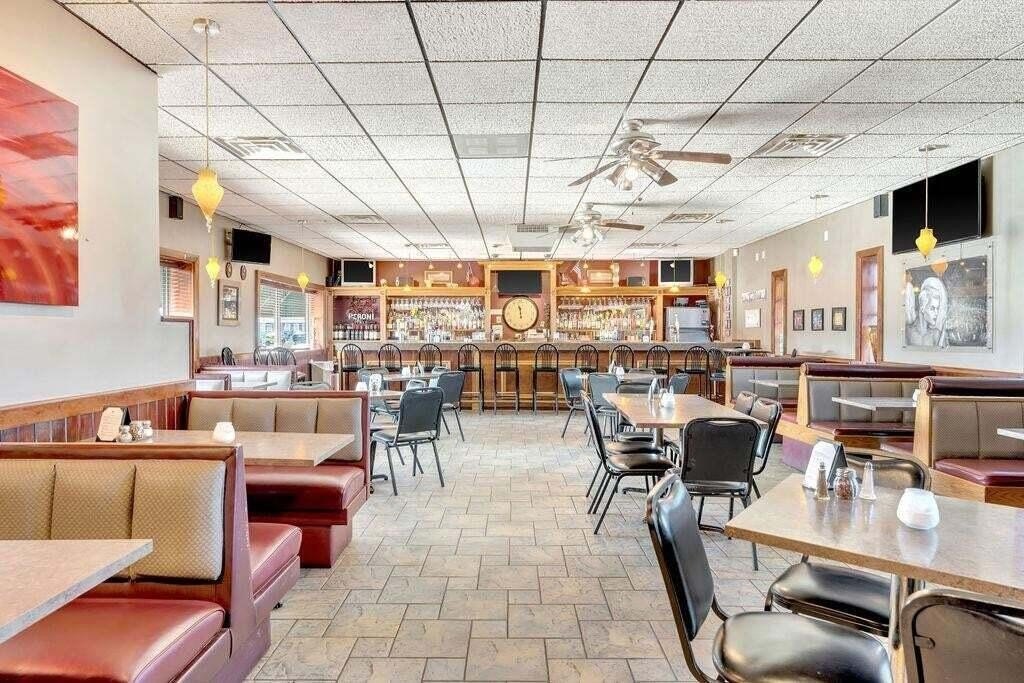
Ceiling Fan(s), Recessed Lighting, High Ceilings, Entrance Foyer
Exterior features
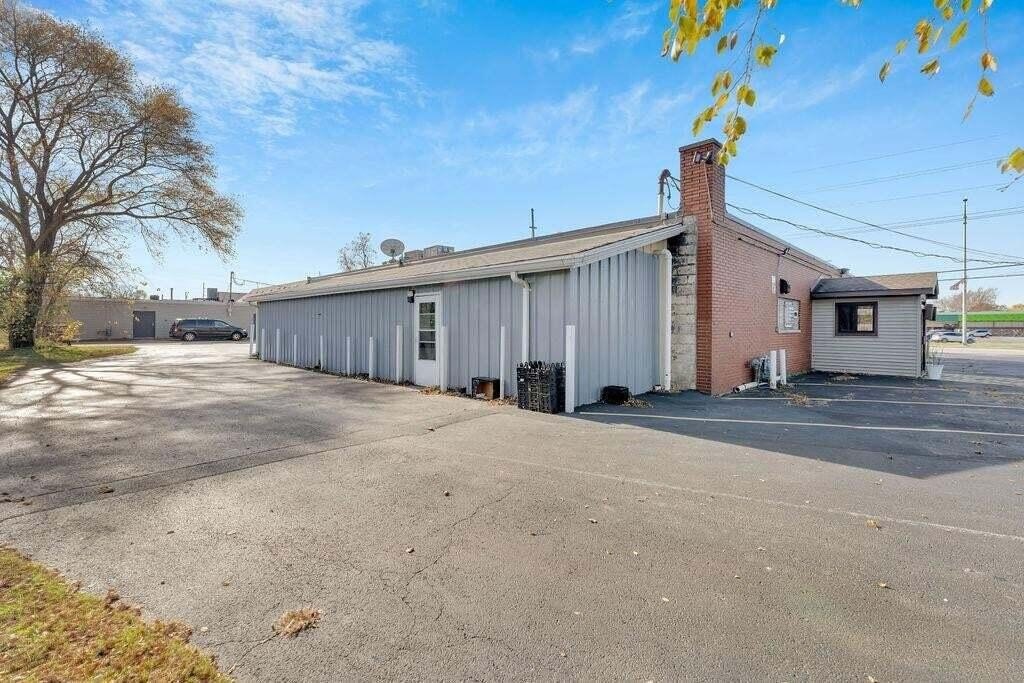
Lighting, Storage
Lot features
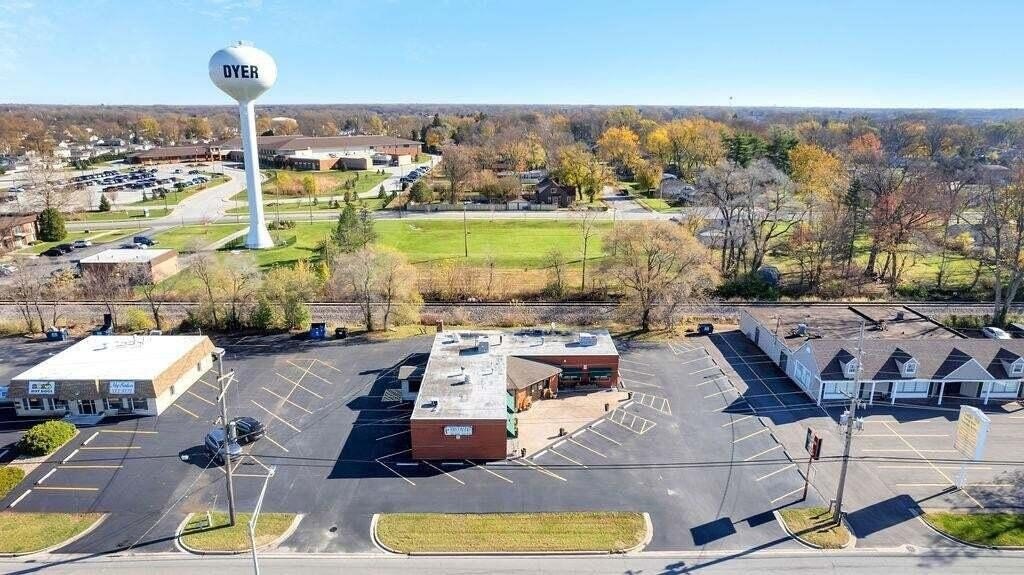
Landscaped, Paved
Directions
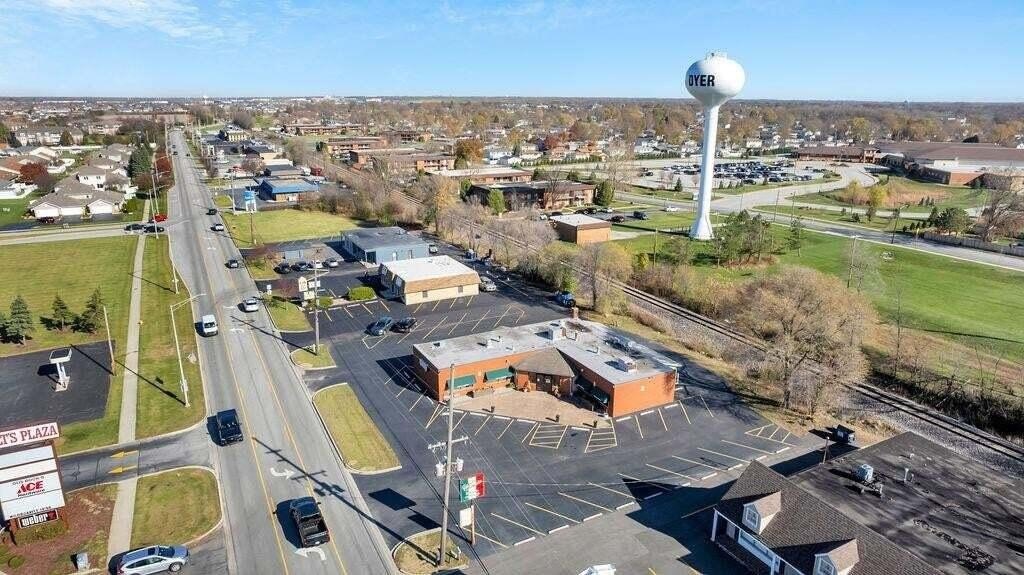
Head West on I-94 then take exit 1 South. Continue South on Calumet Ave, then West on Columbia Ave which turns to Sheffield Ave. Property is on East side of road.
Standard status
Active
APN
451001451007000034
Size
3,970 SF
Lot size
0.68 Acres
Taxes and HOA fees
Tax Year
2023
Tax Description
N.150FT. OF S.642FT. OF S.120A. OF SE W. OF W. LINE C.I. & L. R.R S.1 T.35 R.10 .60A.
Tax Annual Amount
6092
Legal Description
N.150FT. OF S.642FT. OF S.120A. OF SE W. OF W. LINE C.I. & L. R.R S.1 T.35 R.10 .60A.
Utilities
Sewer type
Public Sewer
Heating system
Forced Air
Water source
Public
Building Details
Year built
1962
Additional Structures
Storage
Listing Agency:
Listing Leaders
(219) 462-5478
Listed By:
Nikola Trajceski · License #RB19001195
(219) 765-7595
Added: Nov 11, 2024
Changed: Sep 8
Last Checked: Sep 25 at 7:06AM
MLS# 812823
Copyright © 2026 Greater Northwest Indiana Association of REALTORS. All rights reserved. All information provided by the listing agent/broker is deemed reliable but is not guaranteed and should be independently verified.
Investment Insights
Based on property information with market context.
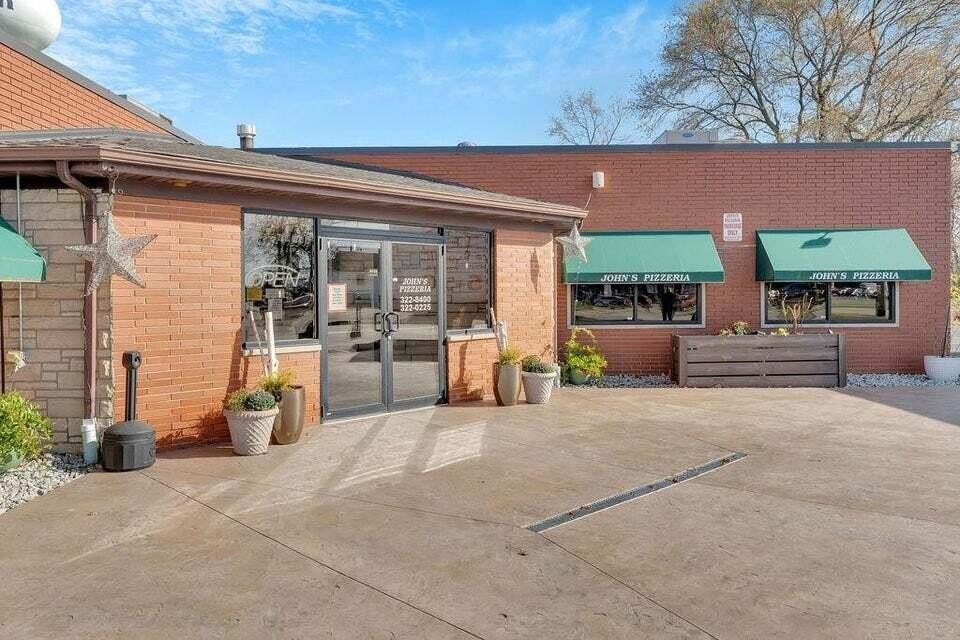
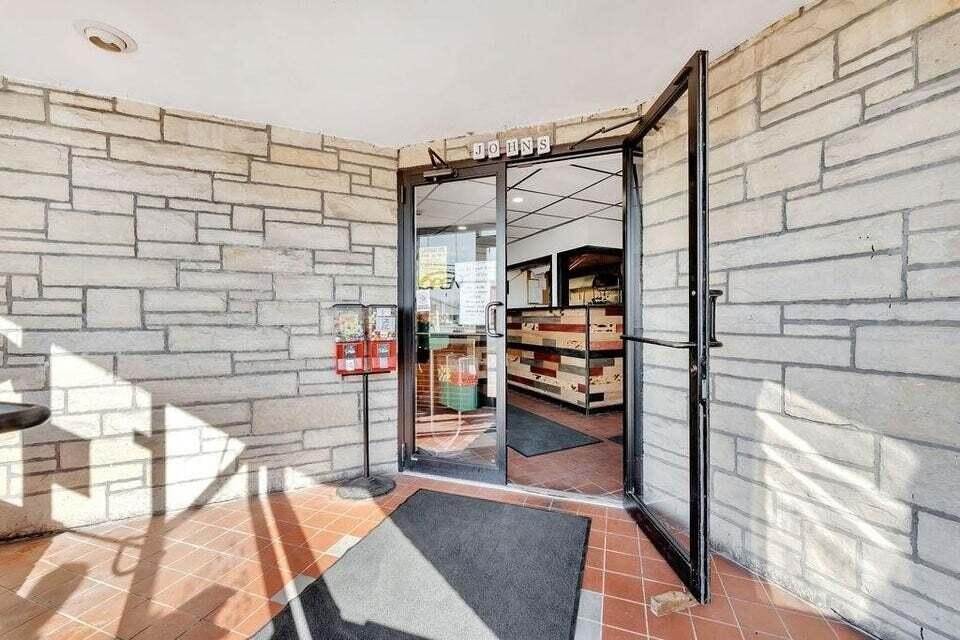
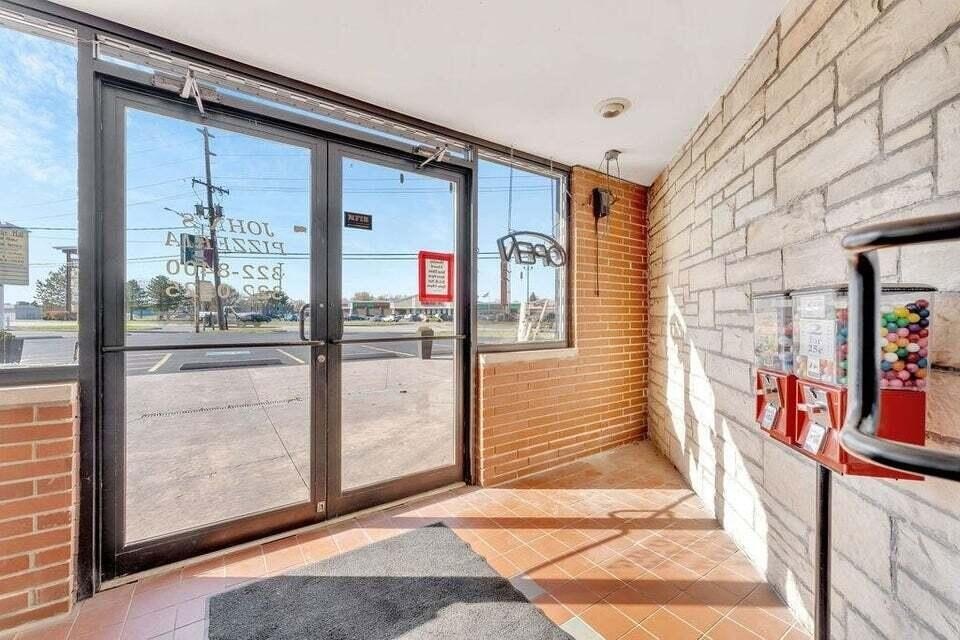
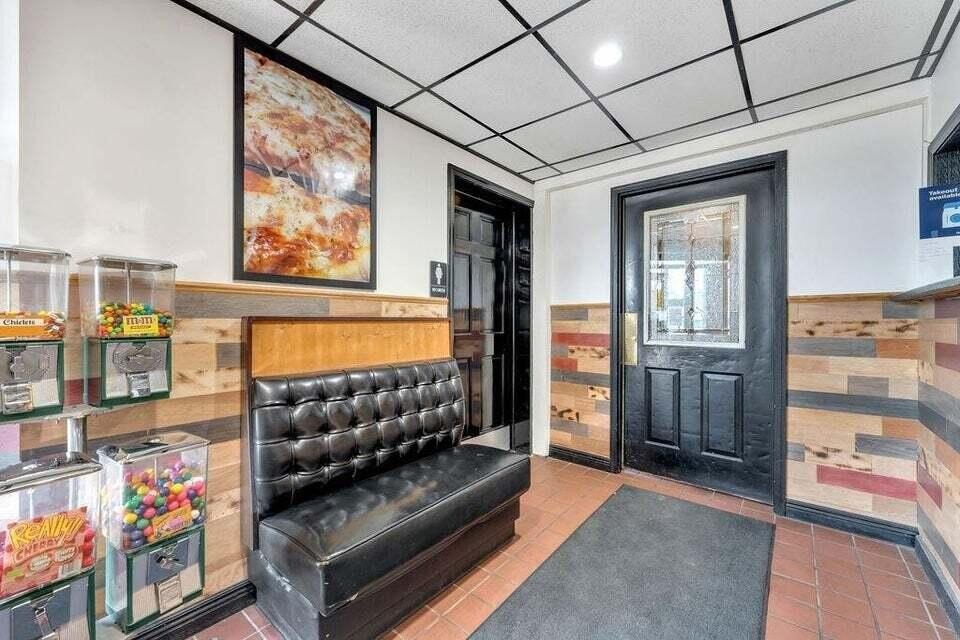
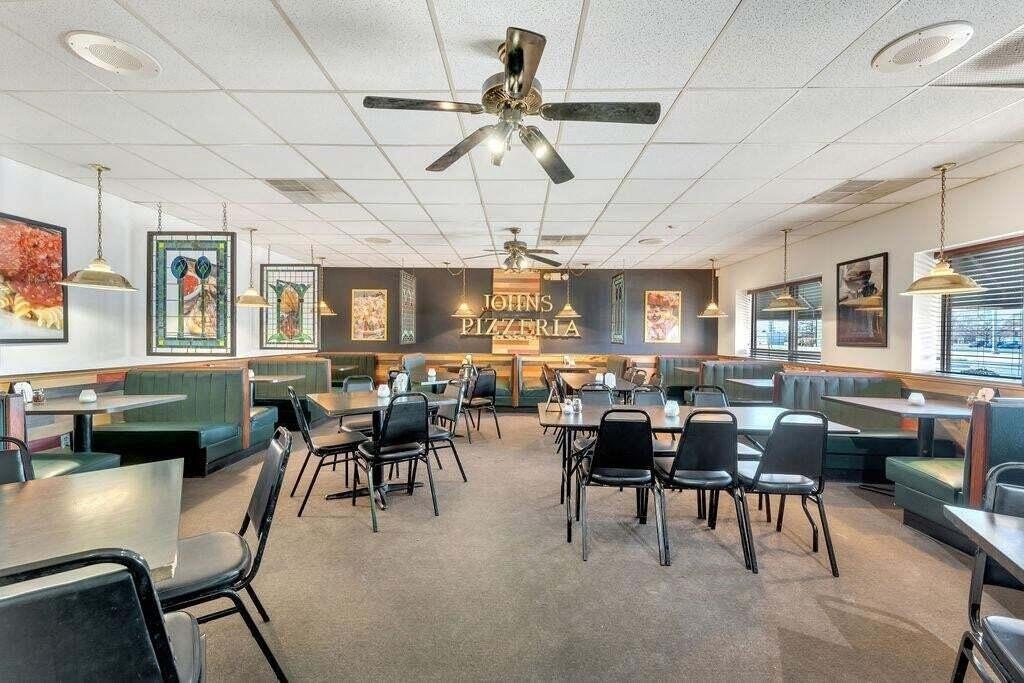
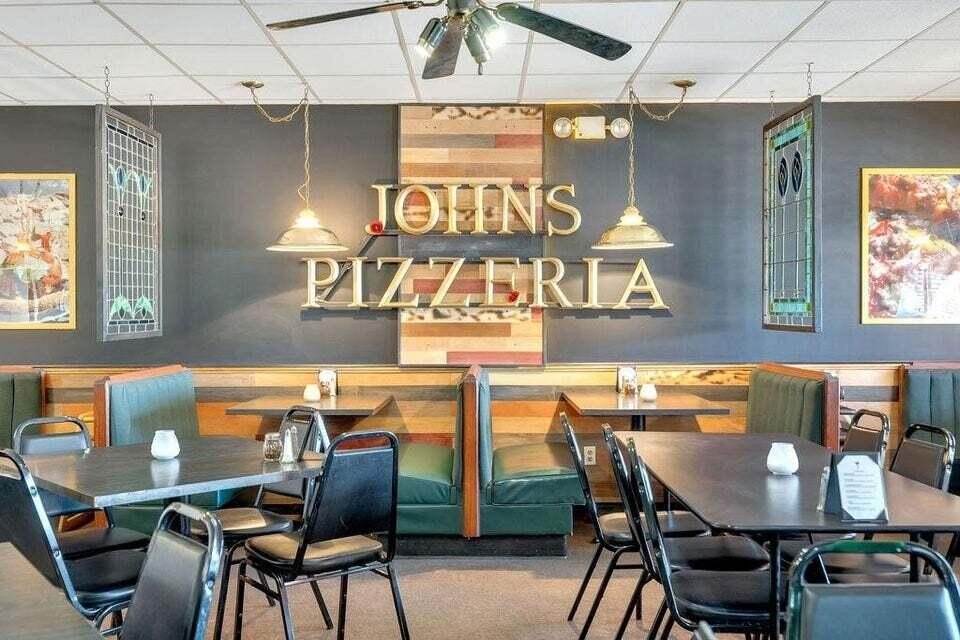
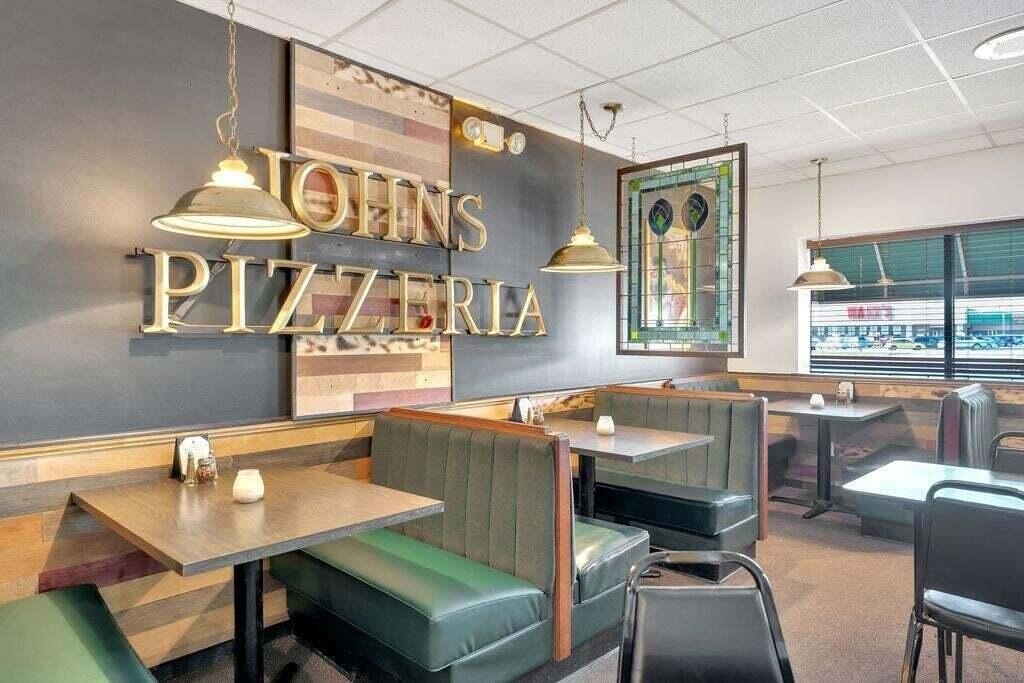
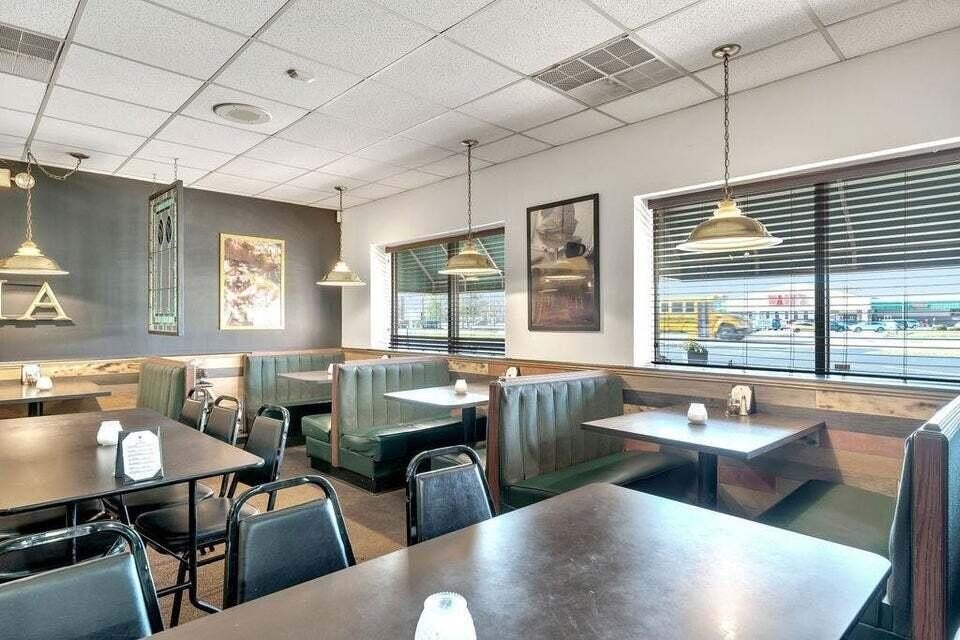
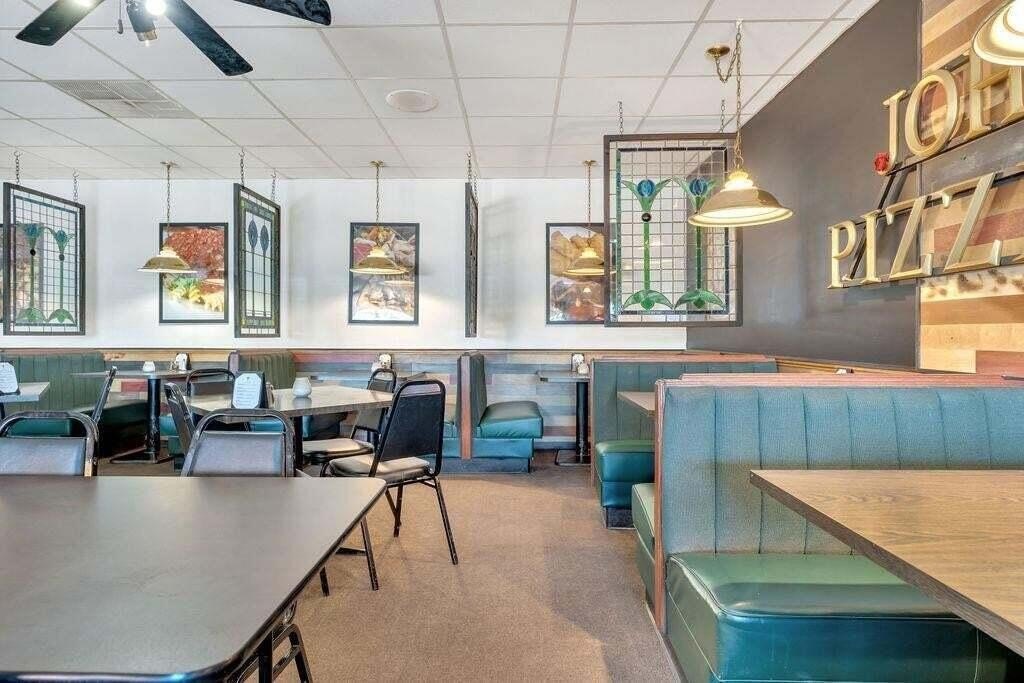
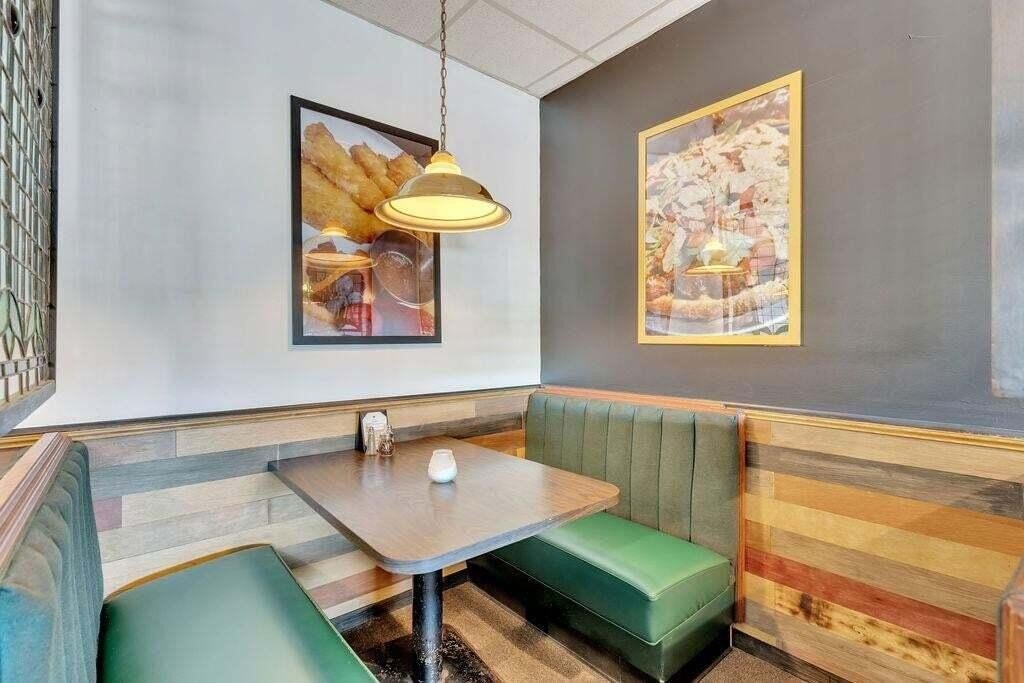
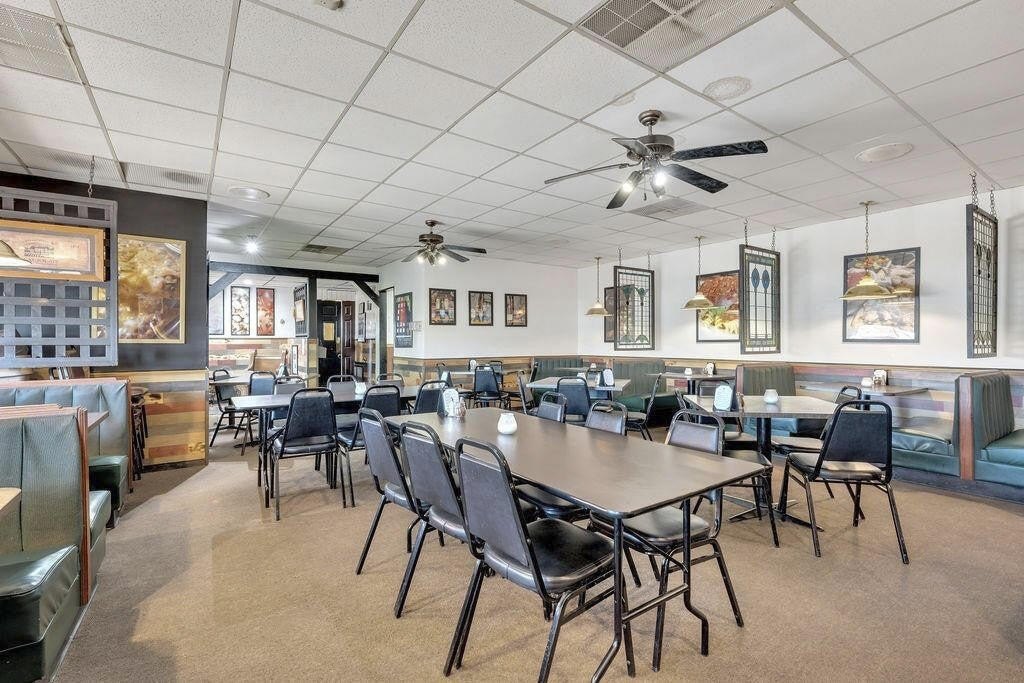
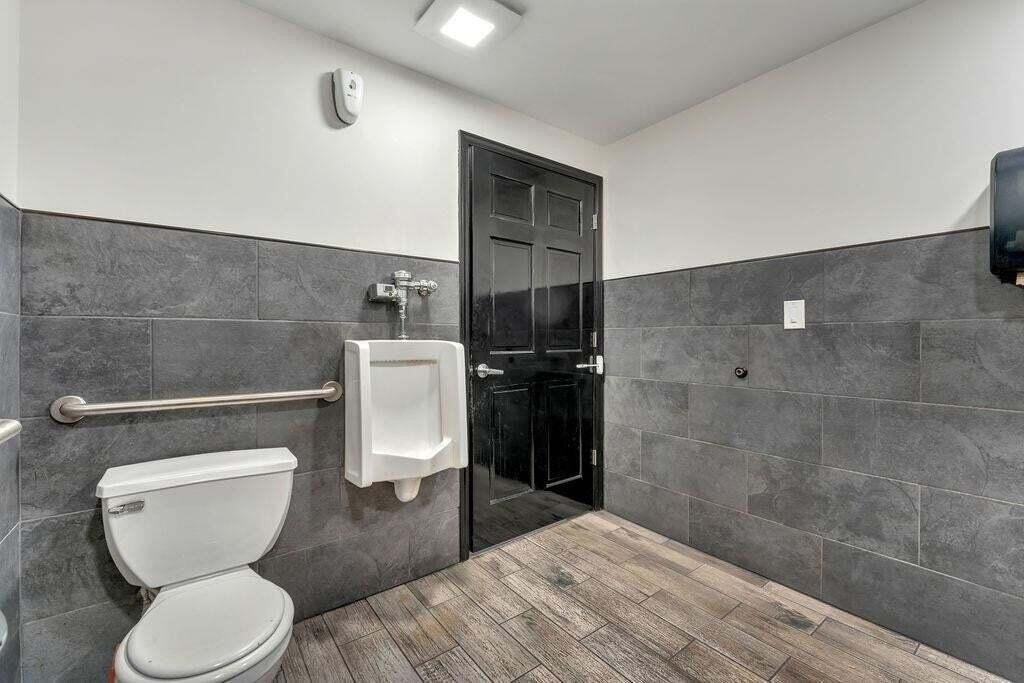
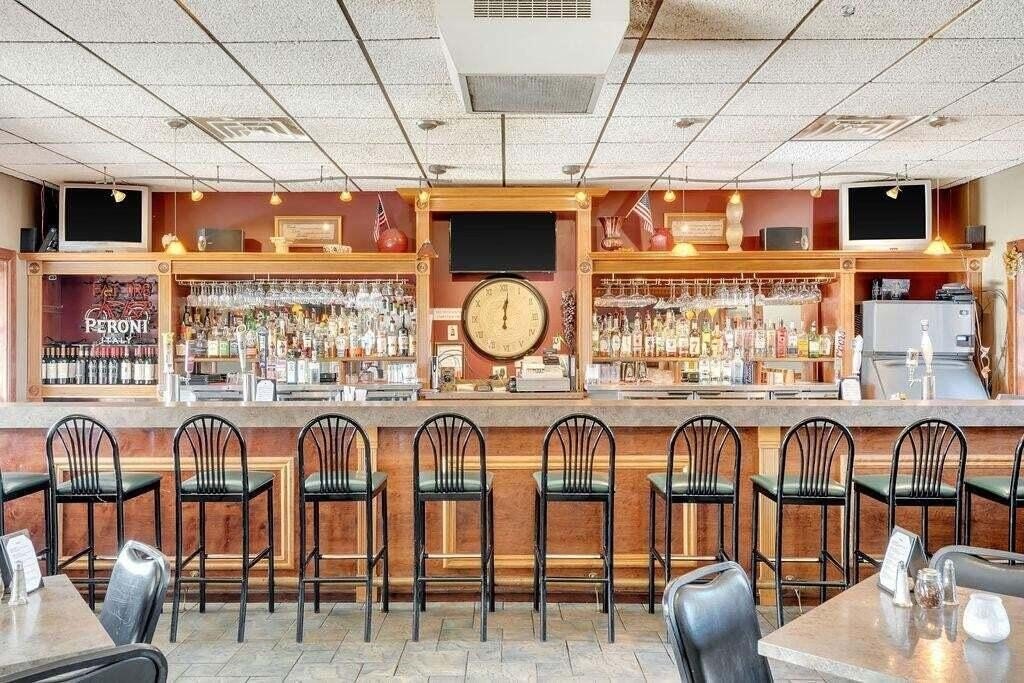
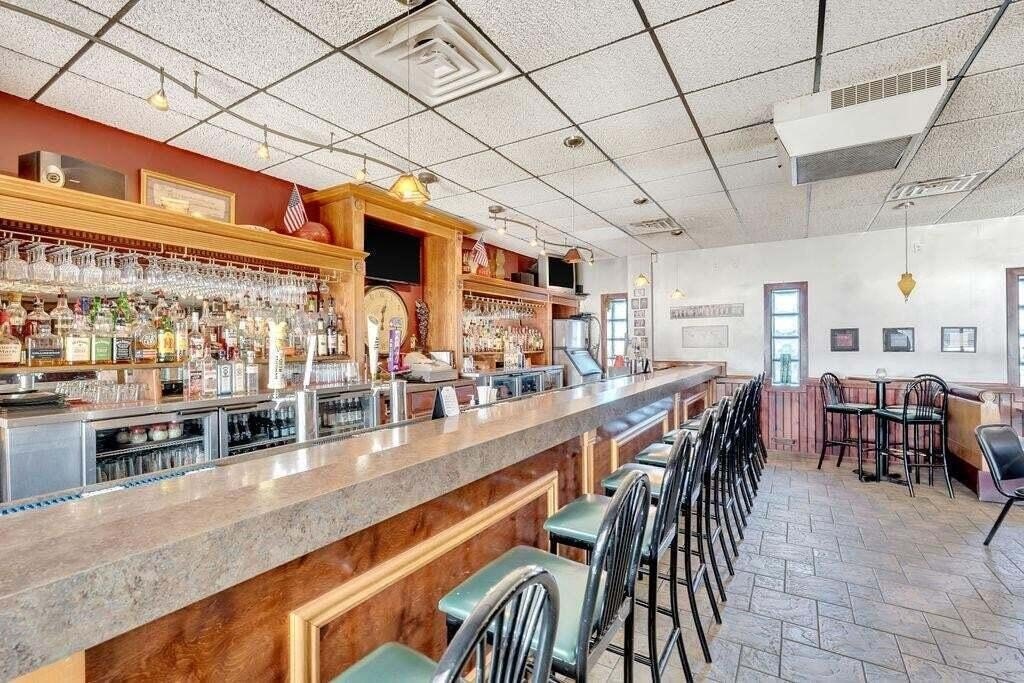
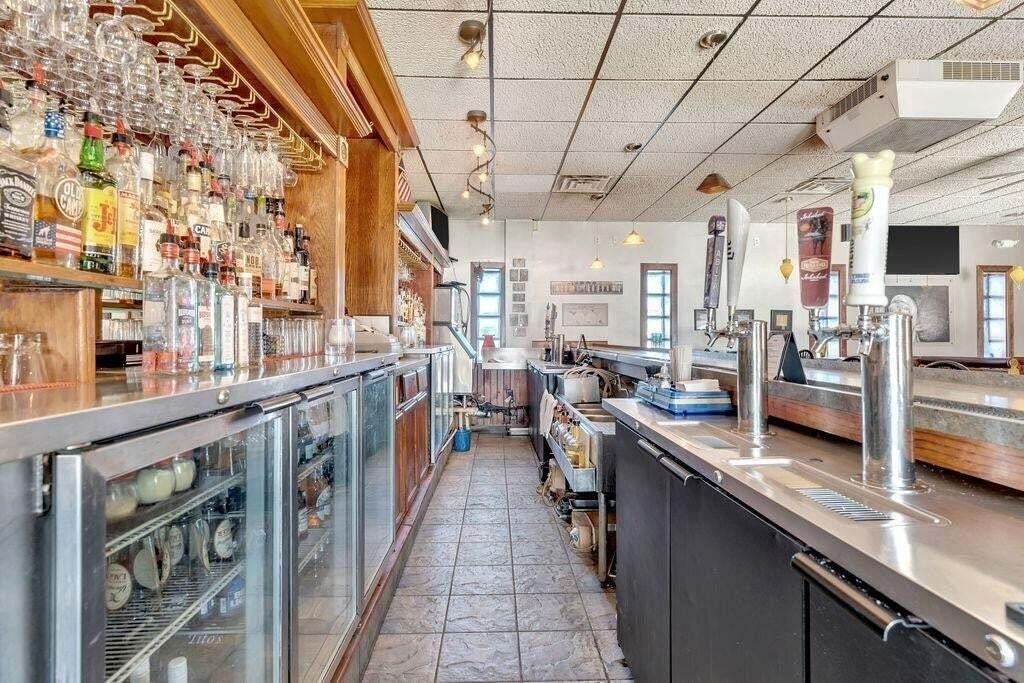
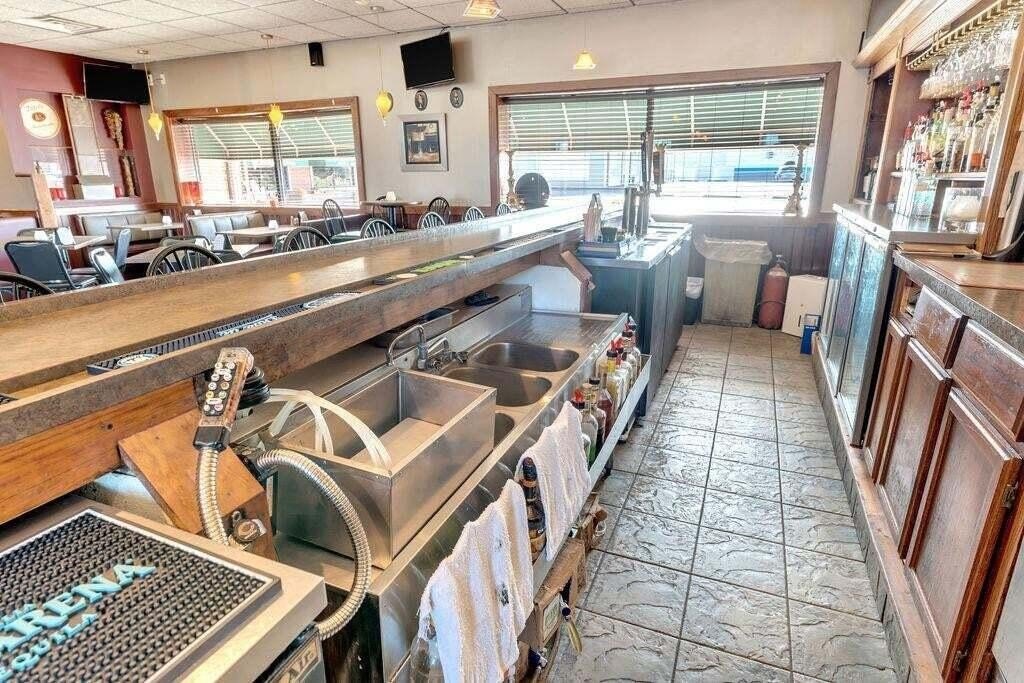
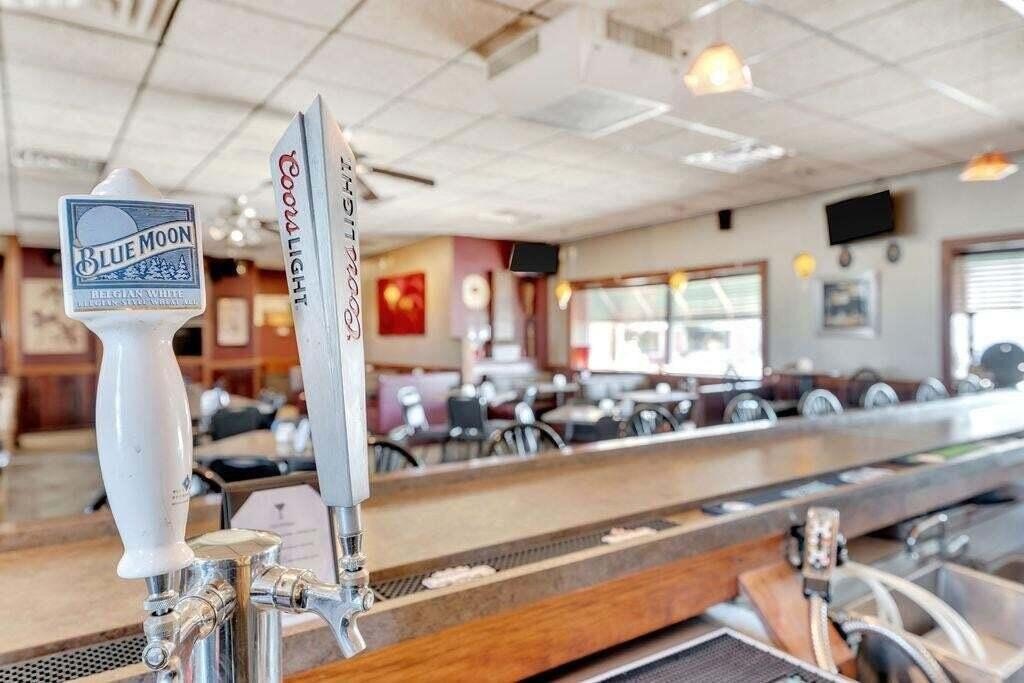
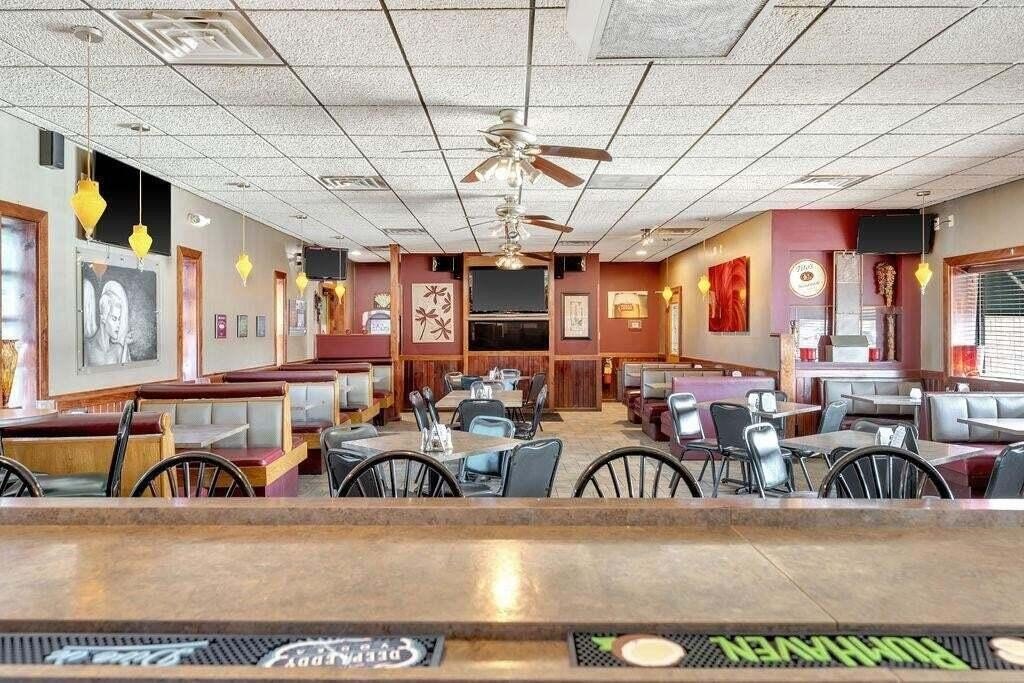
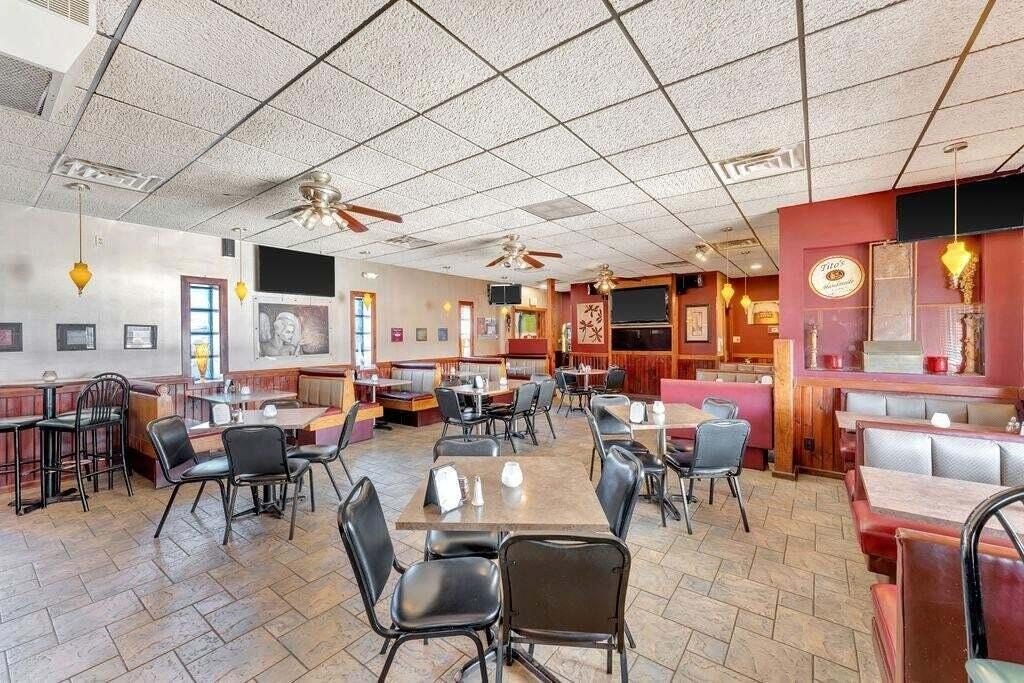
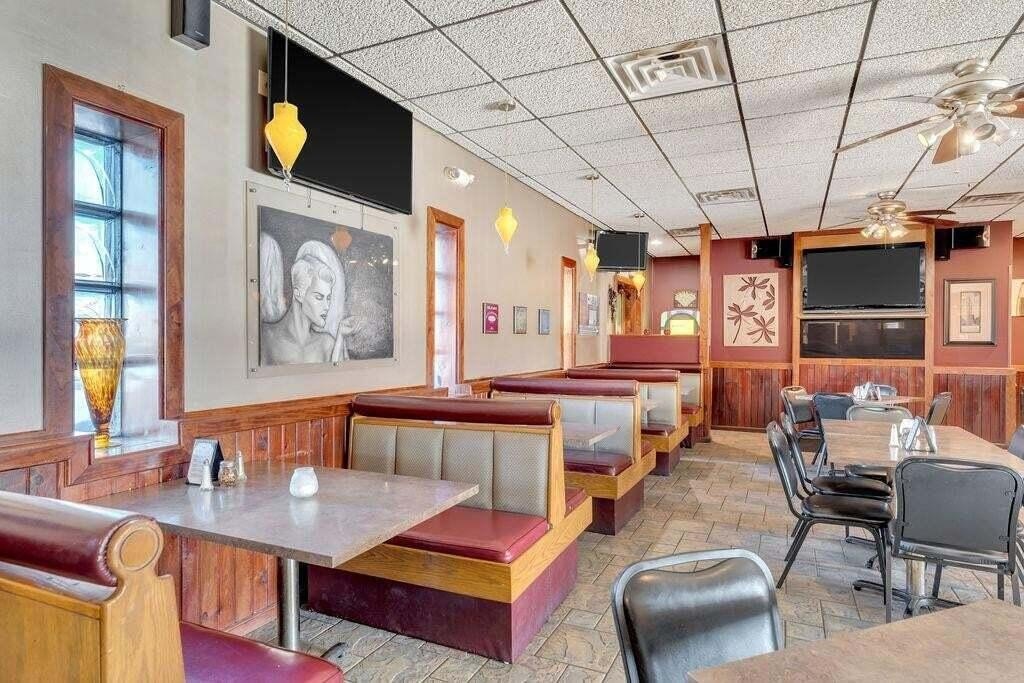
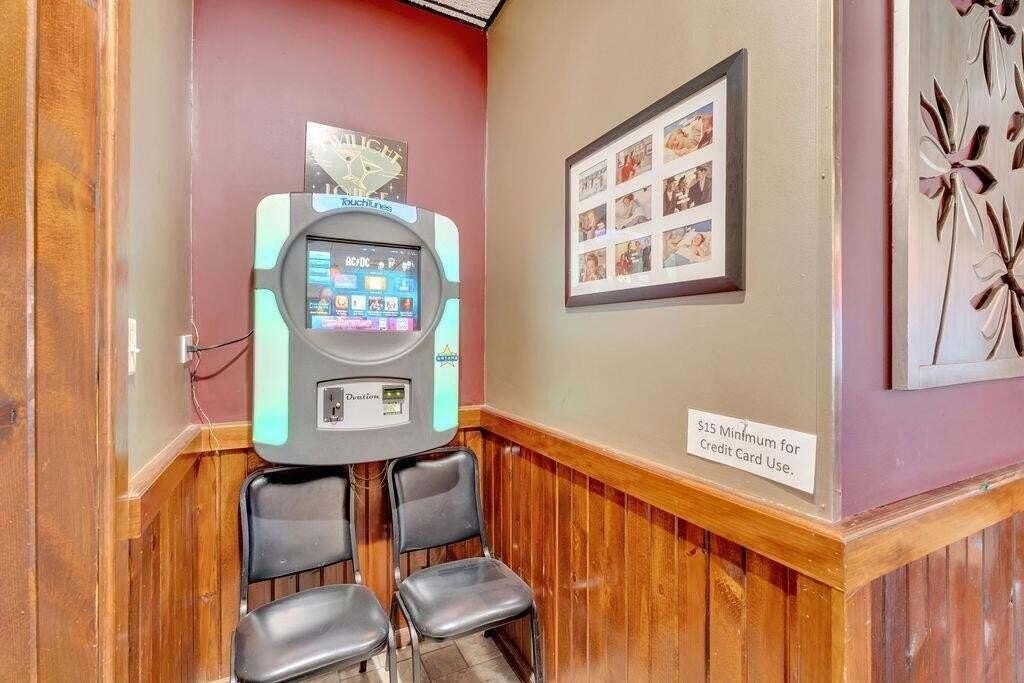
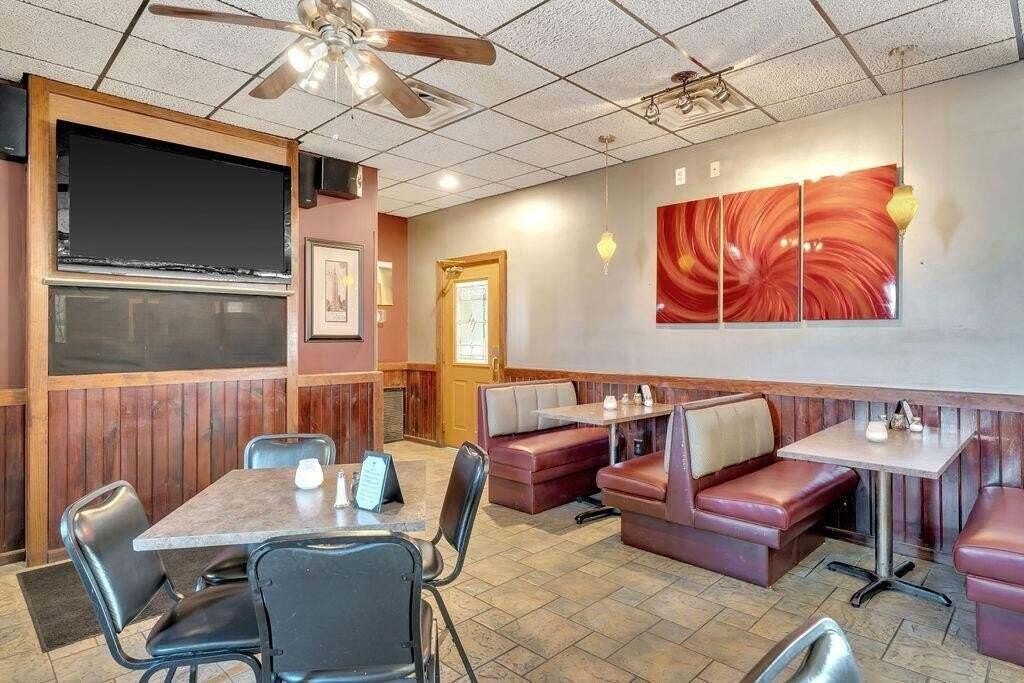
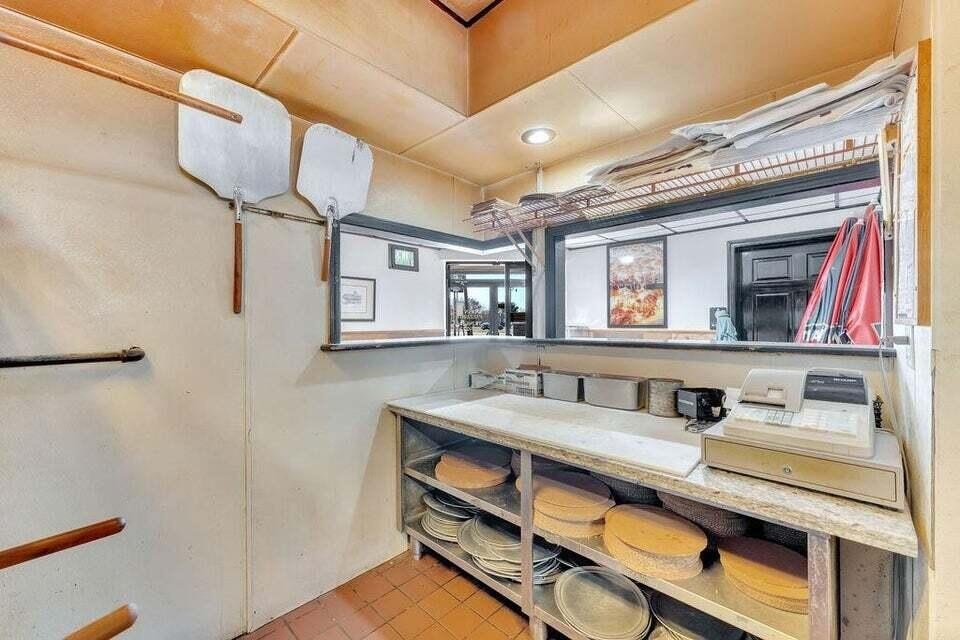
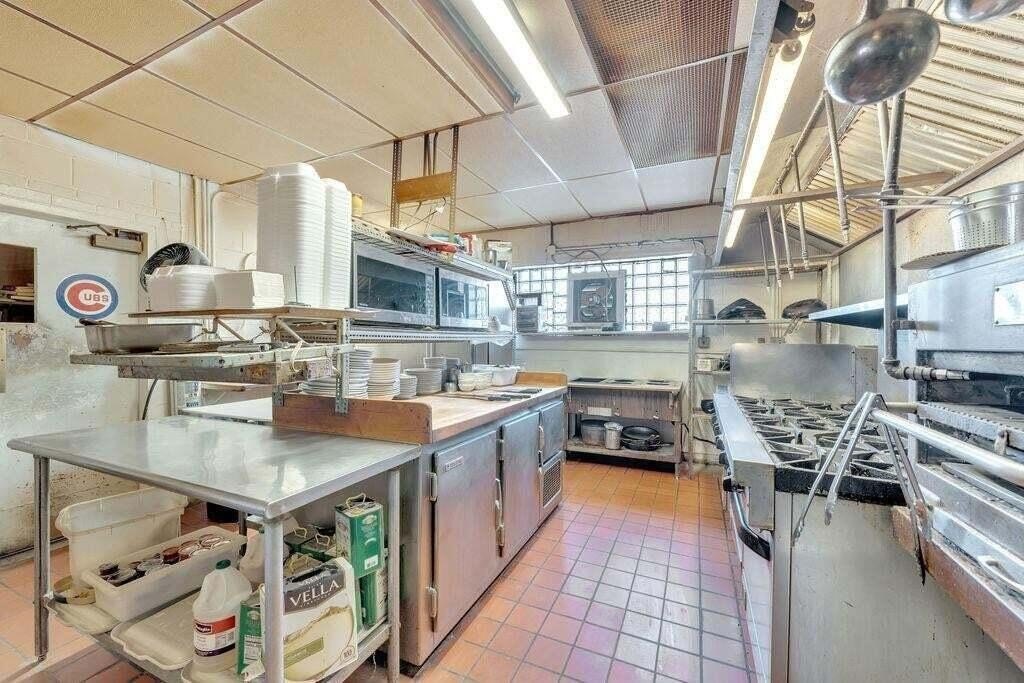
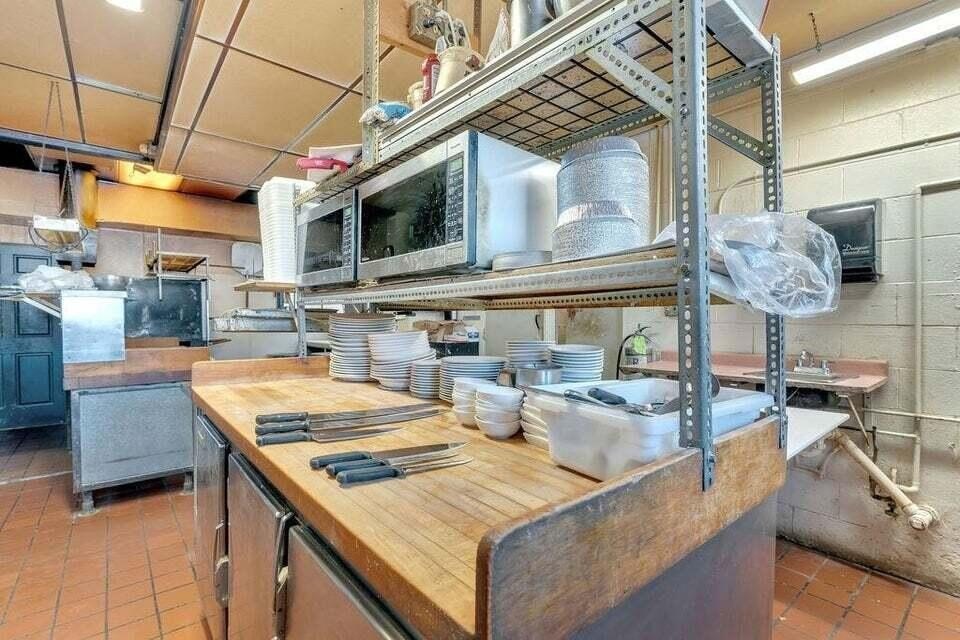
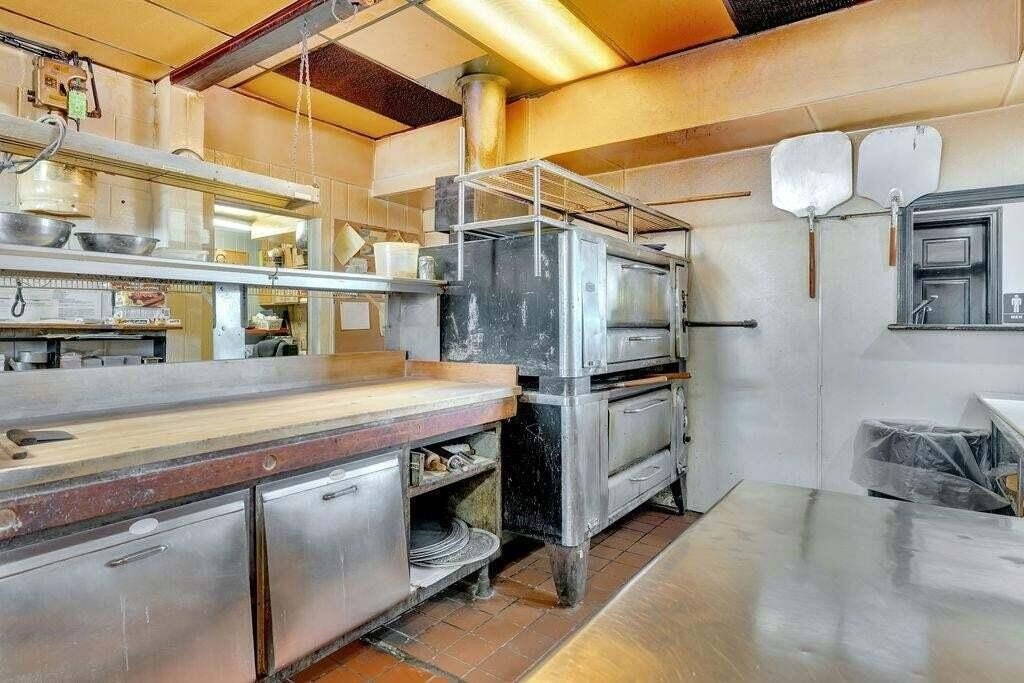
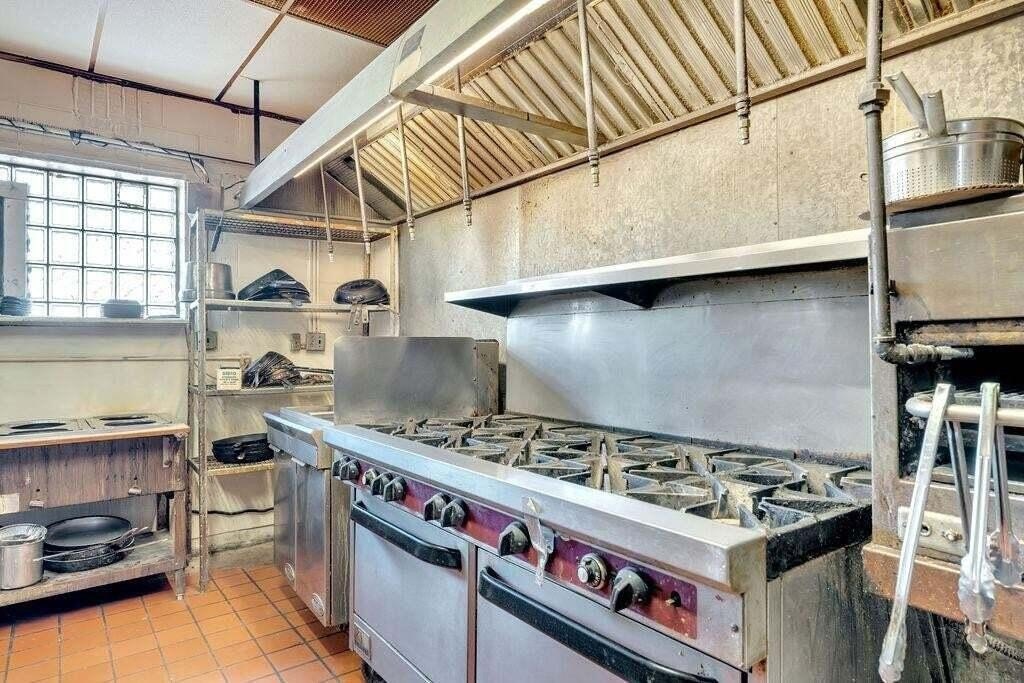
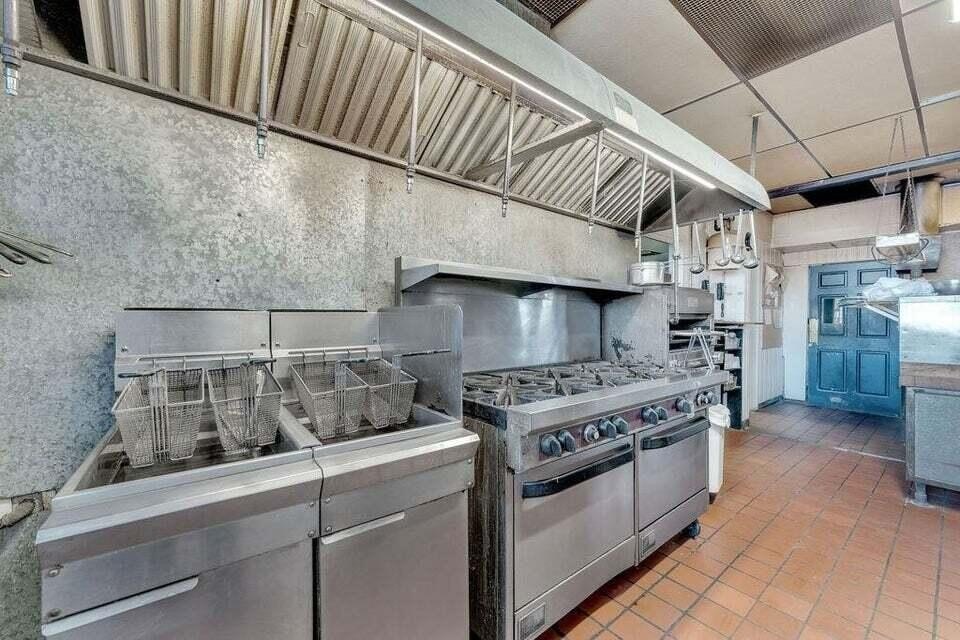
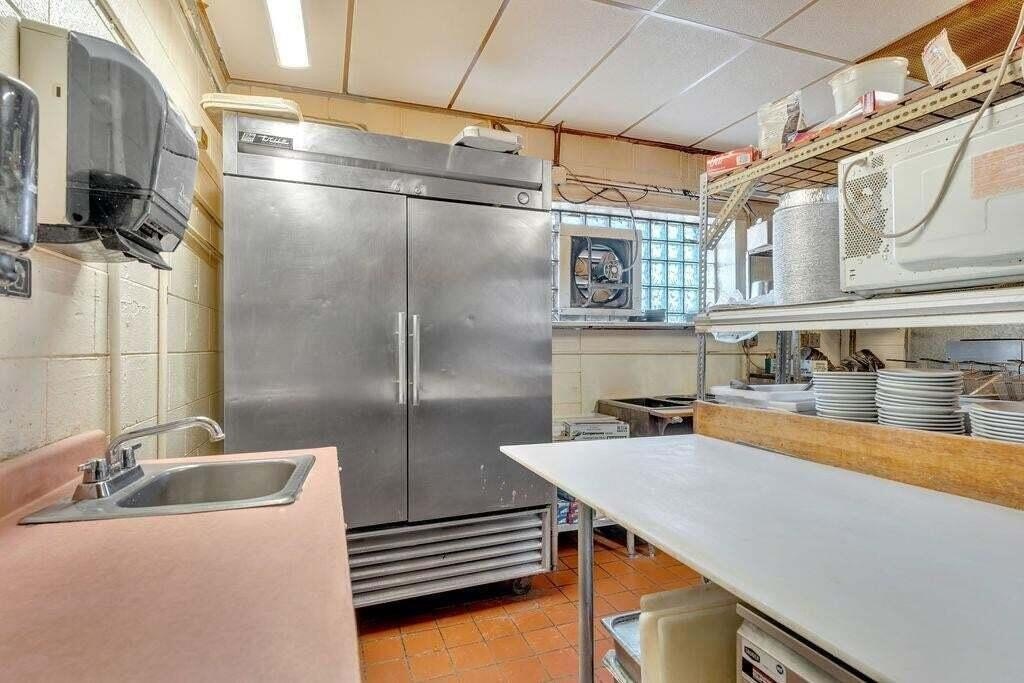
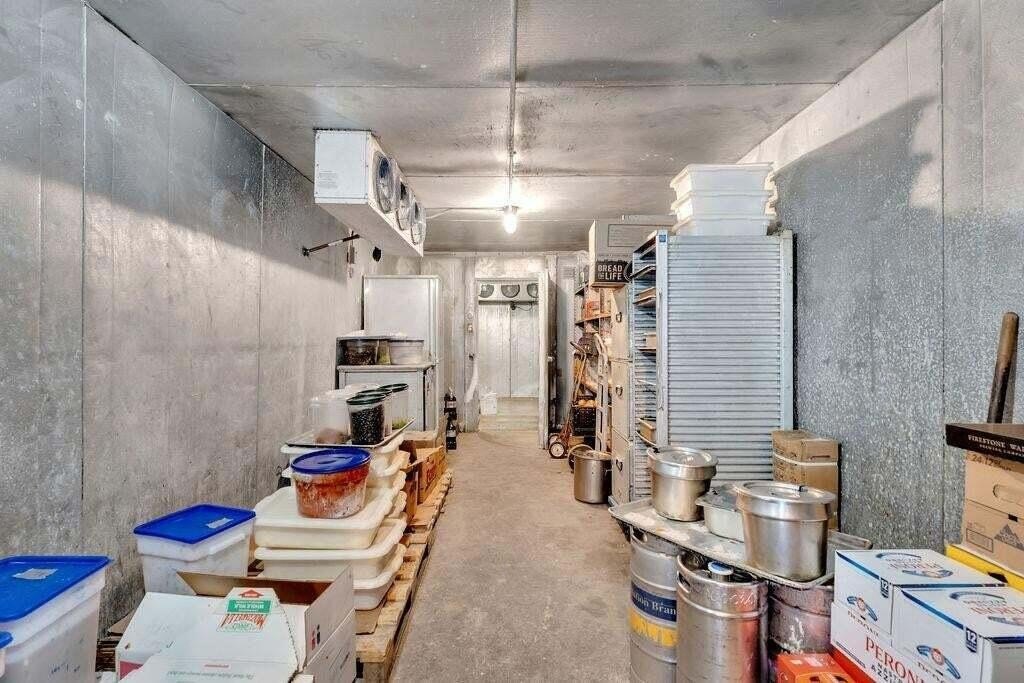
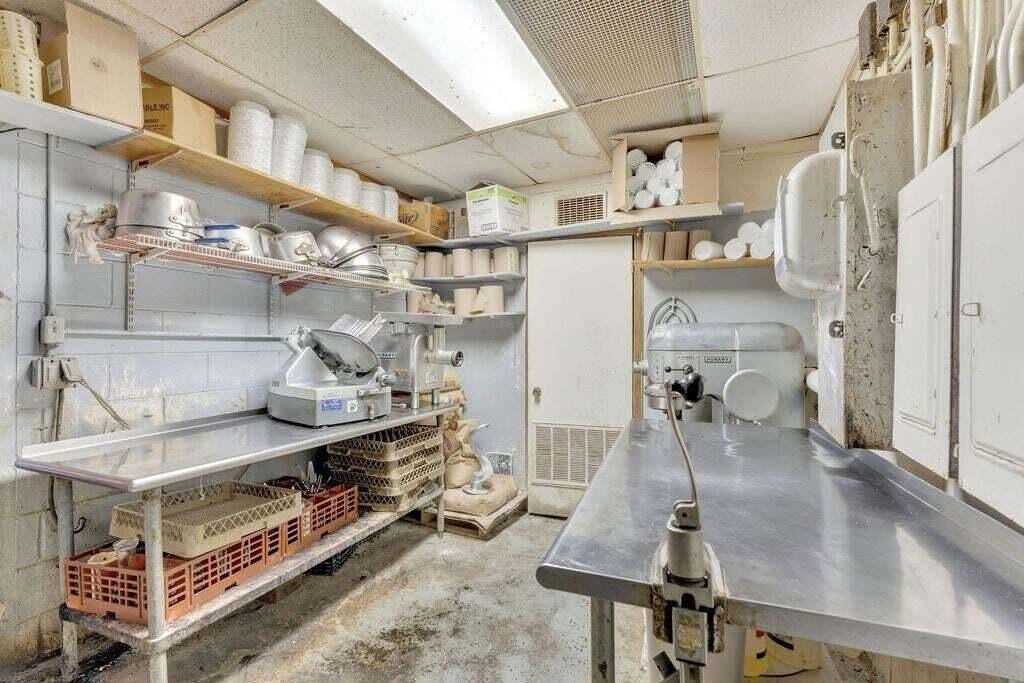
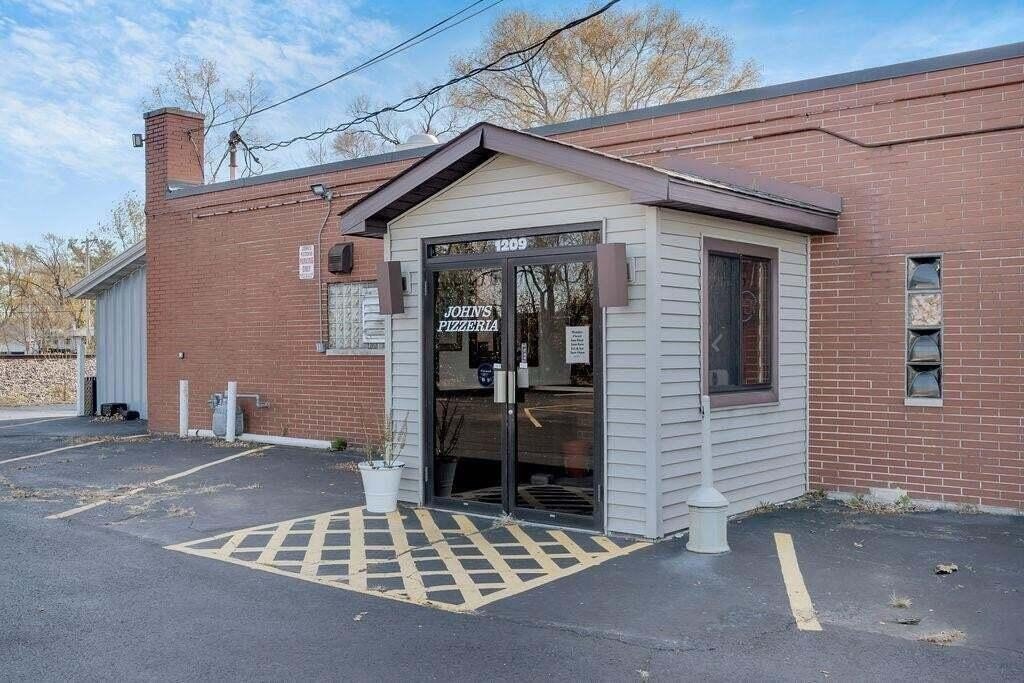
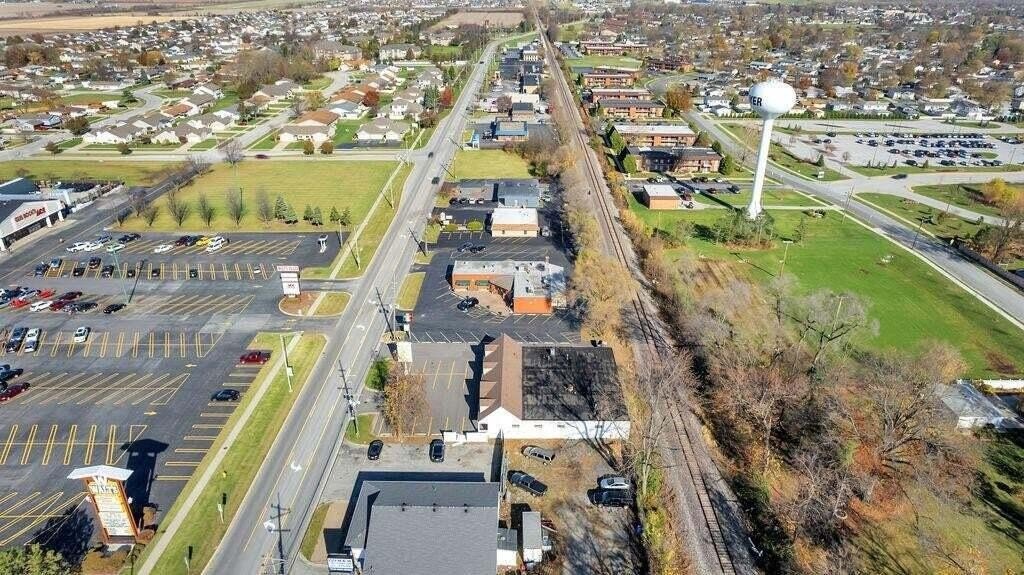
This 3,970-square-foot brick restaurant building on 0.684 acres is configured for food-and-beverage operations, with expansive dining areas, a private bar section, and a separate entrance. High ceilings, recessed lighting, ceiling fans, storage, and a flexible interior arrangement support continued restaurant use or reconfiguration, subject to municipal approval. Forced-air heating, public water, and public sewer are in place, and the building was constructed in 1962.
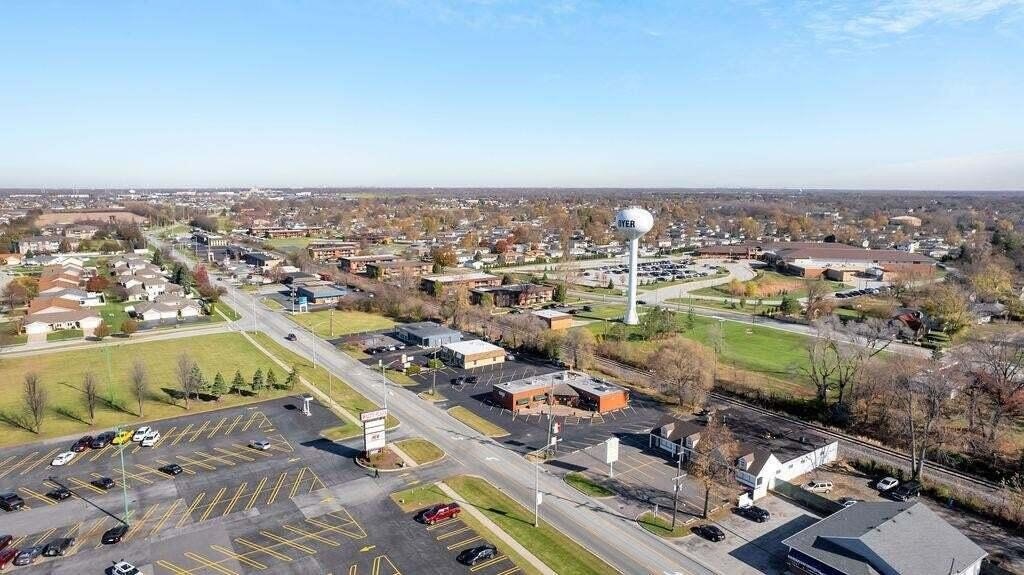
Located at 1209 Sheffield Avenue in Dyer, the property records approximately 7,995 vehicles per day and offers paved and overflow parking. Its position provides access for Illinois commuters and places the site 32 miles from Chicago. Outdoor seating is also possible, adding another option for the existing hospitality layout.
Located at 1209 Sheffield Avenue in Dyer, the property records approximately 7,995 vehicles per day and offers paved and overflow parking. Its position provides access for Illinois commuters and places the site 32 miles from Chicago. Outdoor seating is also possible, adding another option for the existing hospitality layout.
Key Highlights
- 3,970 SF brick restaurant building on 0.684 acres
- Private bar area with its own entrance
- Approximately 7,995 vehicles per day on Sheffield Avenue
Property Analytics
Unlock full access to Insights
Subscribe to Realmo Intelligence
Open Analytics
Current Use
Lease Details
7,995 VPD
Traffic count
Yes
Paved road access
Location Intelligence
Trade Area within ½ mile
240
Businesses Nearby
19k
Monthly Visits Nearby
Under-served
Demand for This Use
Explore this area
Business Placement
Foot Traffic Nearby
Shops & Services 52%
Home Improvements & Furnishings 41%
Dining 7%
Casey's General Store
Shops & Services
7,893 visits/mo
0.4 miles
Gus Bock's Ace Hardware
Home Improvements & Furnishings
7,739 visits/mo
0.1 miles
Centier Bank
Shops & Services
2,070 visits/mo
0.1 miles
SUBWAY
Dining
1,305 visits/mo
0.4 miles
Demographics for 46311, IN
22,431
Population
9,128
Households
2.5
Avg Household Size
43
Median Age
37%
College-Educated
96%
High-School Grad
12.6 sq mi
ZIP Area
1,780
Density / Sq Mi
$109,167
Median Household Income
$58,332
Median Earnings
$1,221
Median Rent
$300,000
Median Home Value
Check the figures for this property
Cap Rate, Value Estimation, Potential NOI and more
View Realmo Analytics
Market
Vacancy Rate% for Retail in Midwest region

Questions? Ask Rey
Realmo’s AI knows this listing — price, zoning, demand, history. Ask anything.






Frequently Asked Questions
What type of property is this?
Conventional restaurant - Freestanding hospitality property with flexible dining areas, a separate bar entrance, outdoor seating potential, and paved on-site parking.
Where is this conventional restaurant located?
The property is located at 1209 Sheffield Avenue Dyer, IN.
What is the asking price?
The asking price for this property is $649,900.
What are key features of this property?
This property features: 3,970 SF brick restaurant building on 0.684 acres; Private bar area with its own entrance; Approximately 7,995 vehicles per day on Sheffield Avenue



