Freestanding Bar and
For Sale
Contact for pricing
1205 Delsea Dr, Westville, NJ 08093
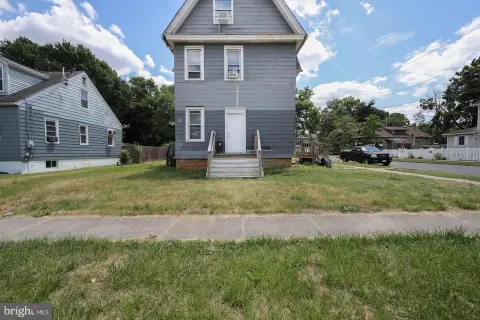
Freestanding bar/restaurant with outdoor seating and a paved rear lot offering 40+ parking spaces.
Property Size4,986 SF
Price / SF$300.84
Days on Market85
Property Features for 1205 Delsea Dr
General Information
Standard status
Active
Size
4,986 SF
Property subtype
RETAIL
Additional Details
Business Included
Yes
Road Access
Yes
Liquor License
Yes
Multifamily Units
2
Amenities
Outdoor Seating Area/Deck
Listing Agency:
NAI Mertz - Corporate
(856) 234-9600
Listed By:
Joe Riggs
(609) 352-1162
Source:
Moodyscre
Added: Jul 14
Changed: Oct 5
Last Checked: Oct 5 at 5:21PM
Displayed information is deemed reliable but is not guaranteed and should be independently verified. All listing content including descriptions, pricing, images are the copyrighted material of NAI Mertz - Corporate
Investment Insights
Based on property information with market context.
This freestanding bar and restaurant includes the PC plenary consumption liquor license and offers furniture and fixtures available. The property also has two second-floor income-producing residential apartments, providing additional rental space above the dining and bar operation. An outdoor seating area or deck is included for guest use.
The property is located with great frontage on Delsea Drive. A paved rear lot supports 40+ parking spaces, which is useful for patrons and events.
Showings are available by appointment only.
The property is located with great frontage on Delsea Drive. A paved rear lot supports 40+ parking spaces, which is useful for patrons and events.
Showings are available by appointment only.
Key Highlights
- Freestanding bar/restaurant with outdoor seating area/deck
- Two 2nd‑floor income‑producing residential apartments
- Includes PC plenary consumption liquor license
Financial Insights
Estimated NOI and Cap Rate
NOI / Yr
$65,512
Cap Rate
4.37%
Suggested Prices Based on Cap Rates
Cap Rate 5%
$1,310,240
$1.3M
Cap Rate 7%
$935,886
$935.9K
Cap Rate 9%
$727,911
$727.9K
Market Conditions
NOI Build-Up for 4,986 SF
Gross rent
$98.7K $19.80/SF
− Vacancy
−$5.1K −$1.03/SF
EGI
$93.6K $18.77/SF
− OpEx
−$28.1K −$5.63/SF
NOI
$65.5K $13.14/SF
Area
Gloucester County, NJ
Vacancy
5.20%
Lease Rate
$19.80 /SF/Yr
Expense Ratio
30.00%
Simulate Cap Rate and NOI
Suggested Prices Based on Cap Rates
Cap Rate 5%
$1,310,240
Cap Rate 7%
$935,886
Cap Rate 9%
$727,911
Alternative Uses
Best Use
Multifamily LT 5
$935.9K
$818.9K – $1.09M
NOI $65,512 @ 7.0% cap · market cap 4.37%
Second Best
Specialty Retail
$912.5K
$798.5K – $1.06M
NOI $63,878 @ 7.0% cap · market cap 4.26%
Theoretical Best
Office A
$1.68M
$1.47M – $1.96M
NOI $117,320 @ 7.0% cap · market cap 7.82%
Zoning and permitted uses should be independently verified with authorities.
Property Analytics
Unlock full access to Insights
Subscribe to Realmo Intelligence
Open Analytics
Current Use
Lease Details
2
Residential units
Turnkey business
Opportunity
Yes
Paved road access
Yes
Liquor license
Location Intelligence
Trade Area within ½ mile
169
Businesses Nearby
Under-served
Demand for This Use
Explore this area
Business Placement
Demographics for 08093, NJ
9,933
Population
4,473
Households
2.2
Avg Household Size
39
Median Age
22%
College-Educated
94%
High-School Grad
4.0 sq mi
ZIP Area
2,483
Density / Sq Mi
$70,257
Median Household Income
$41,051
Median Earnings
$1,230
Median Rent
$192,800
Median Home Value
Check the figures for this property
Cap Rate, Value Estimation, Potential NOI and more
View Realmo Analytics
Market
Vacancy Rate% for Multifamily in Northeast region

Questions? Ask Rey
Realmo’s AI knows this listing — price, zoning, demand, history. Ask anything.


Similar Off Market Nearby
- Nipper's Pub — 1205 Delsea Dr, Westville, NJ 08093
Frequently Asked Questions
What type of property is this?
Bar & Pub - Freestanding bar/restaurant with outdoor seating and a paved rear lot offering 40+ parking spaces.
Where is this bar & pub located?
The property is located at 1205 Delsea Dr Westville, NJ.
What is the asking price?
The asking price for this property is $1,500,000.
What are key features of this property?
This property features: Freestanding bar/restaurant with outdoor seating area/deck; Two 2nd‑floor income‑producing residential apartments; Includes PC plenary consumption liquor license



