Renovated Mixed-Use
For Sale
$1,450,000
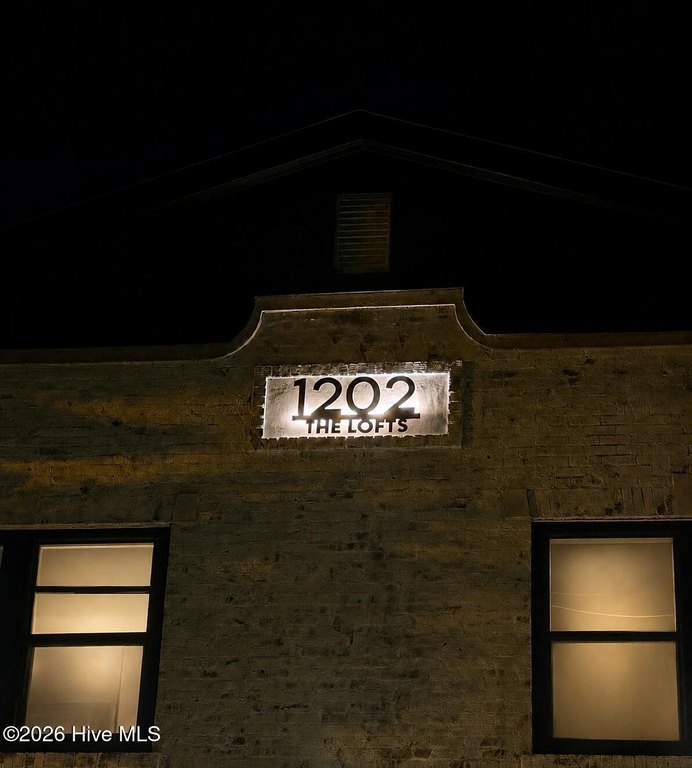
1202 Chestnut Street, Wilmington, NC 28401
Residential Income, Wilmington, NC
Property Size3,215 SF
Lot Size0.04 Acres
Price / SF$451.01
Days on Market48
Property Features for 1202 Chestnut Street
General Information
Property type
Residential Multi Family
Property subtype
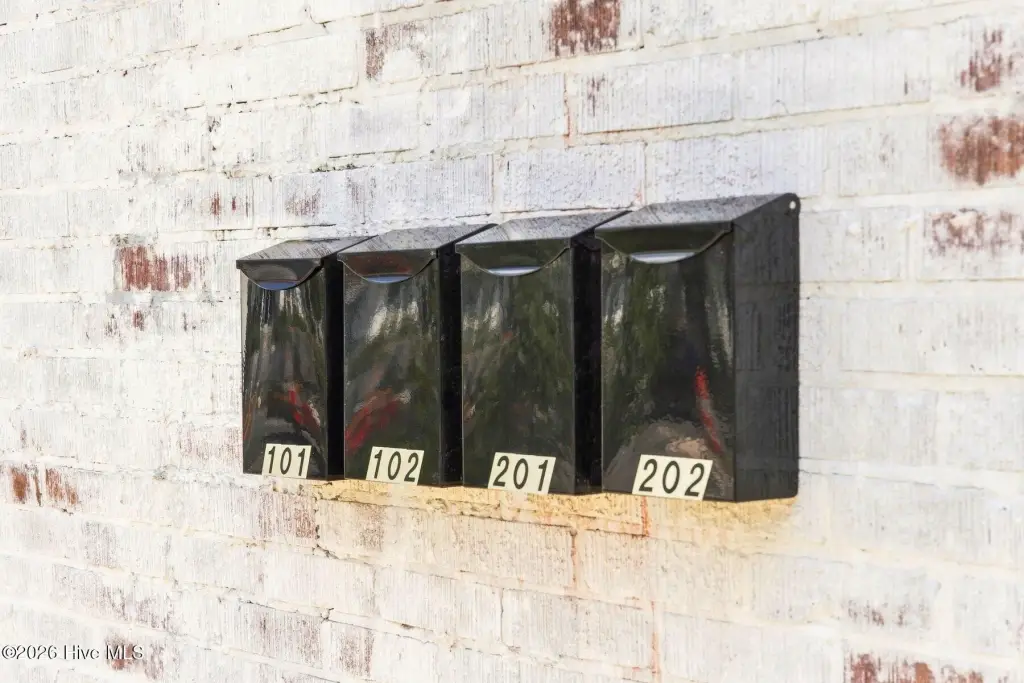
Quadruplex
Zoning
UMX
Bedrooms
3
Bathrooms
5
Full bathrooms
2
Half bathrooms
2
Rooms
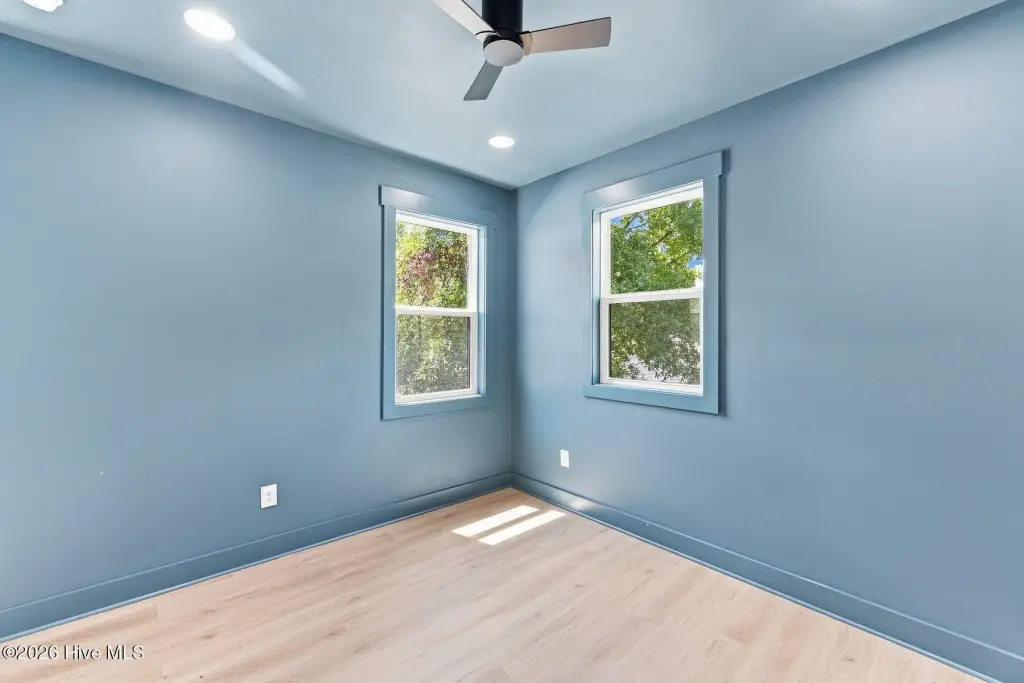
Bedroom 2, Bathroom 5, Bathroom 4, Bathroom 1, Bathroom 2, Bedroom 3, Bathroom 3, Bedroom 1
Parking features
On Street
Interior features
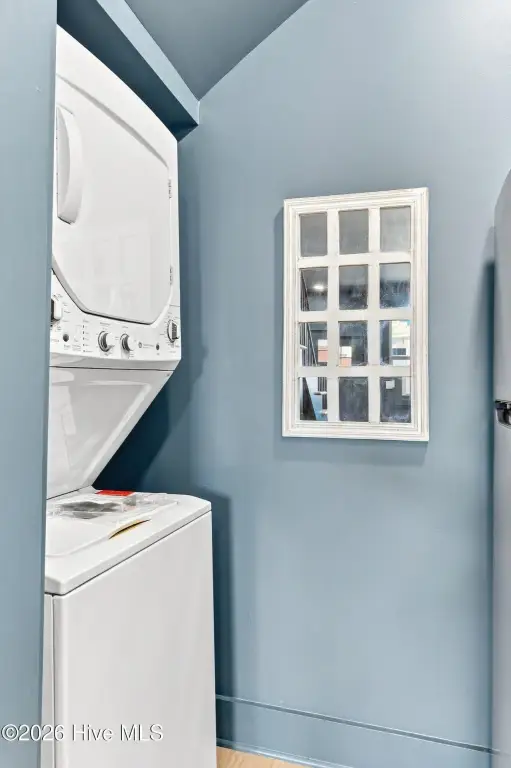
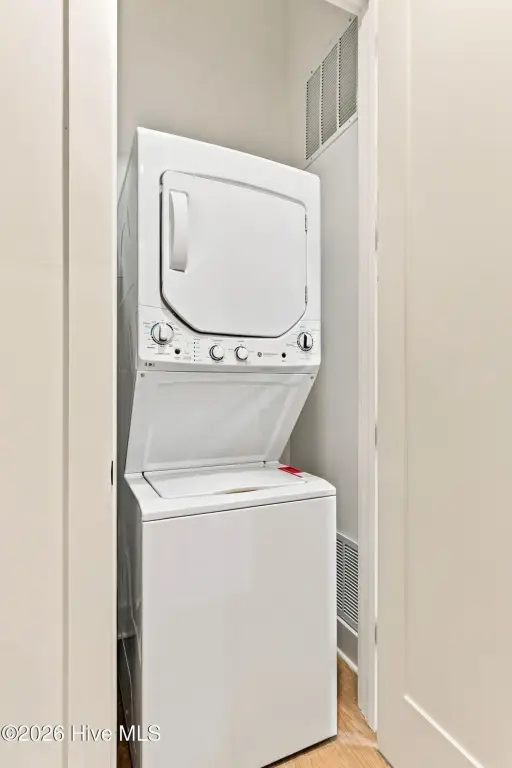
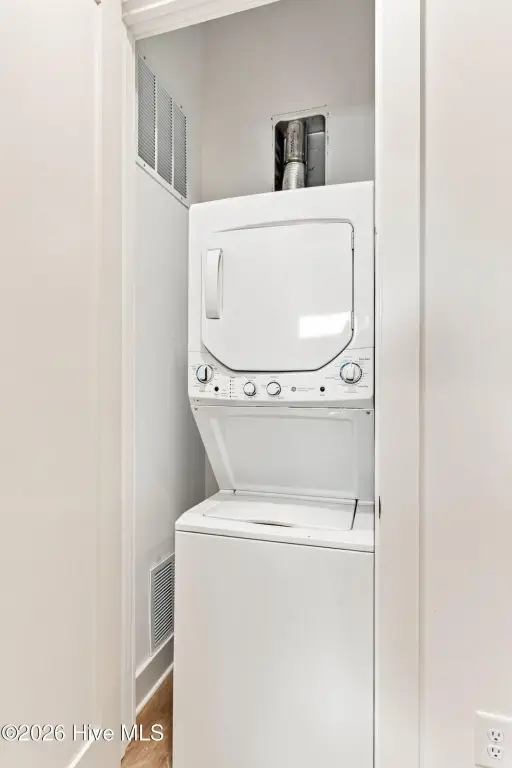
High Ceilings, Wash/Dry Connect, Walk-in Shower
Appliances
Electric Oven, Built-In Microwave, Refrigerator, Dishwasher
Subdivision
Castle Dock
Elementary school
Snipes
Middle school
Williston
High school
New Hanover
Directions
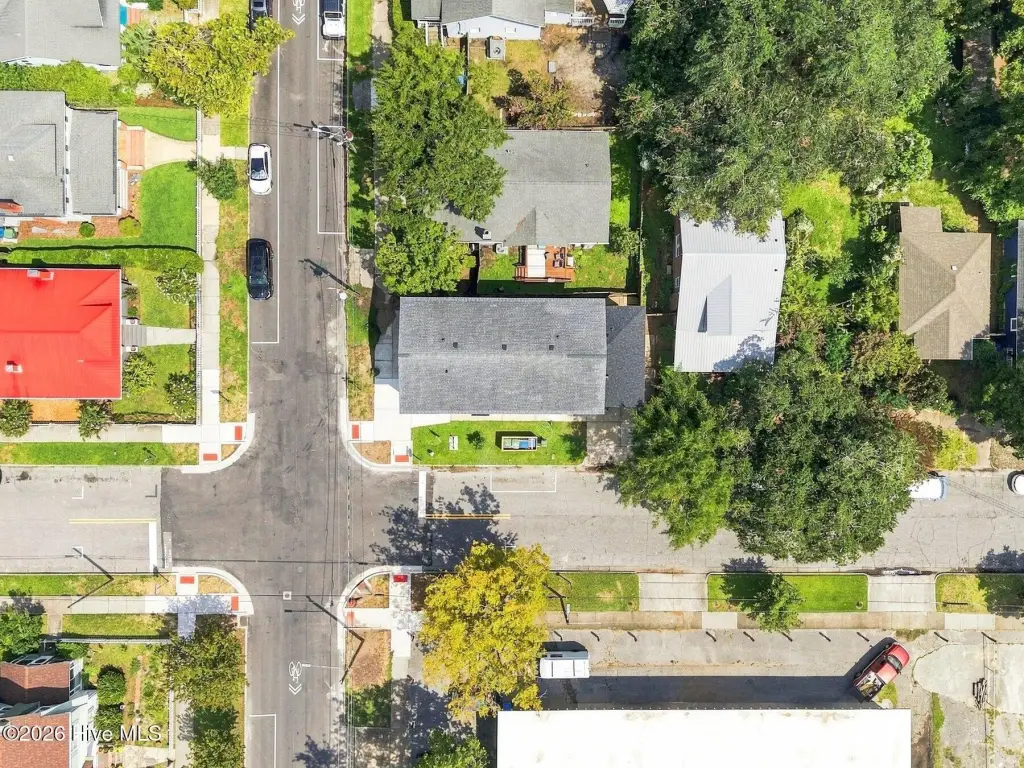
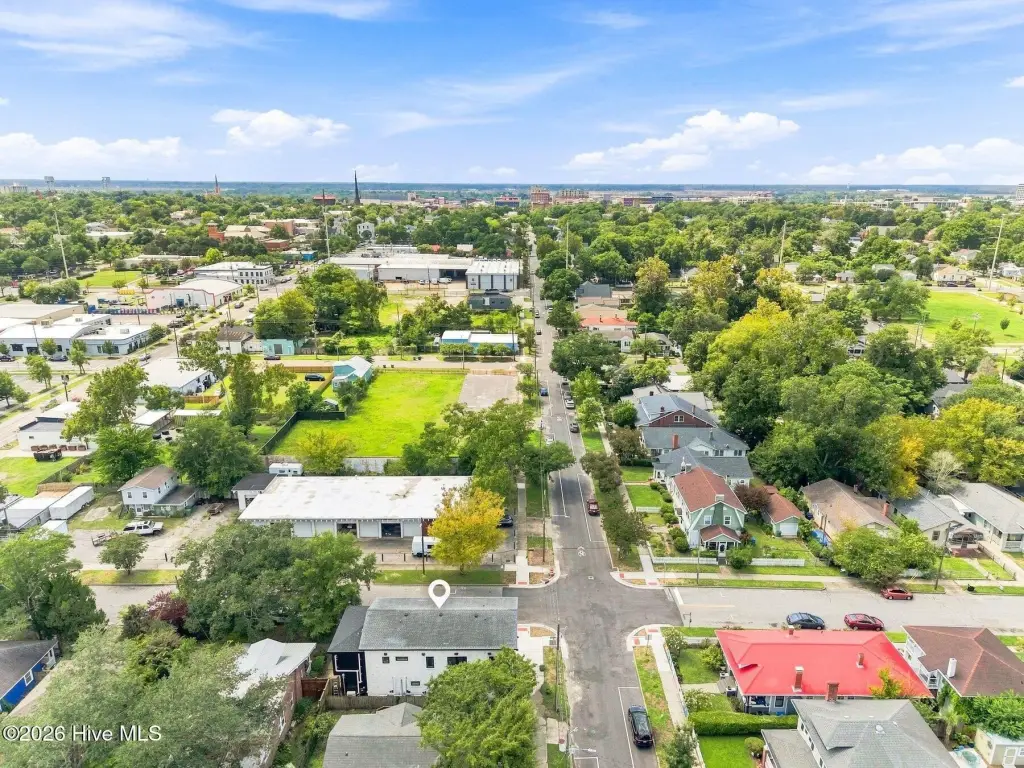
Market St West towards town. Right on 12th Street to corner of 12th and Chestnut St. Property at corner.
Standard status
Active
APN
R04818-014-001-000
Size
3,215 SF
Lot size
0.04 Acres
Taxes and HOA fees
Tax Year
2025
Tax Description
W END 1 BLK 189
Tax Annual Amount
2418
Legal Description
W END 1 BLK 189
Utilities
Heating system
Electric (Heating), Zoned
Cooling system
Multi Units
Water source
Public
Building Details
Year built
1931
Floors in Building
2
Number of units
4
Flooring type
Concrete, Lvt/lvp
Building materials
Brick, Fiber Cement
Roof type
Shingle, Shake
Listing Agency:
Intracoastal Realty Corporation
Listed By:
The Rising Tide Team
(910) 256-4503
Added: Sep 3
Changed: Oct 17
Last Checked: Oct 20 at 6:06AM
MLS# 100601133
Copyright © 2026 Hive MLS. All rights reserved. All information provided by the listing agent/broker is deemed reliable but is not guaranteed and should be independently verified.

Ask AI about this property
Review the available facts, identify missing information and prepare questions for the agent.
Investment Insights
Based on property information with market context.
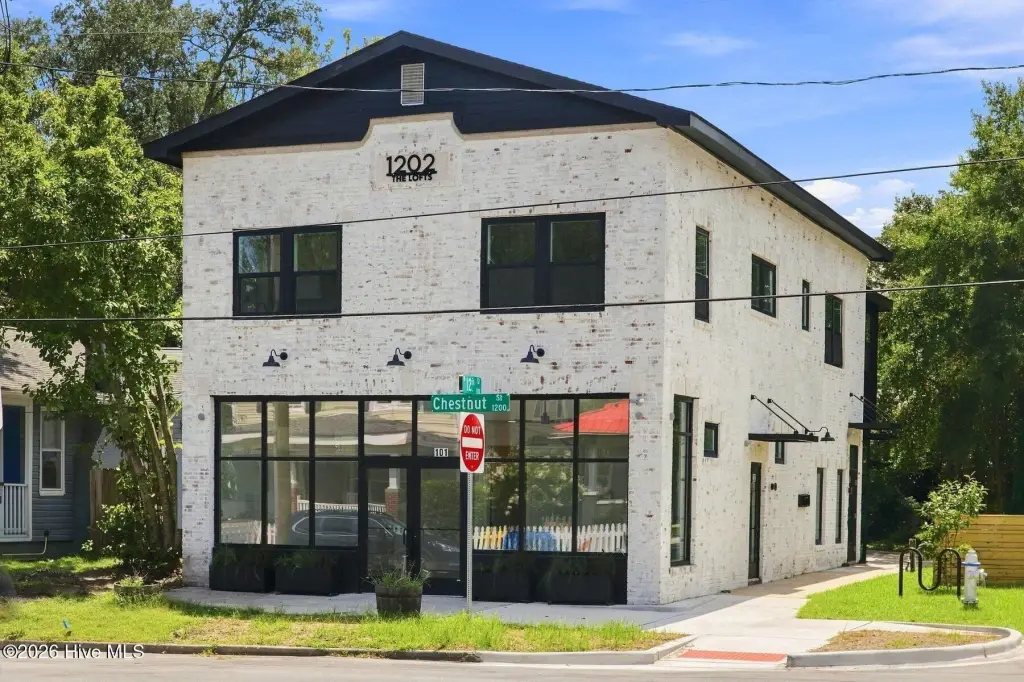
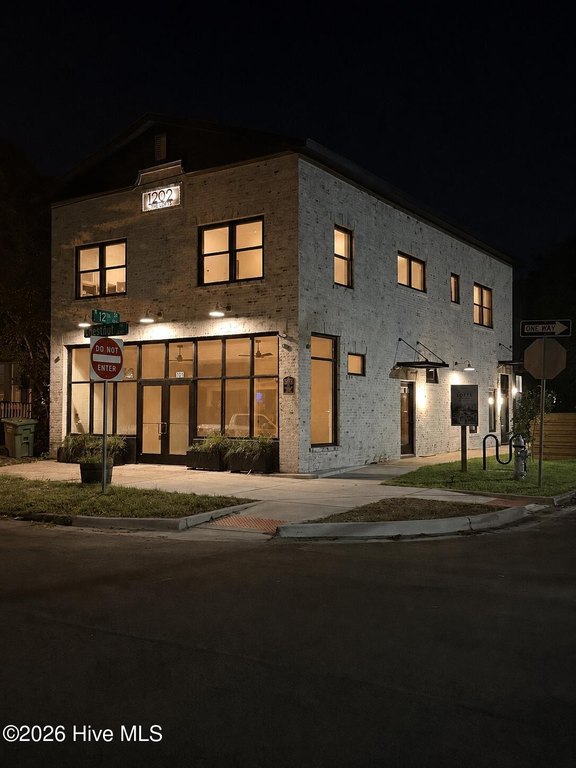
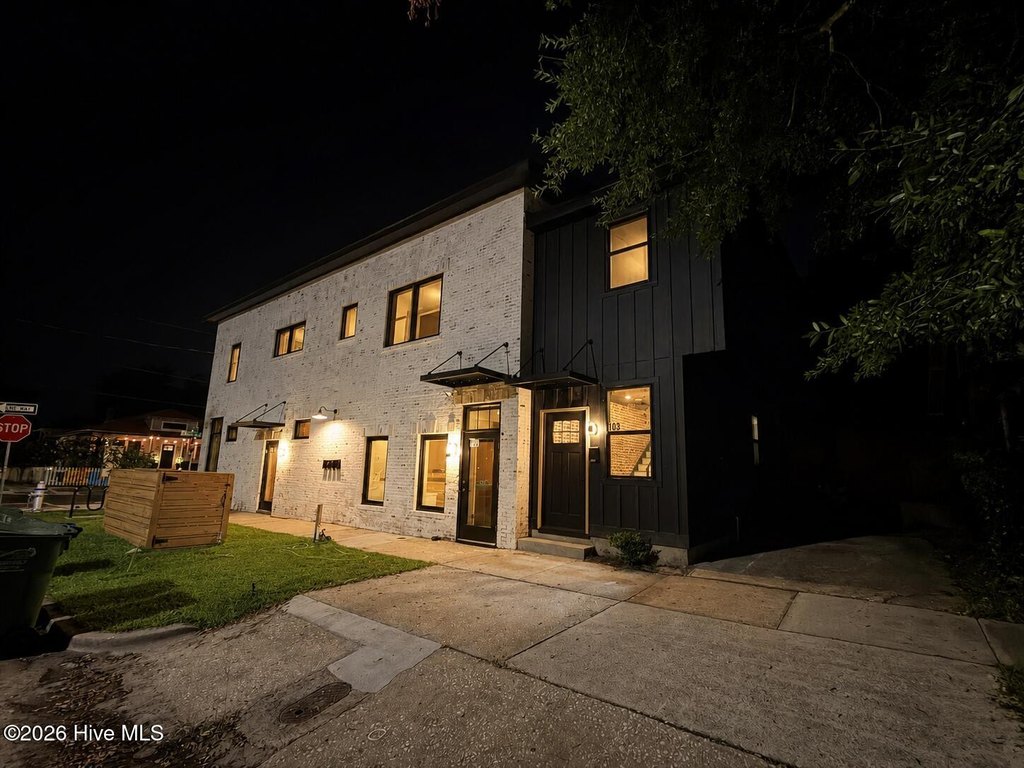
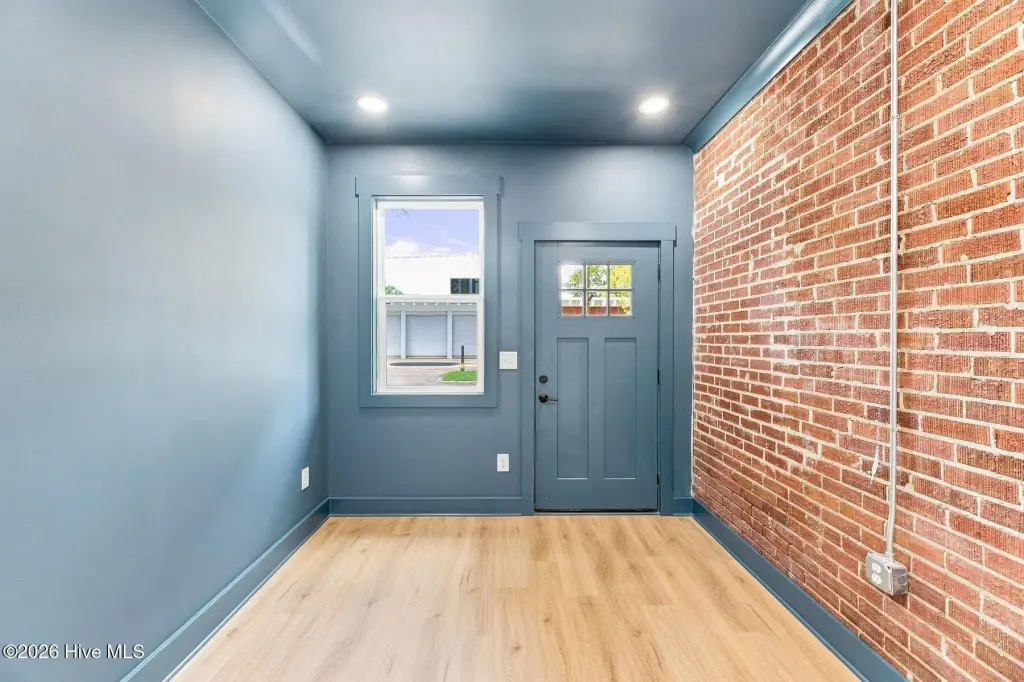
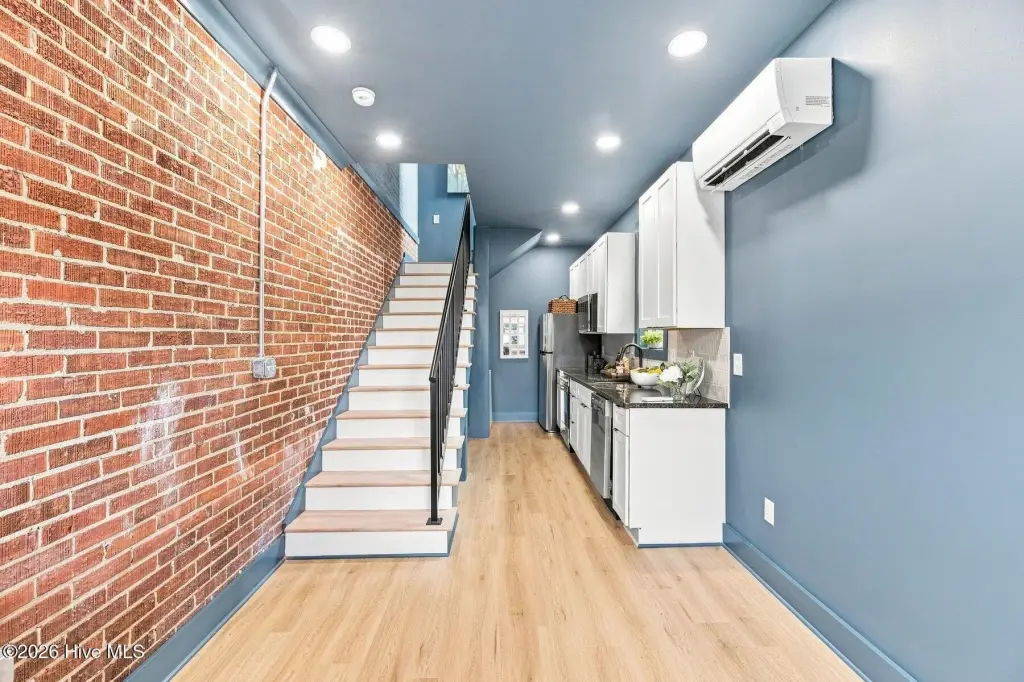
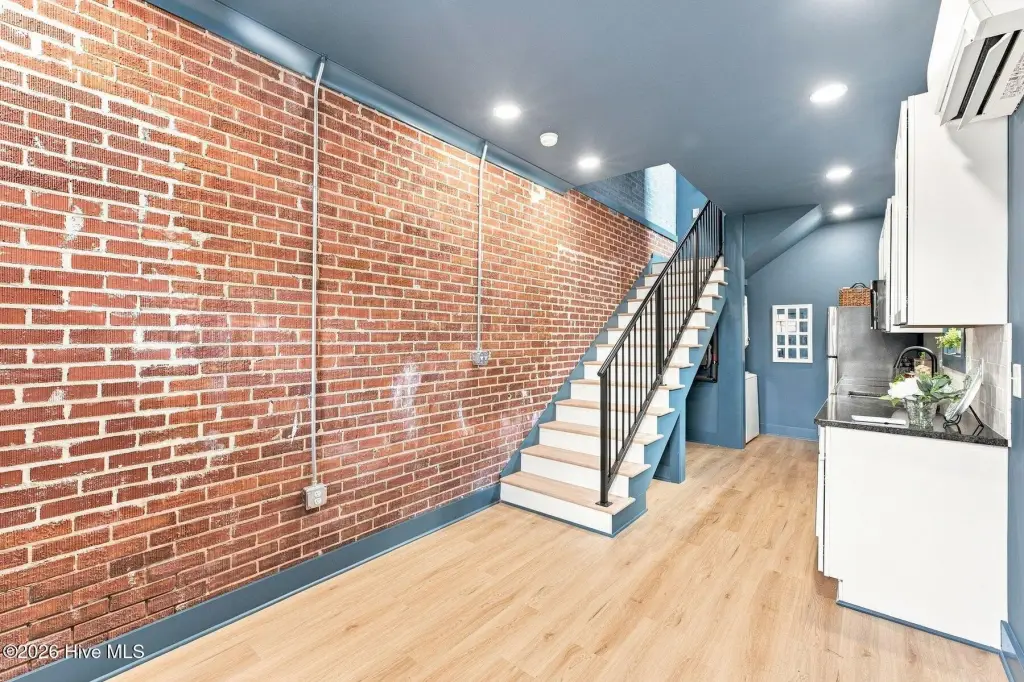
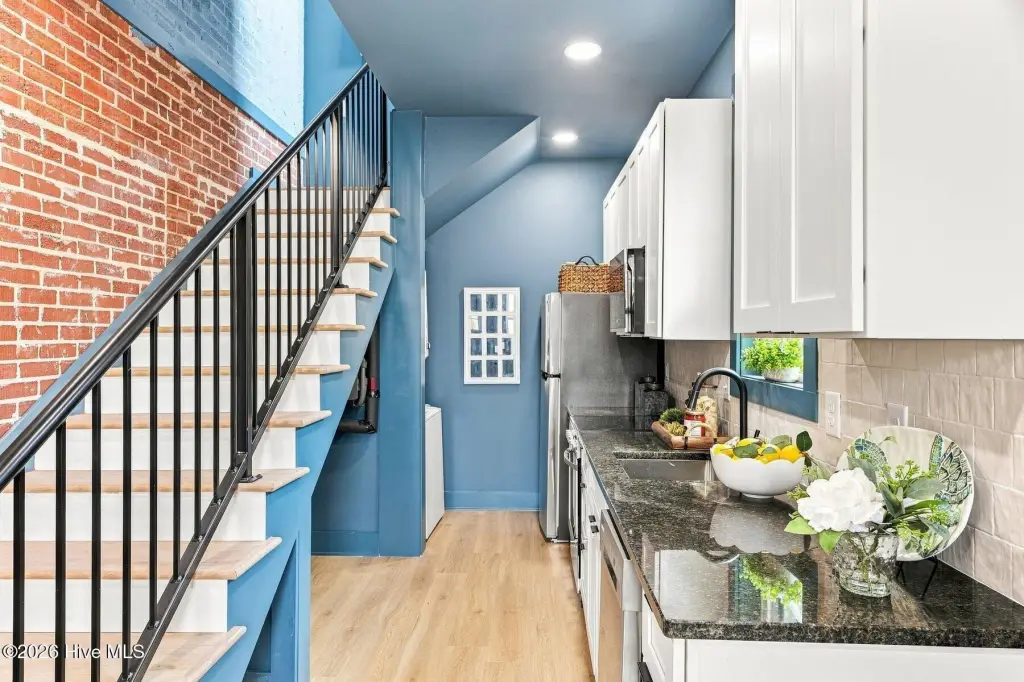
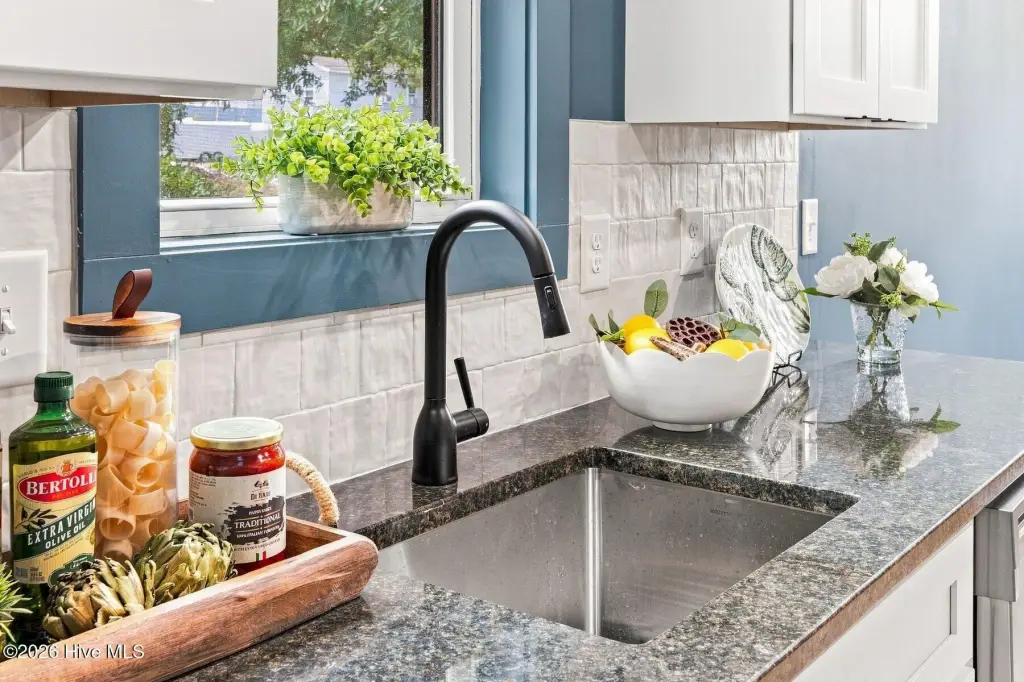
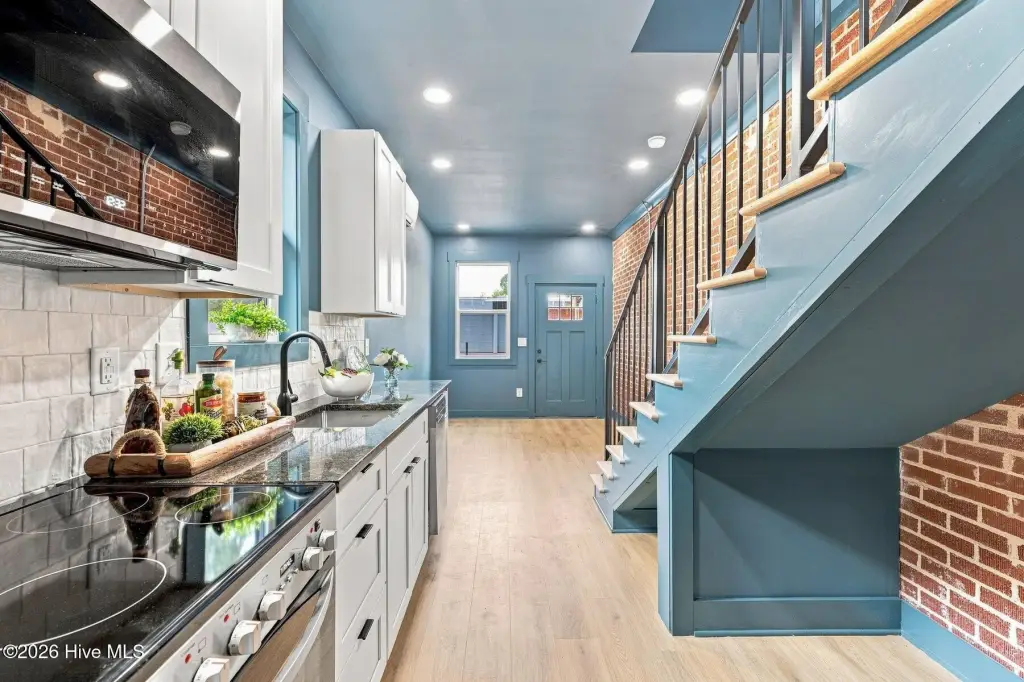
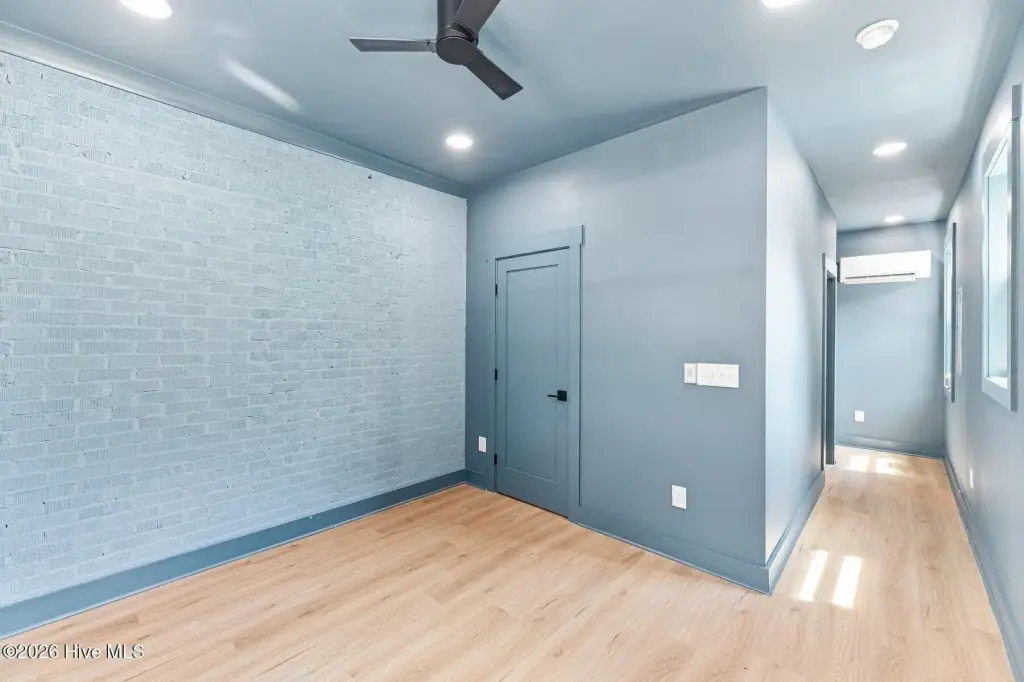
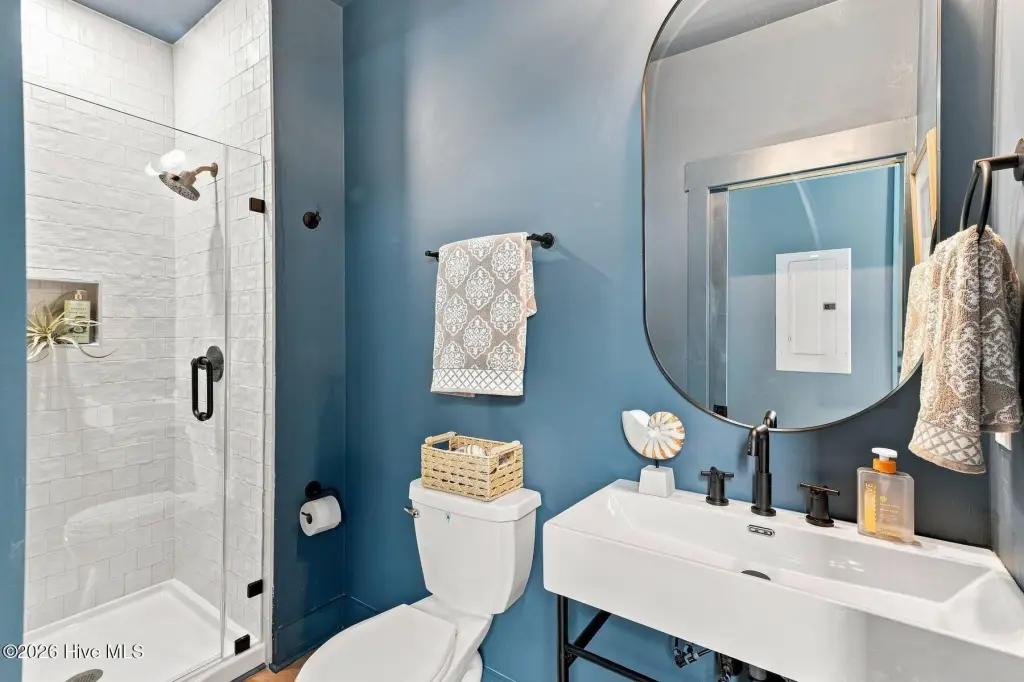
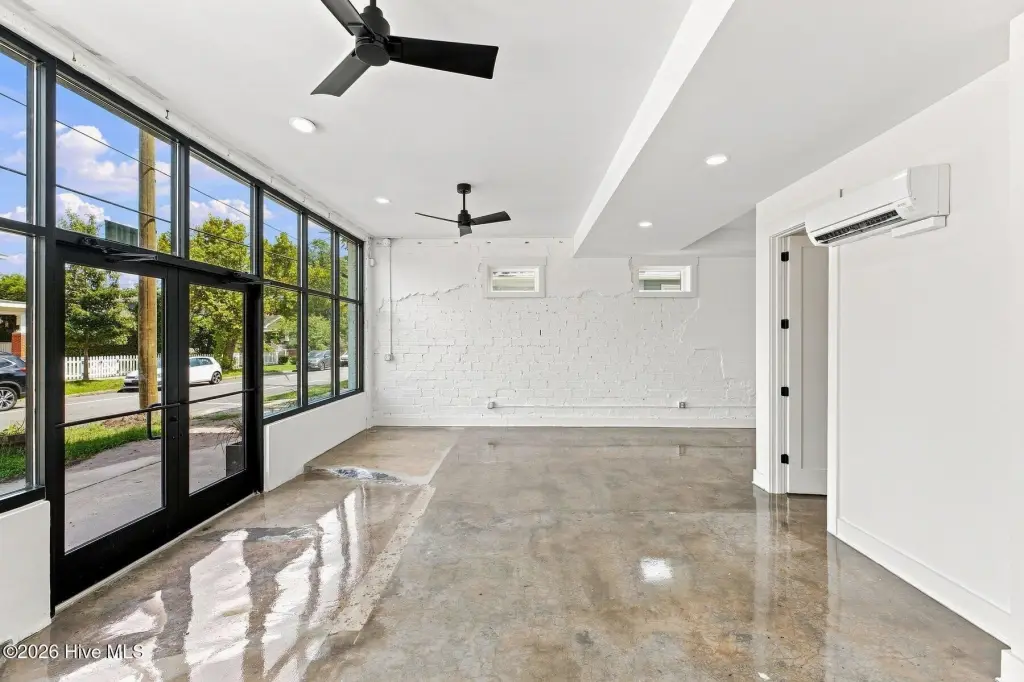
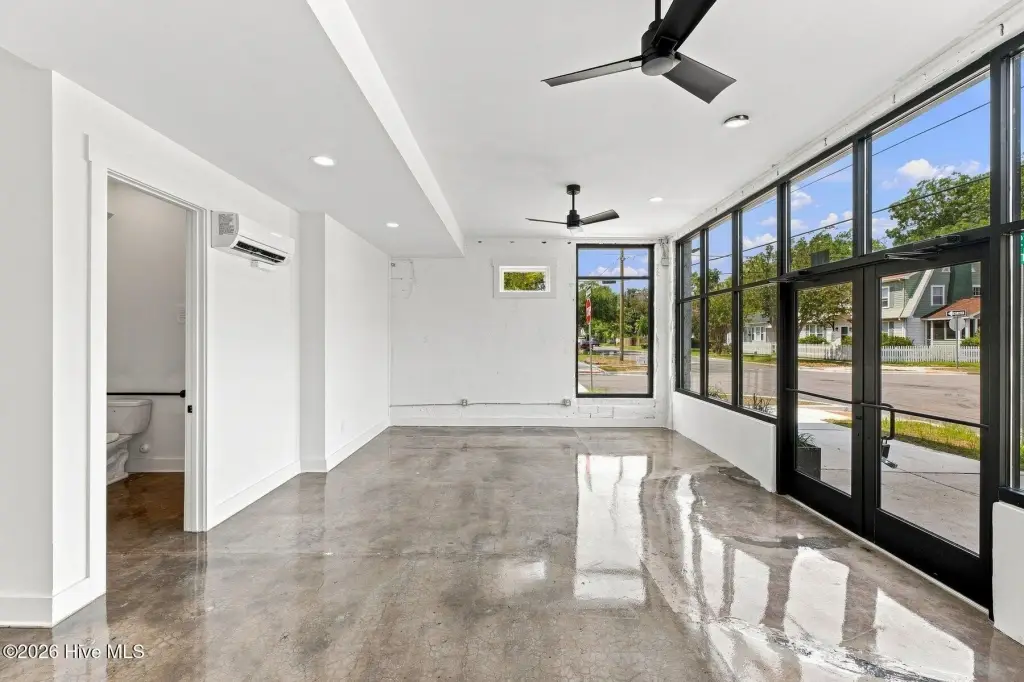
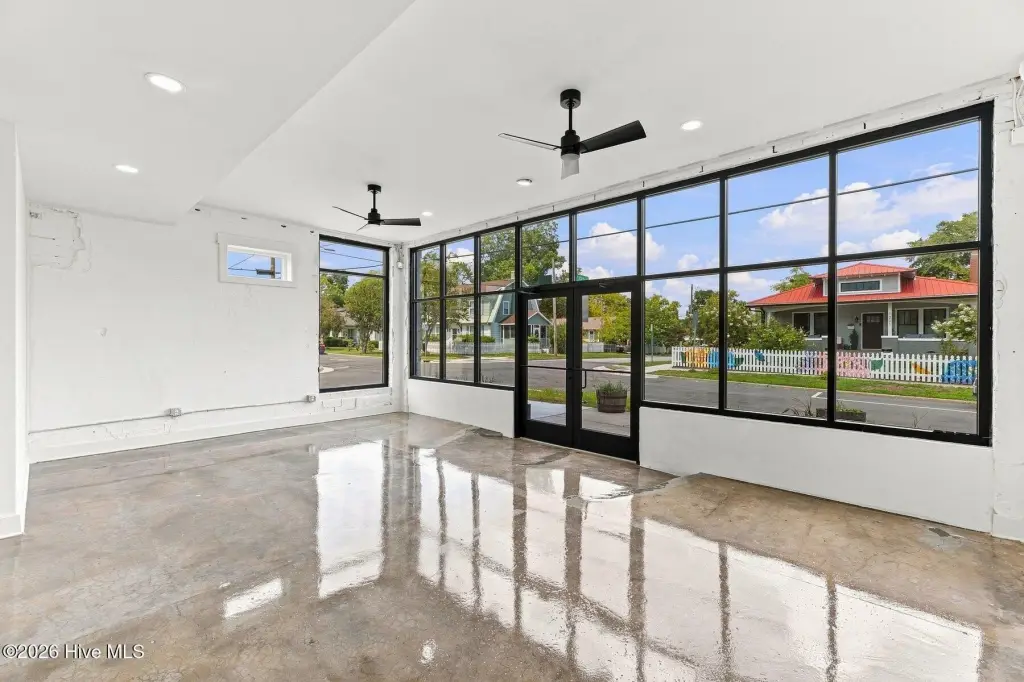
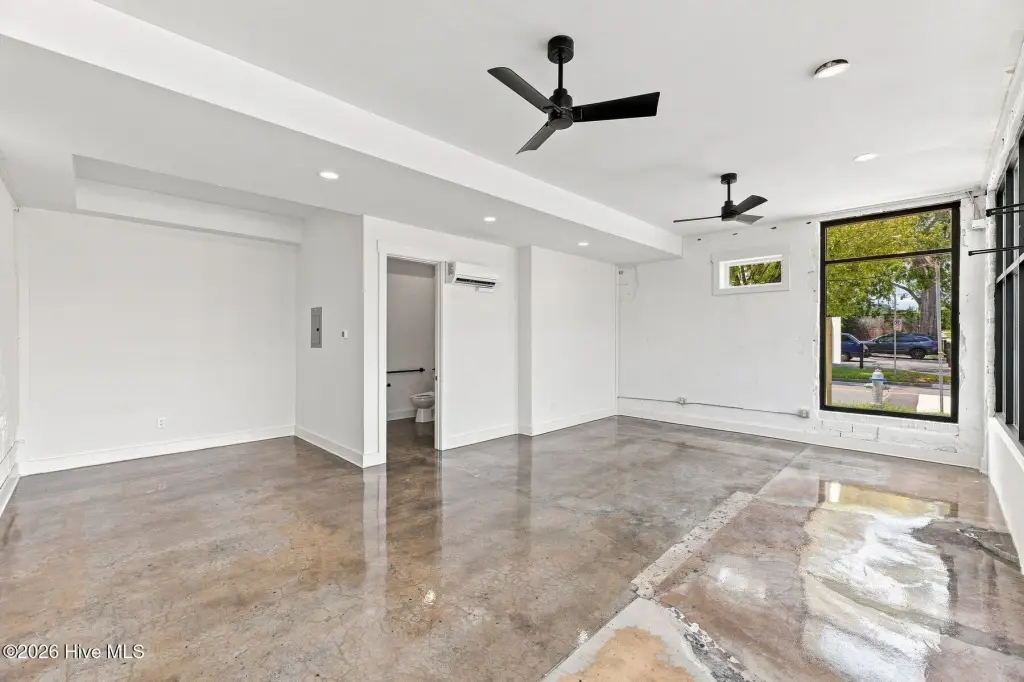
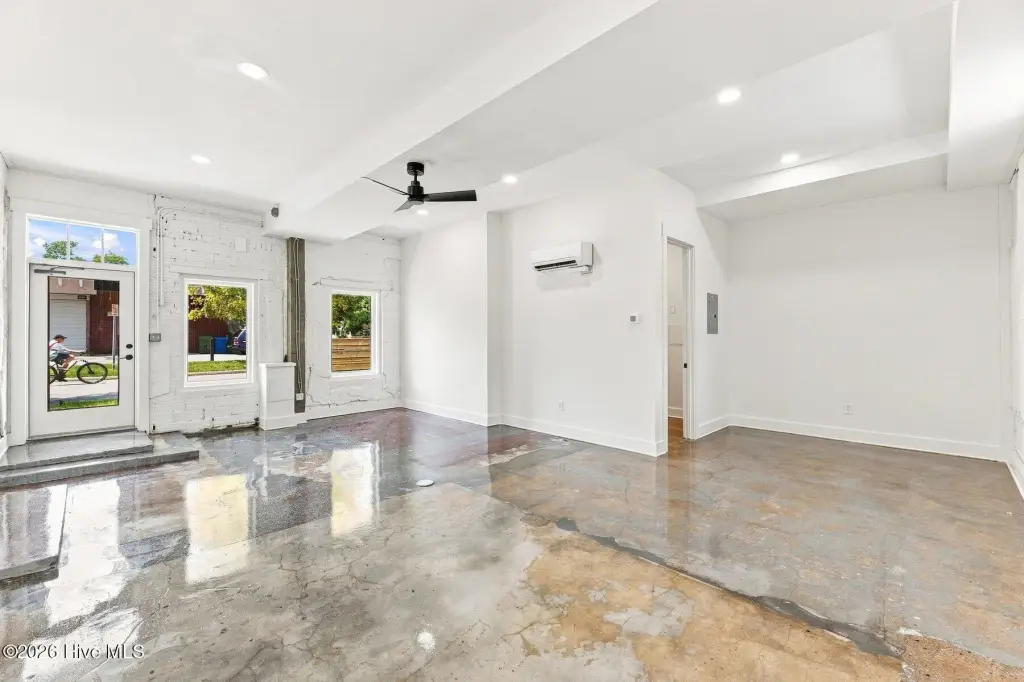
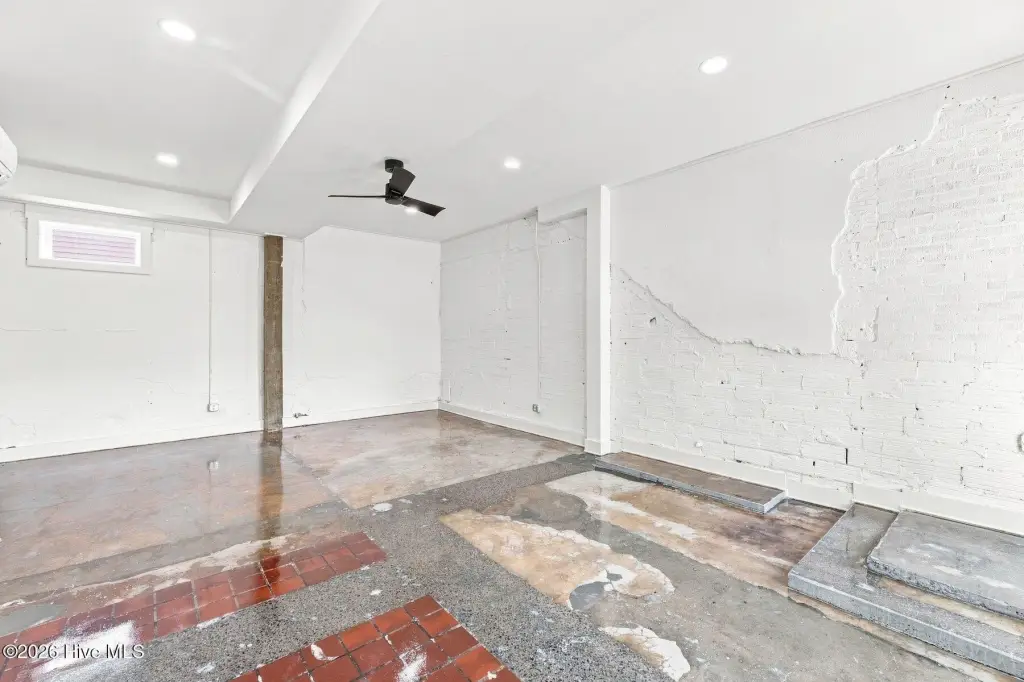
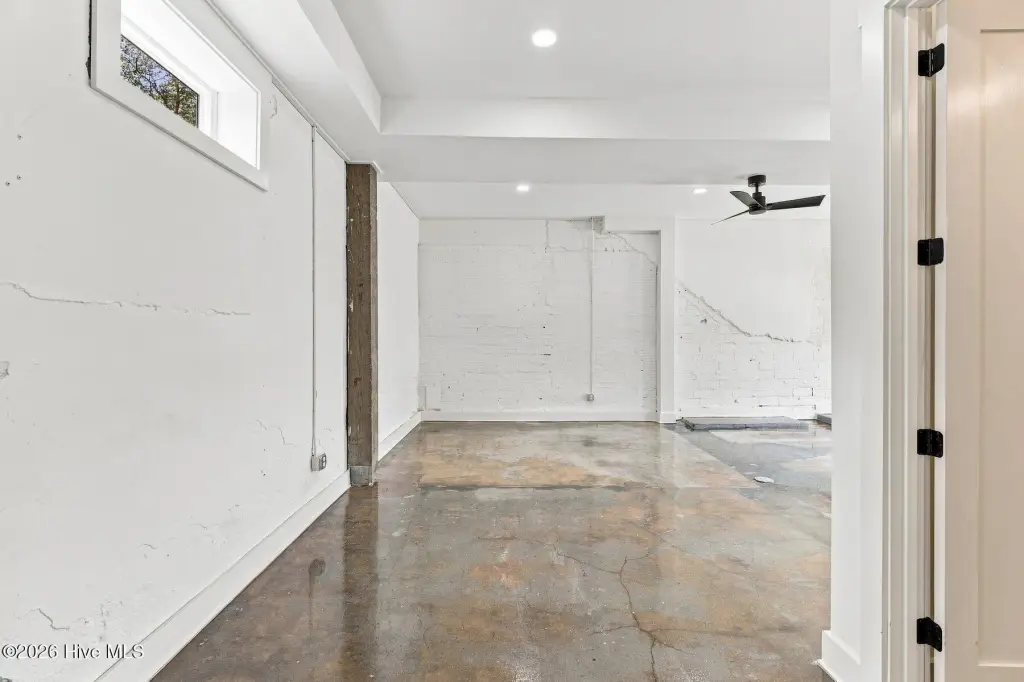
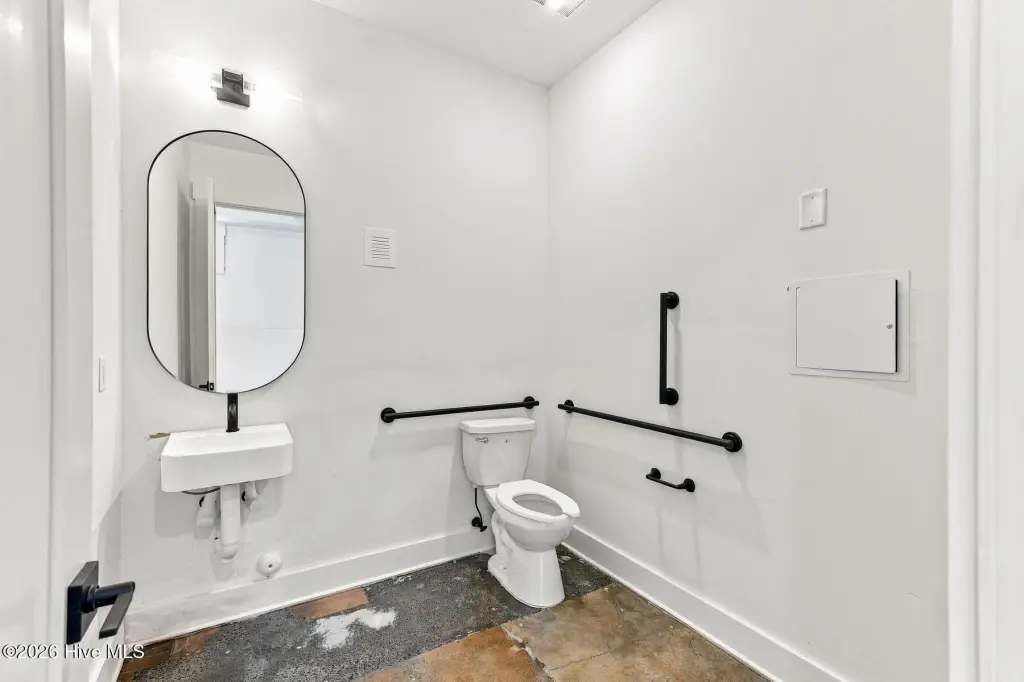
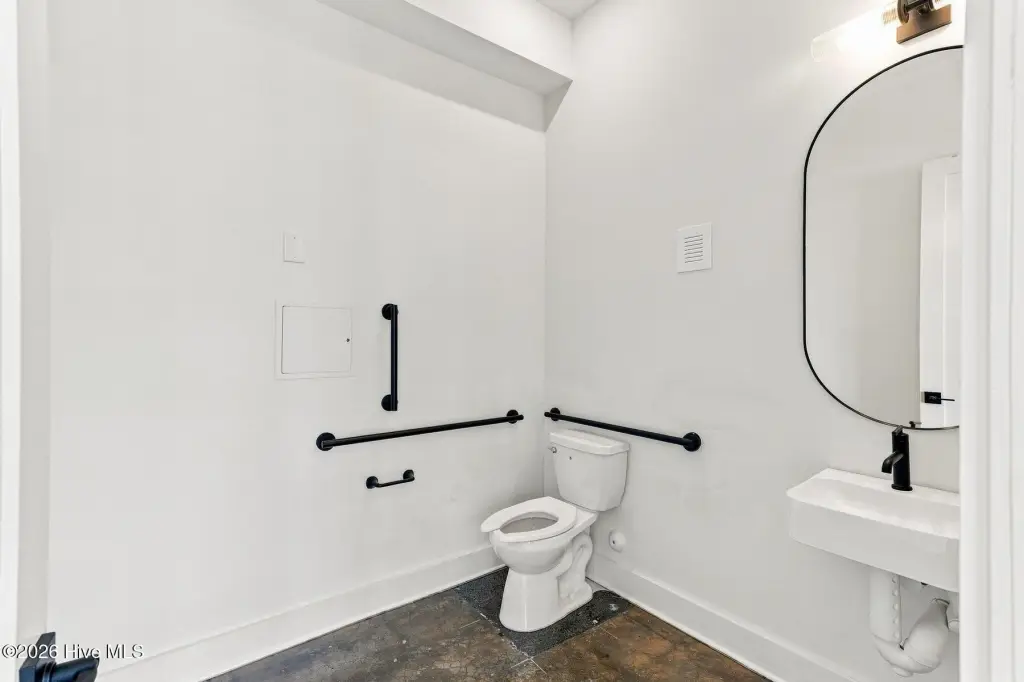
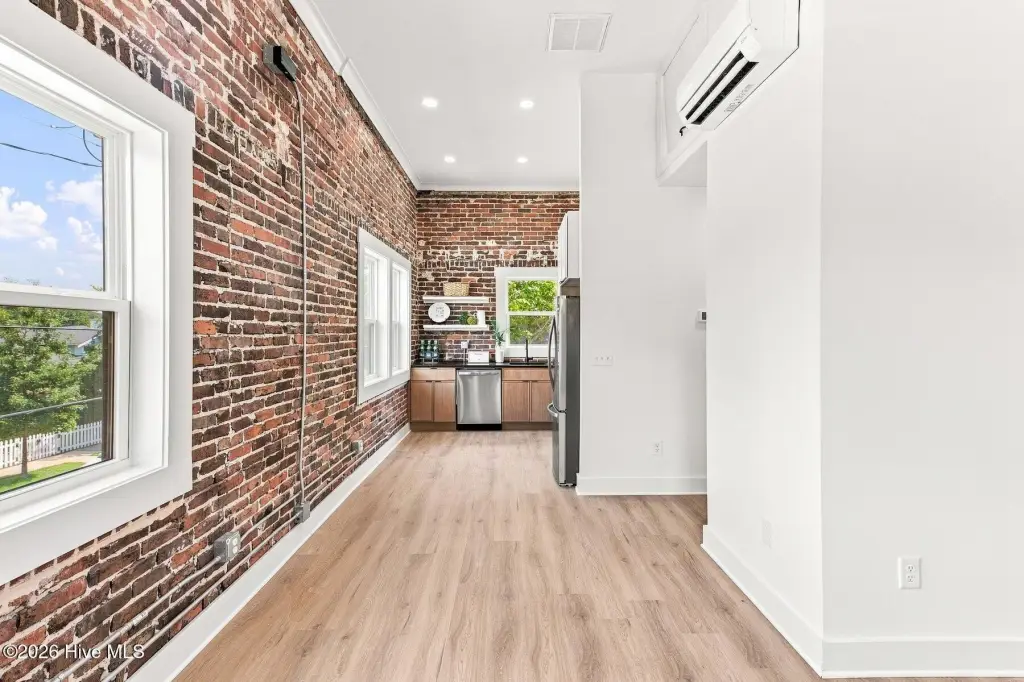
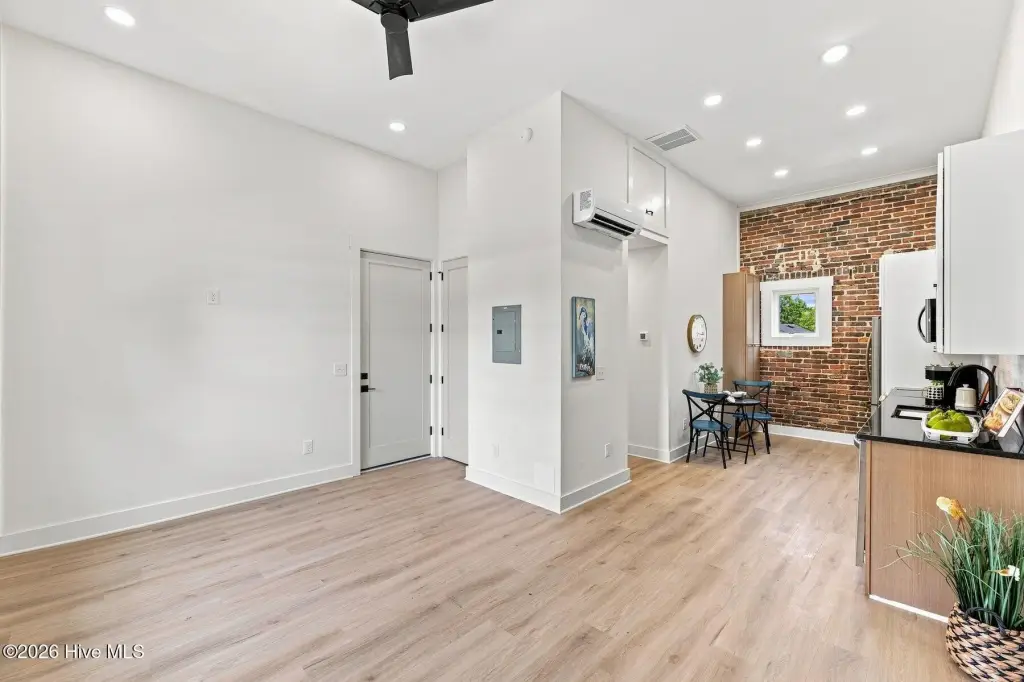
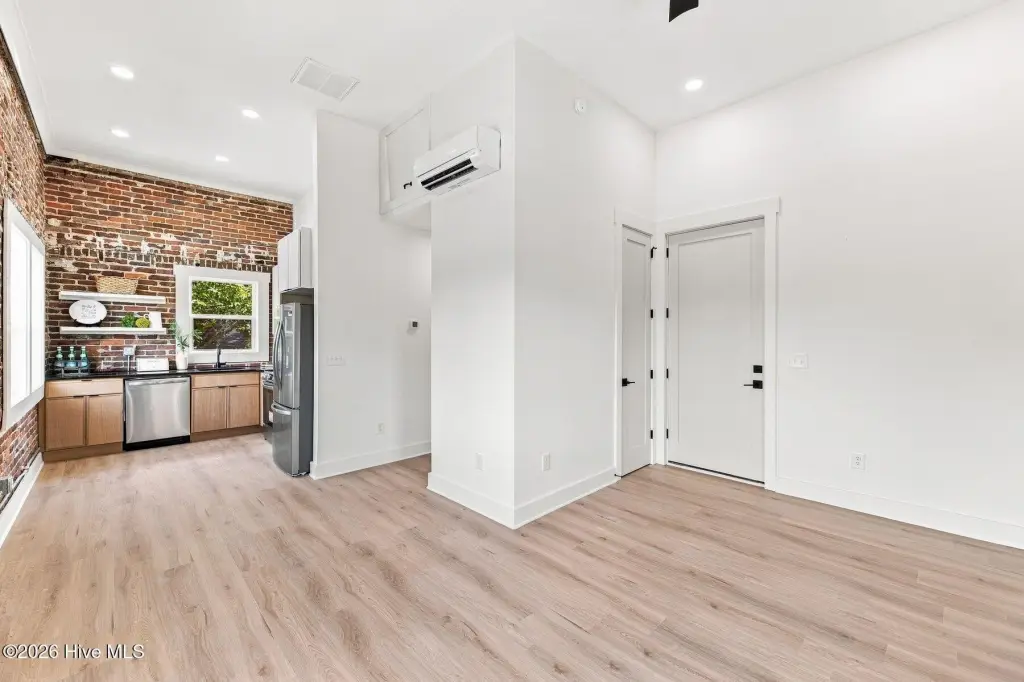
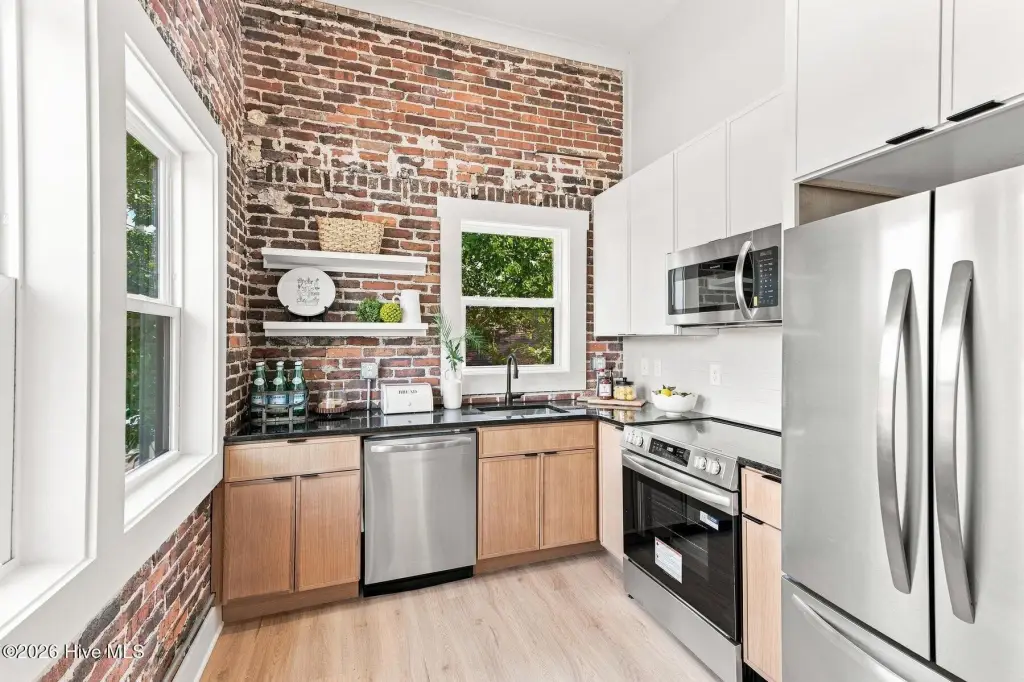
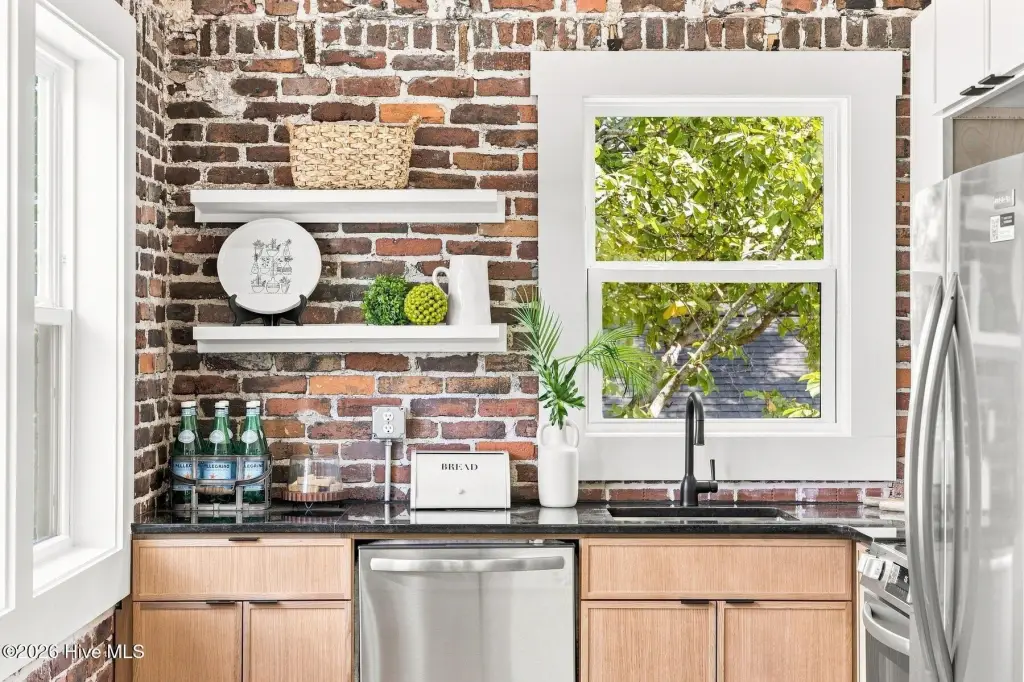
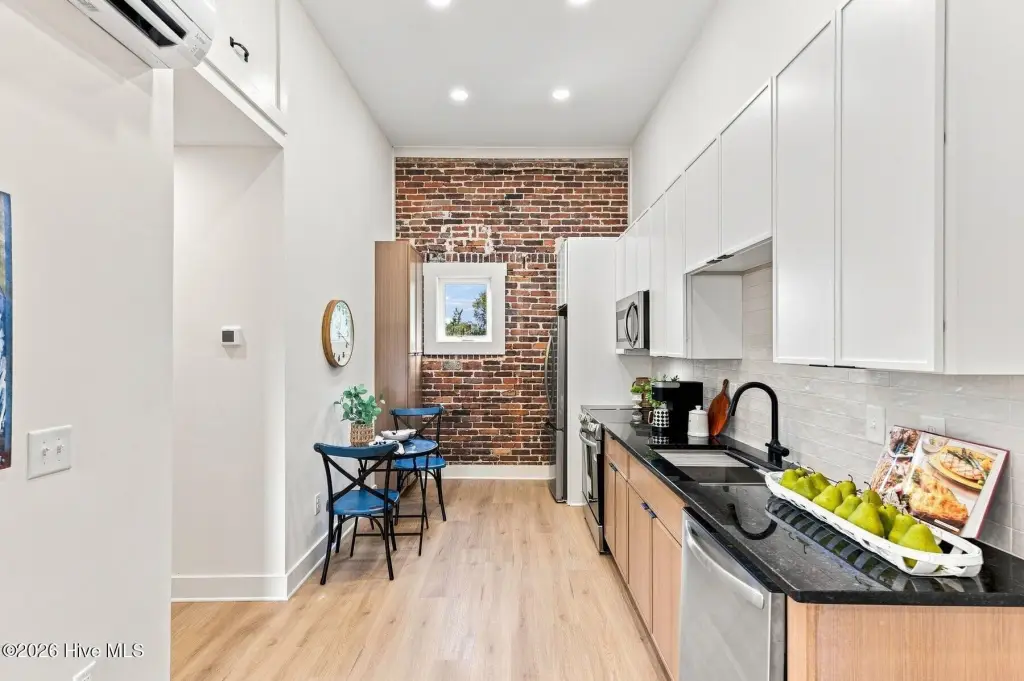
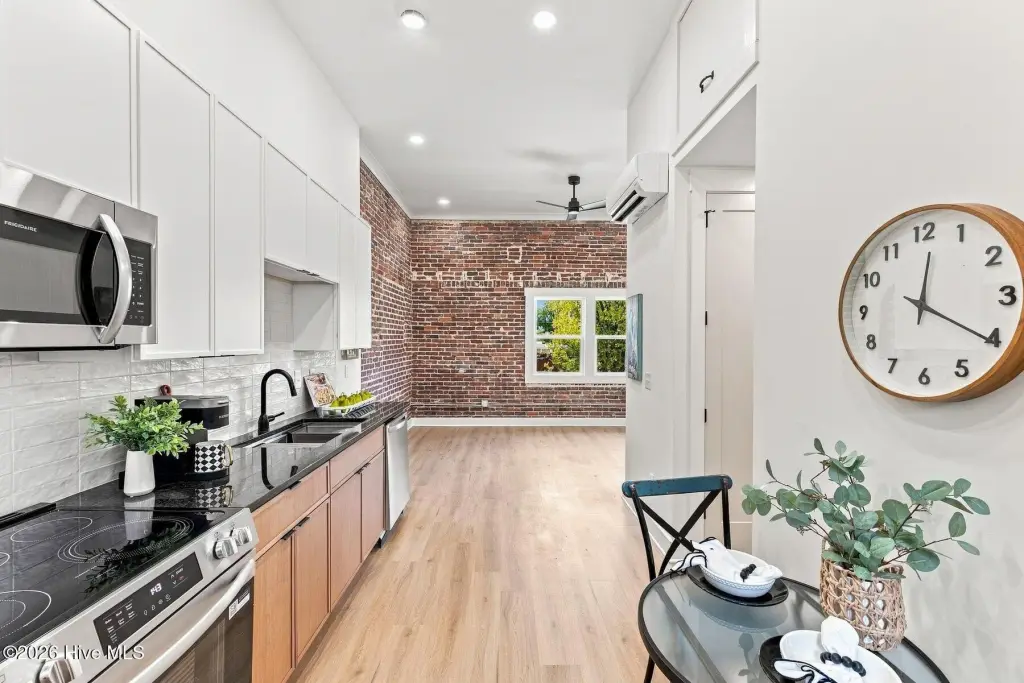
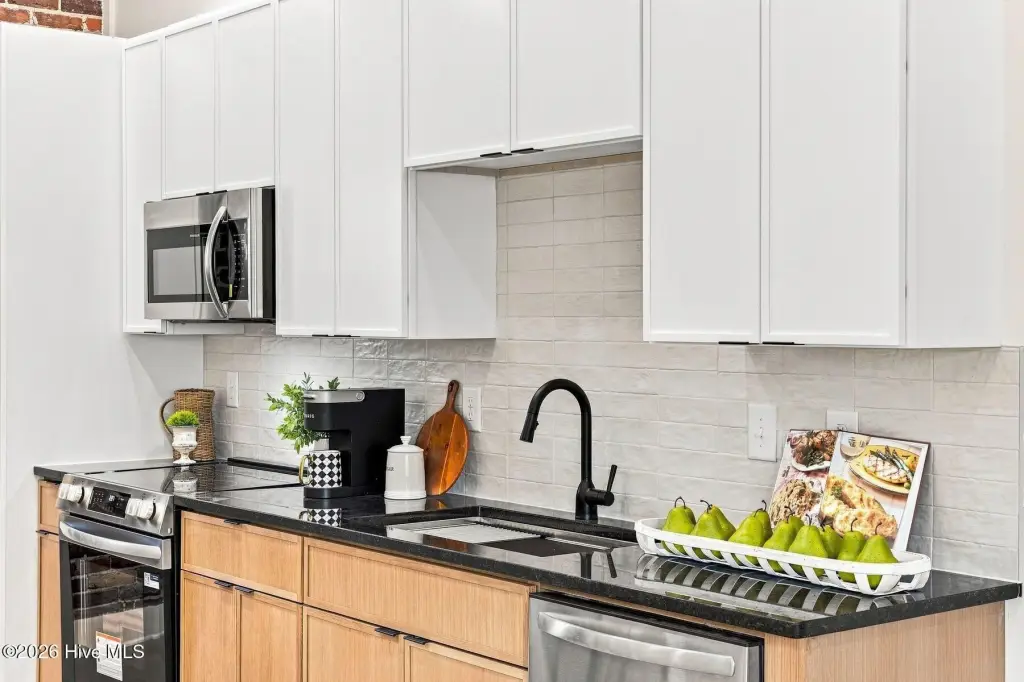
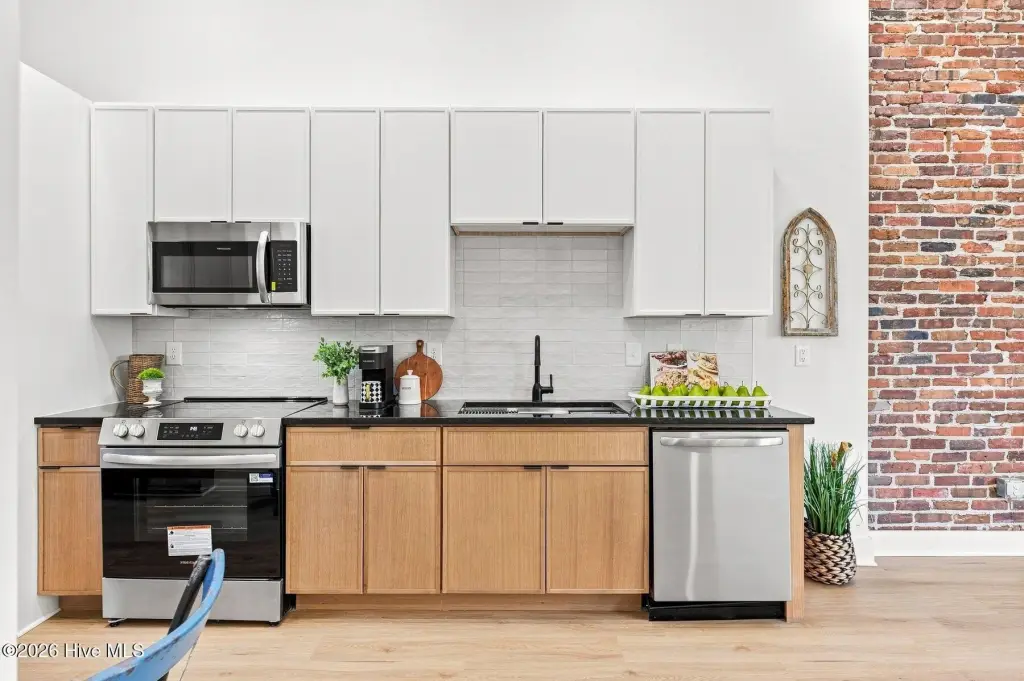
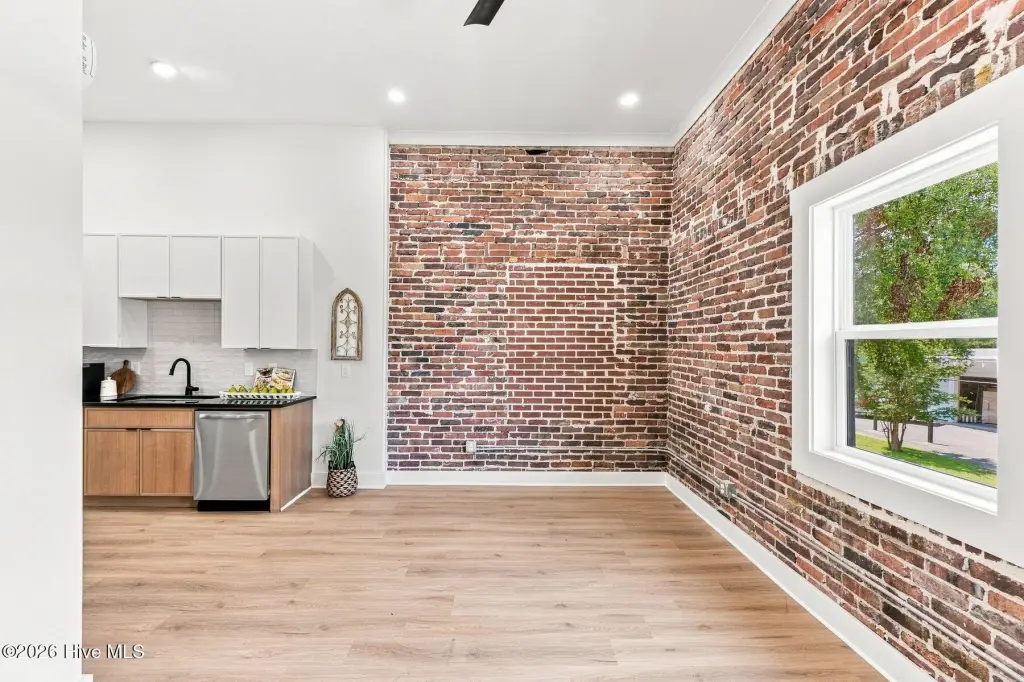
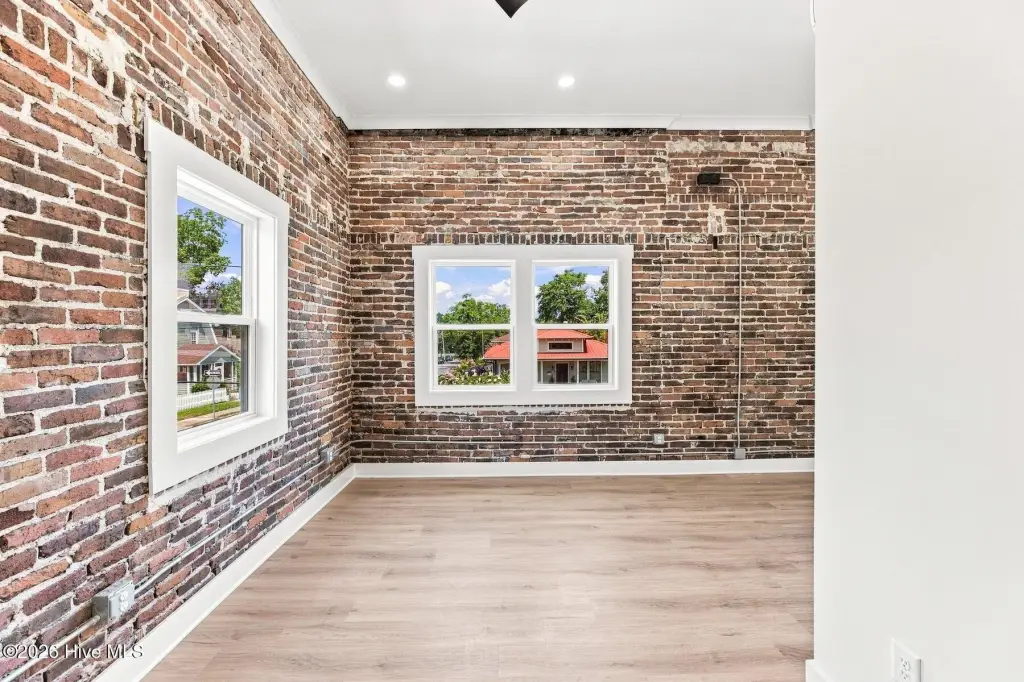
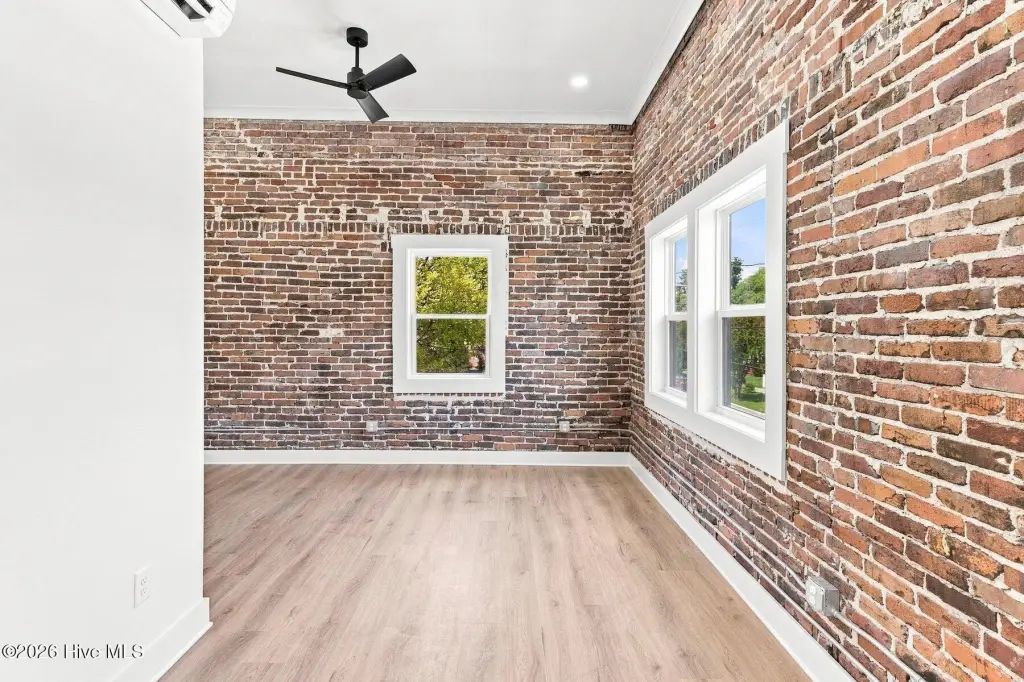
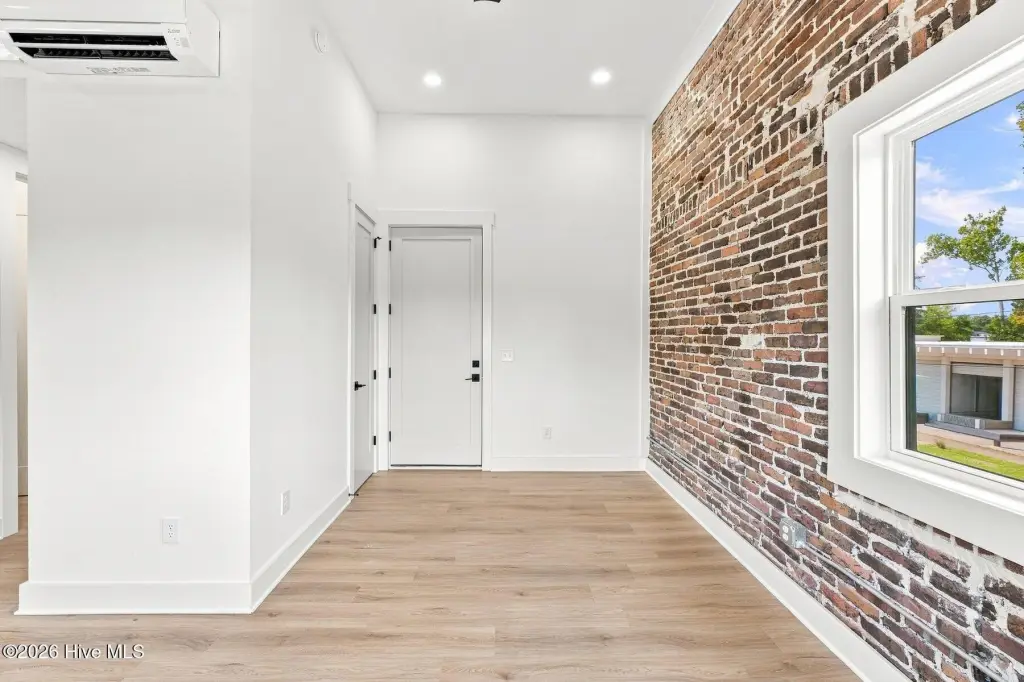
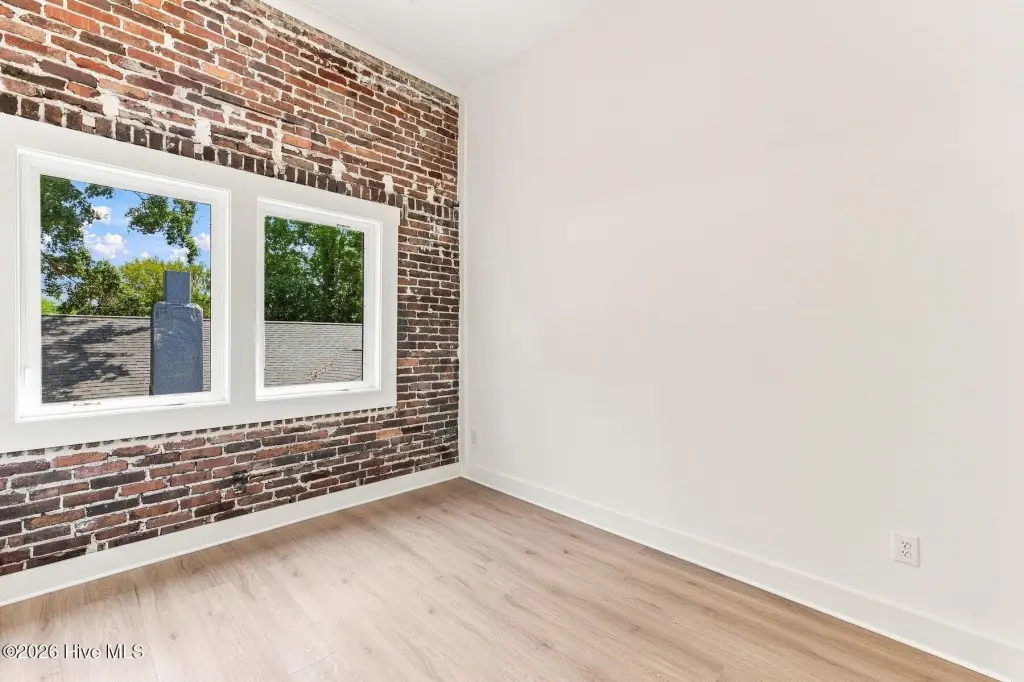
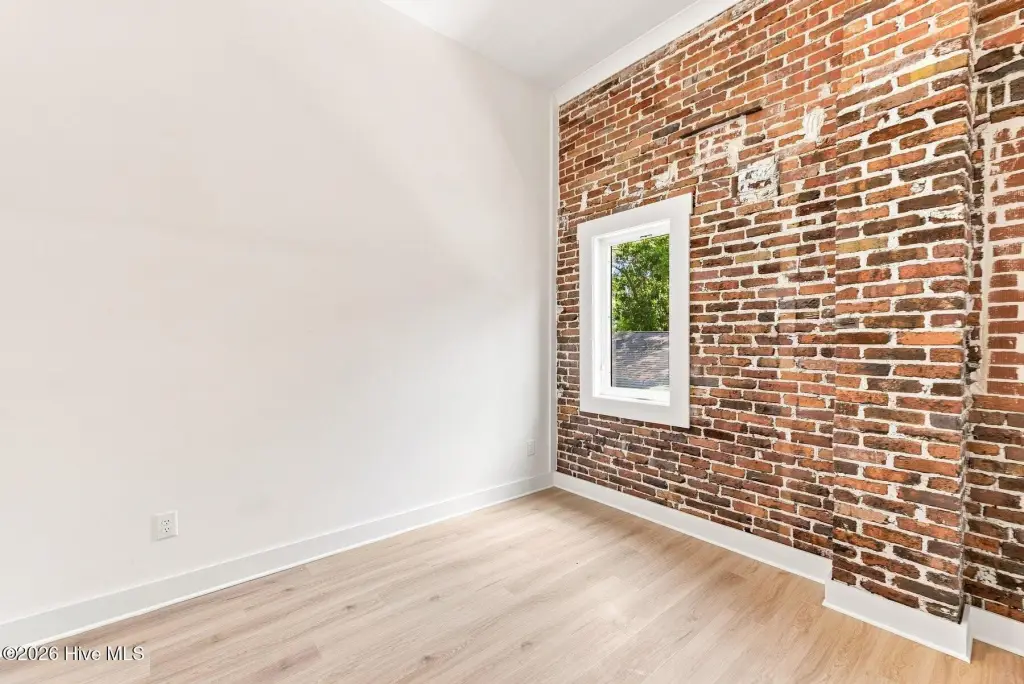
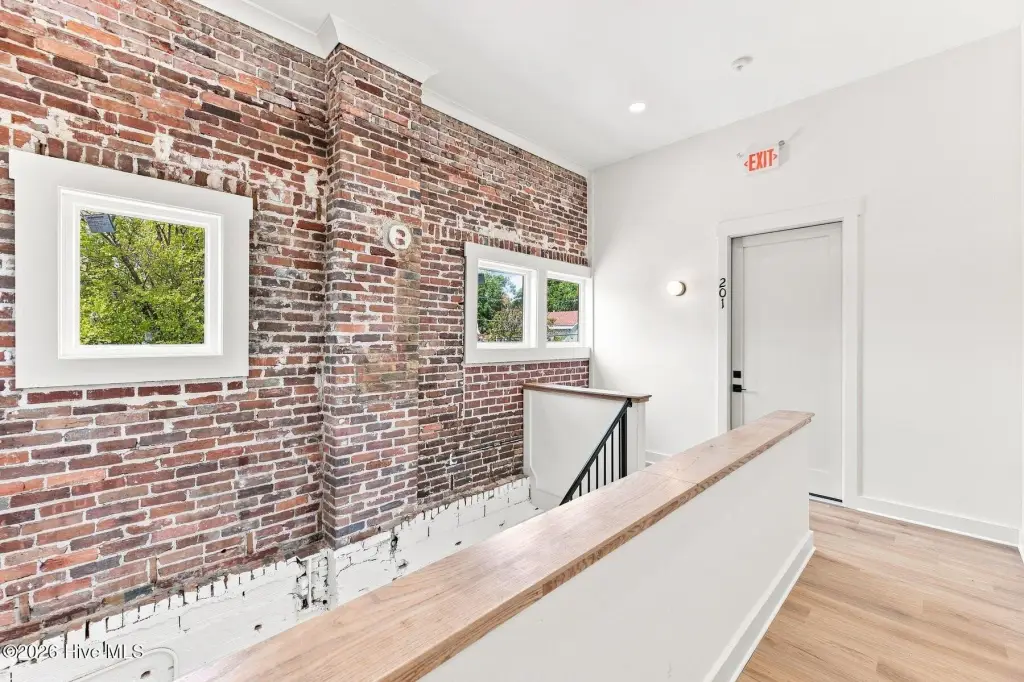
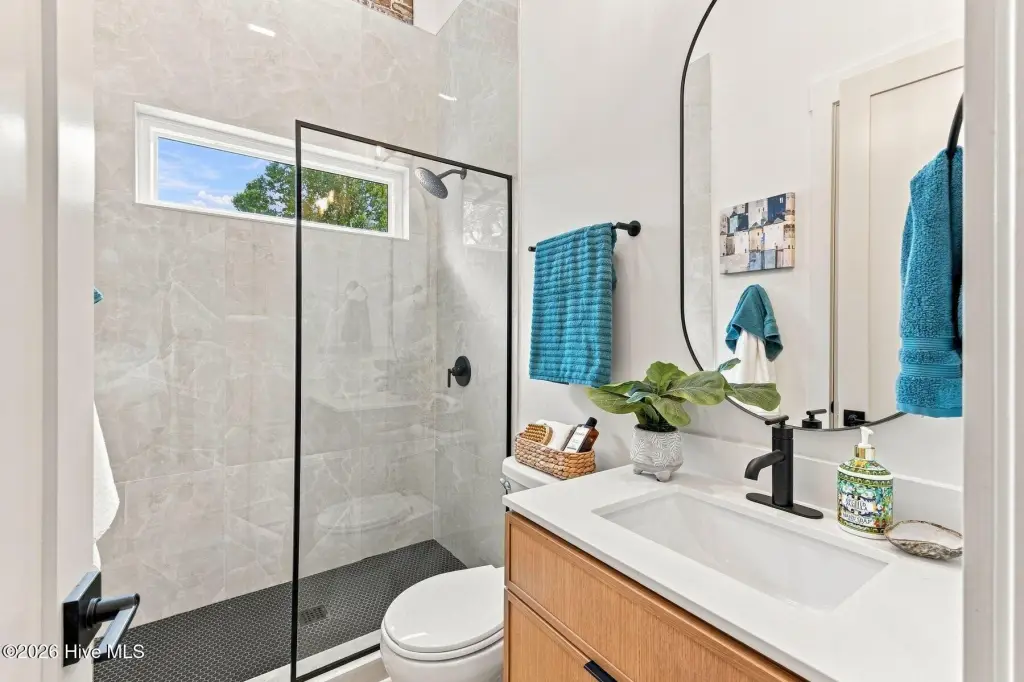
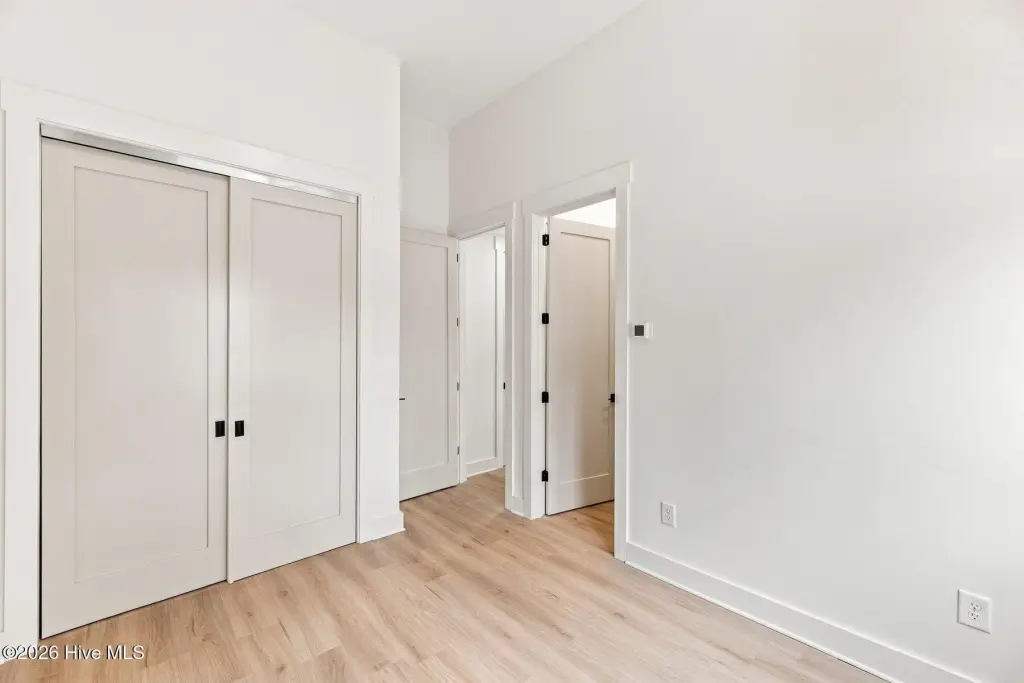
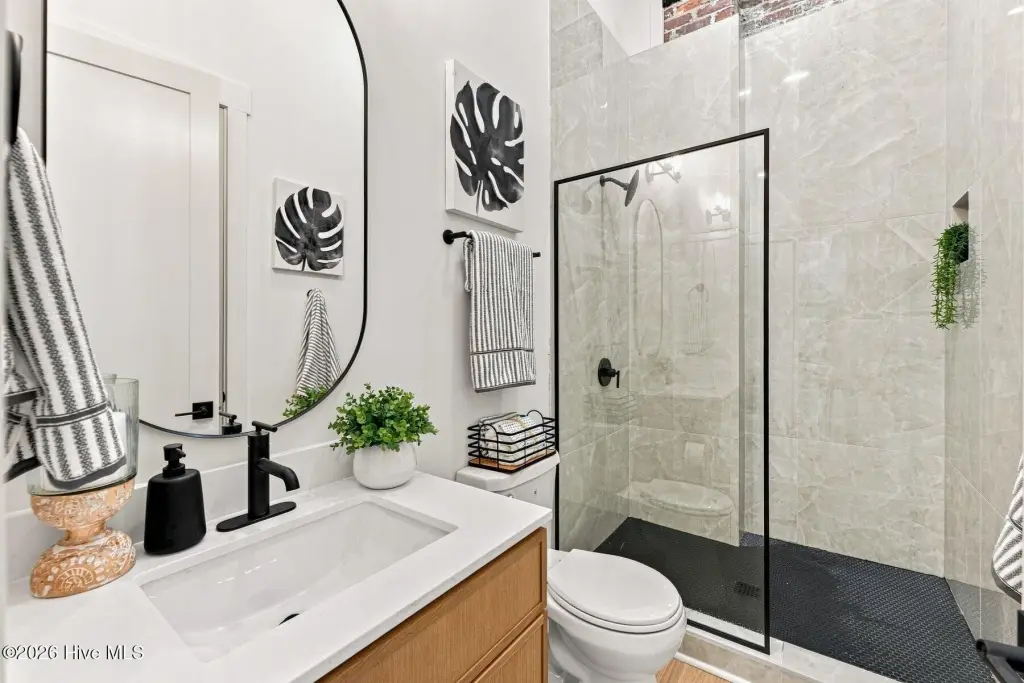
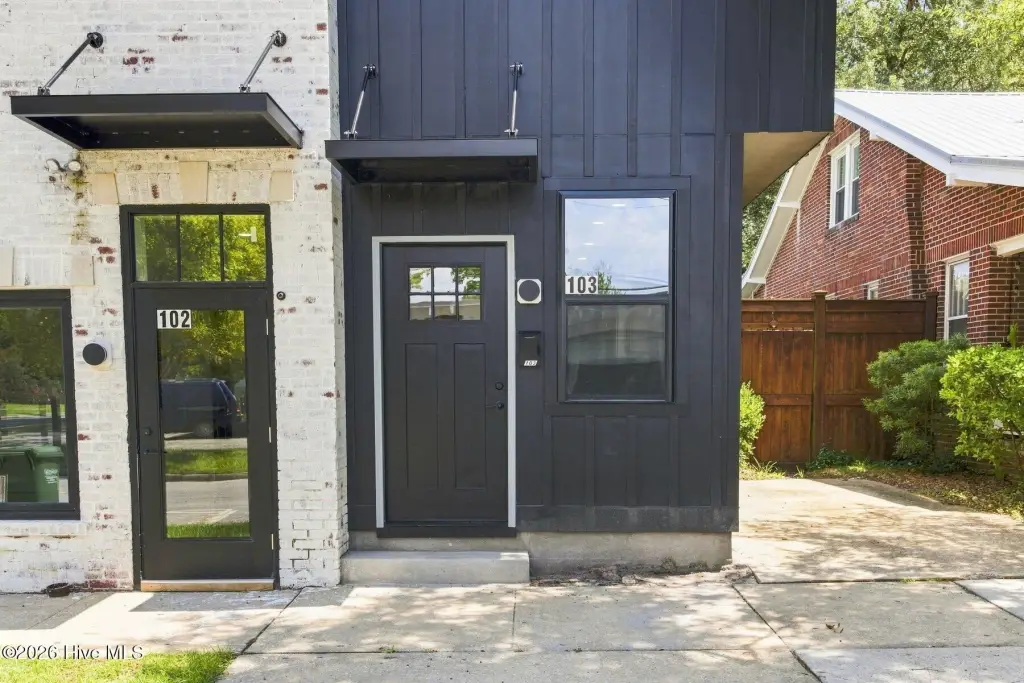
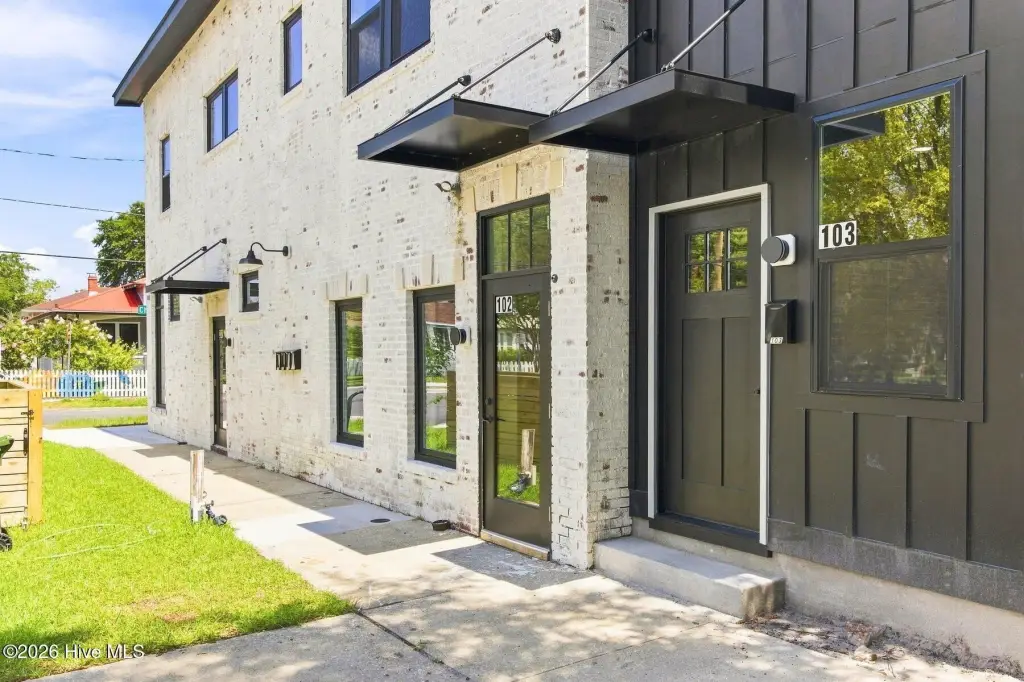
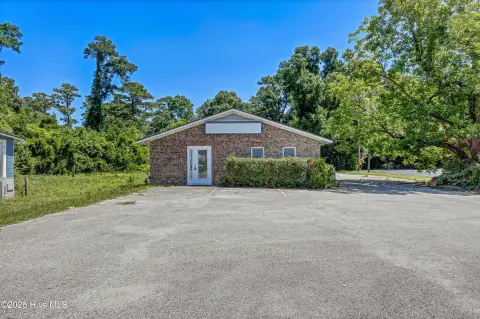
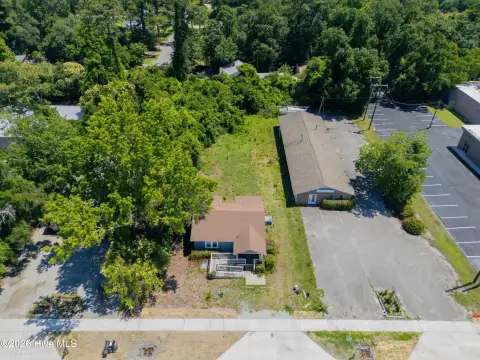
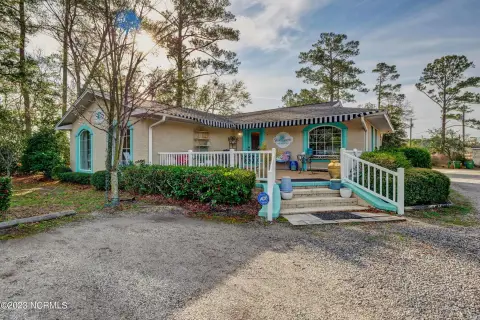
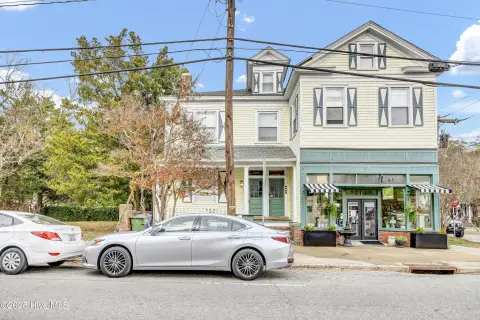
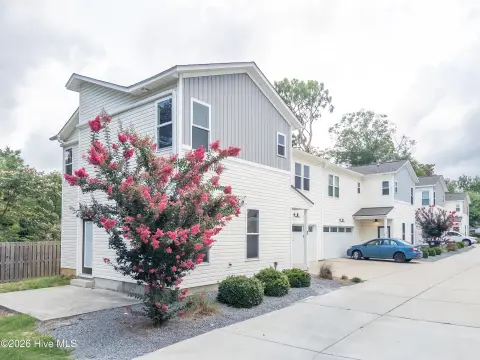
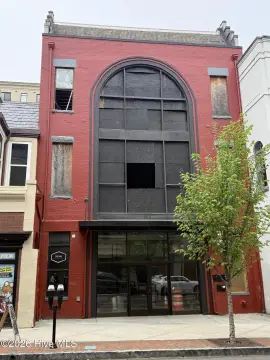
Built in 1931 and substantially renovated, this 3,215-square-foot mixed-use property combines residential and office components within a brick and fiber-cement structure. The layout includes two one-bedroom apartments, two commercial office suites, and a separate studio apartment. Exposed brick, 12-foot ceilings, oversized doors, porcelain-tile showers, and upgraded fixtures add character and contemporary finish quality, while zoned electric heating and multiple cooling units support the interior spaces.
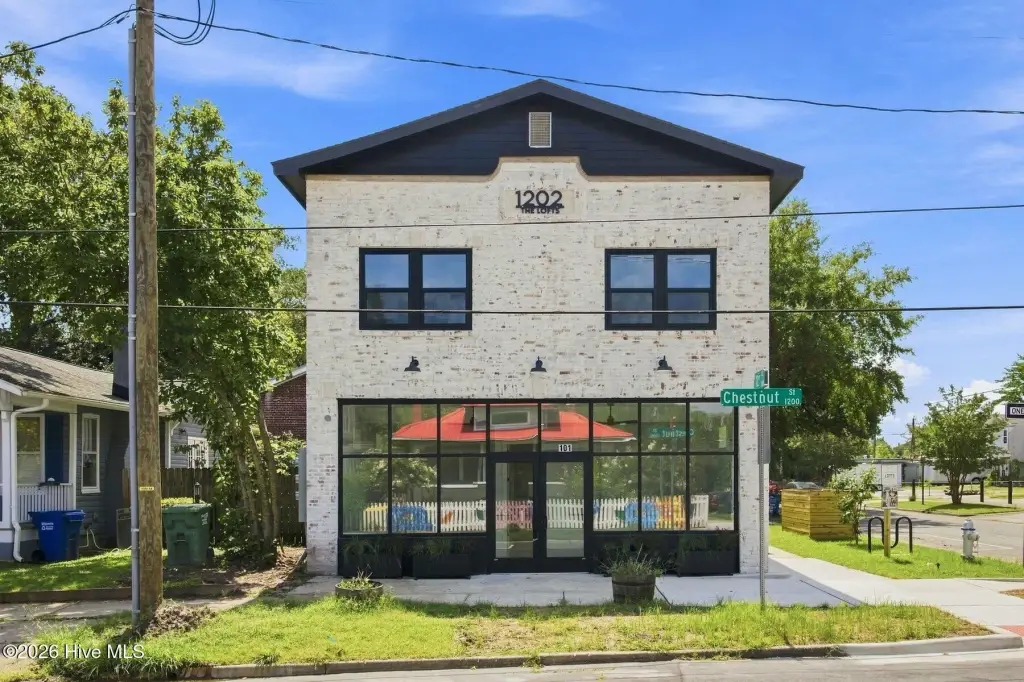
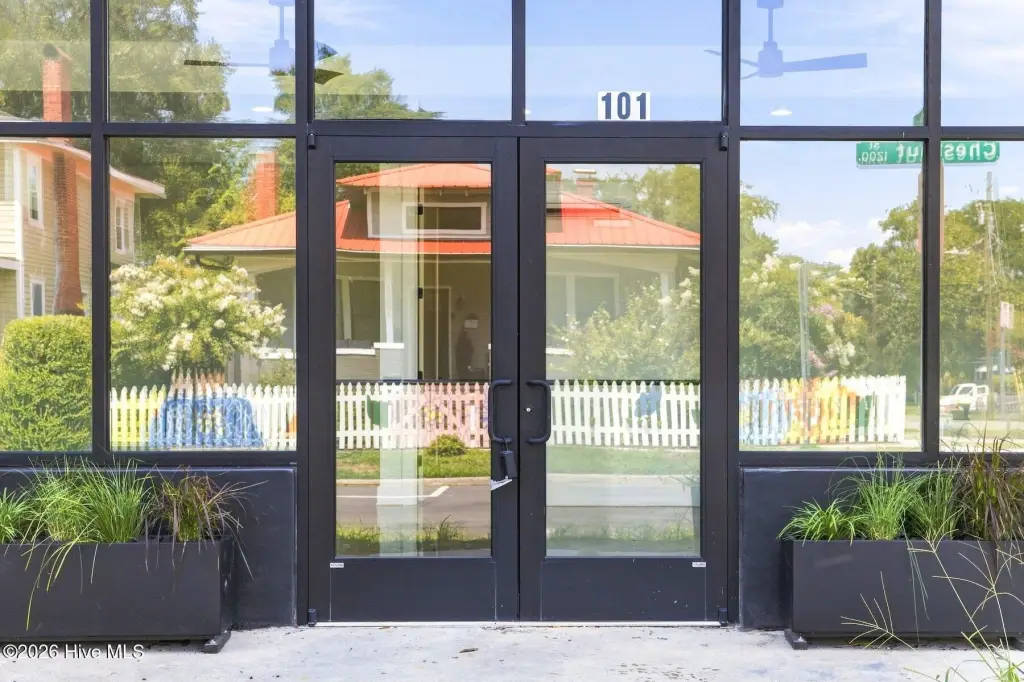
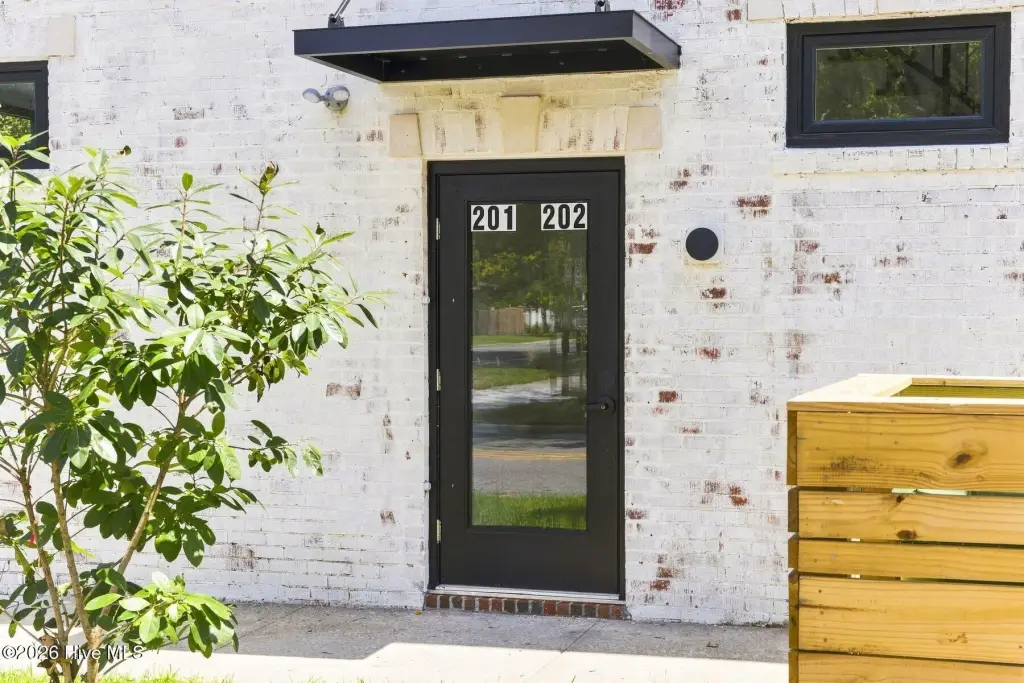
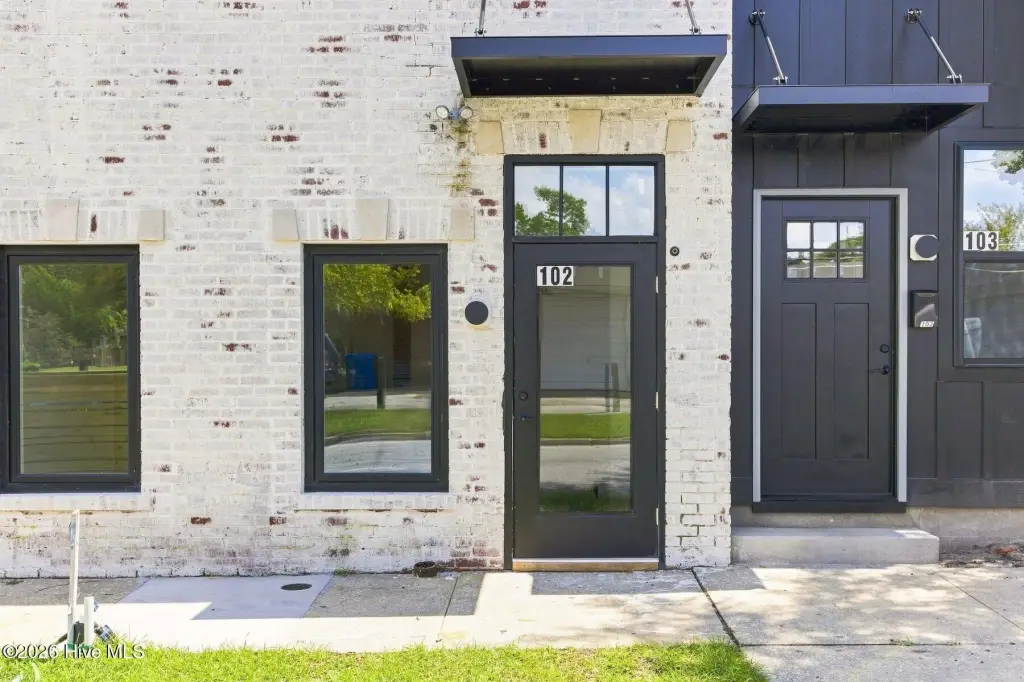
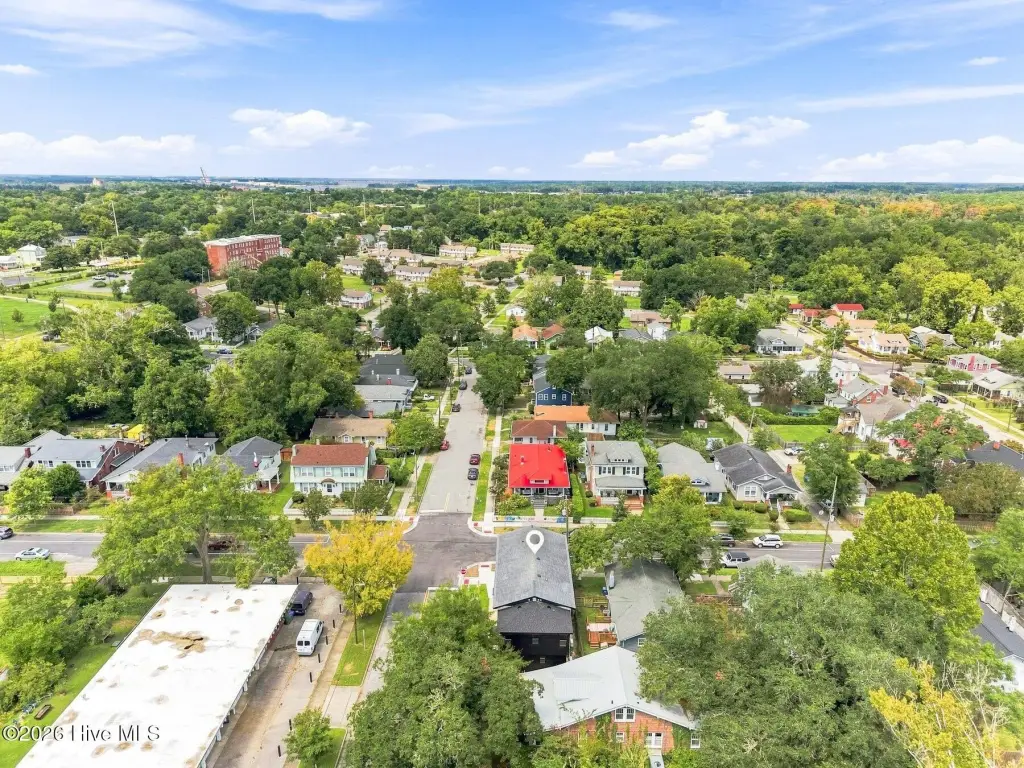
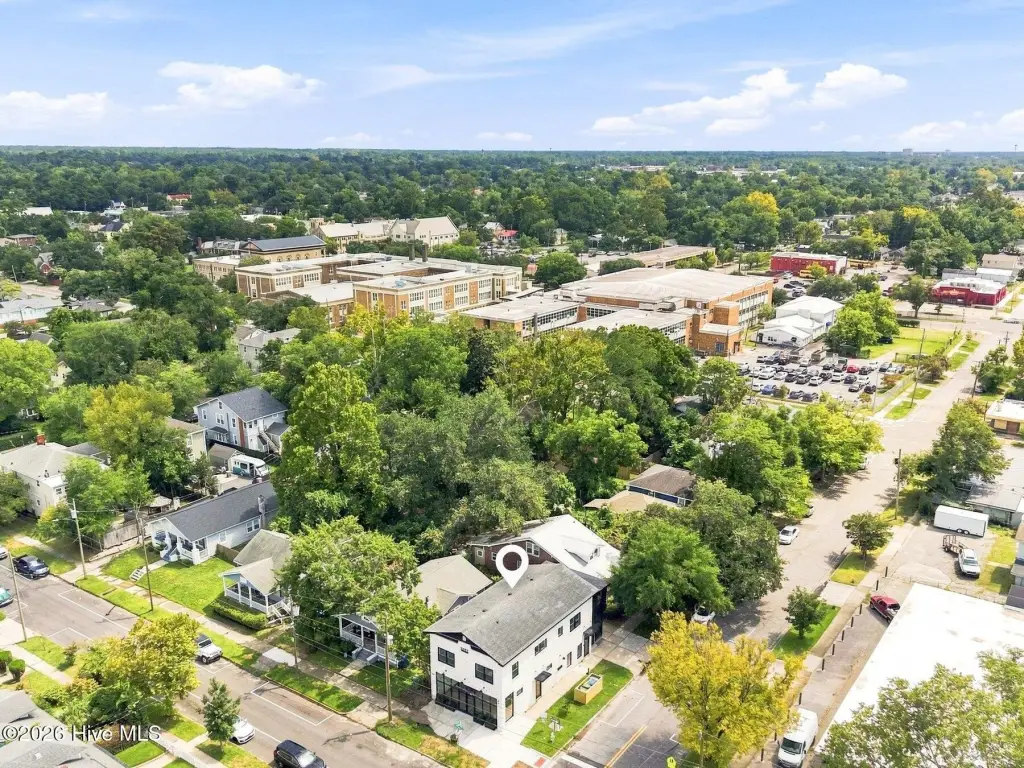
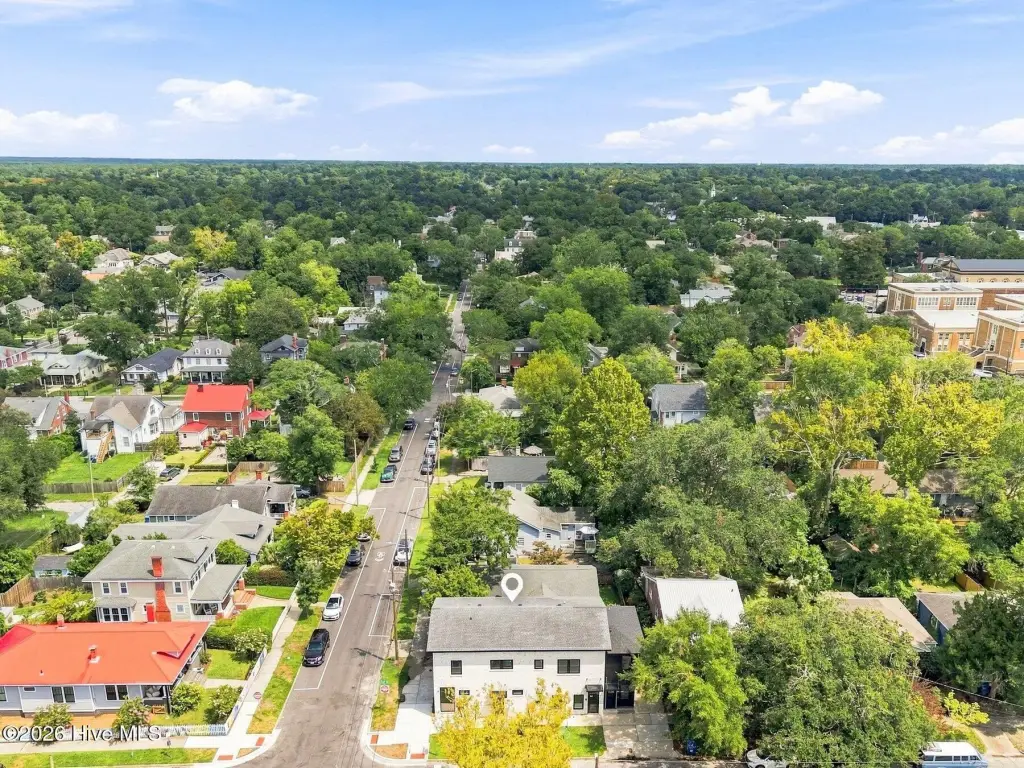
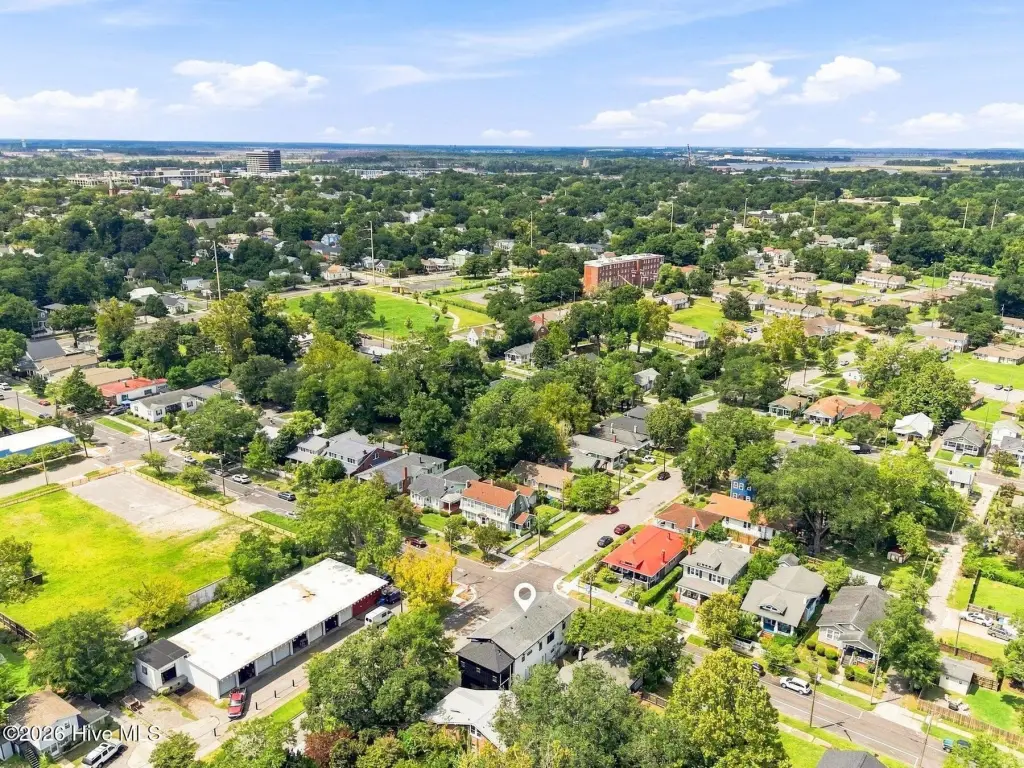
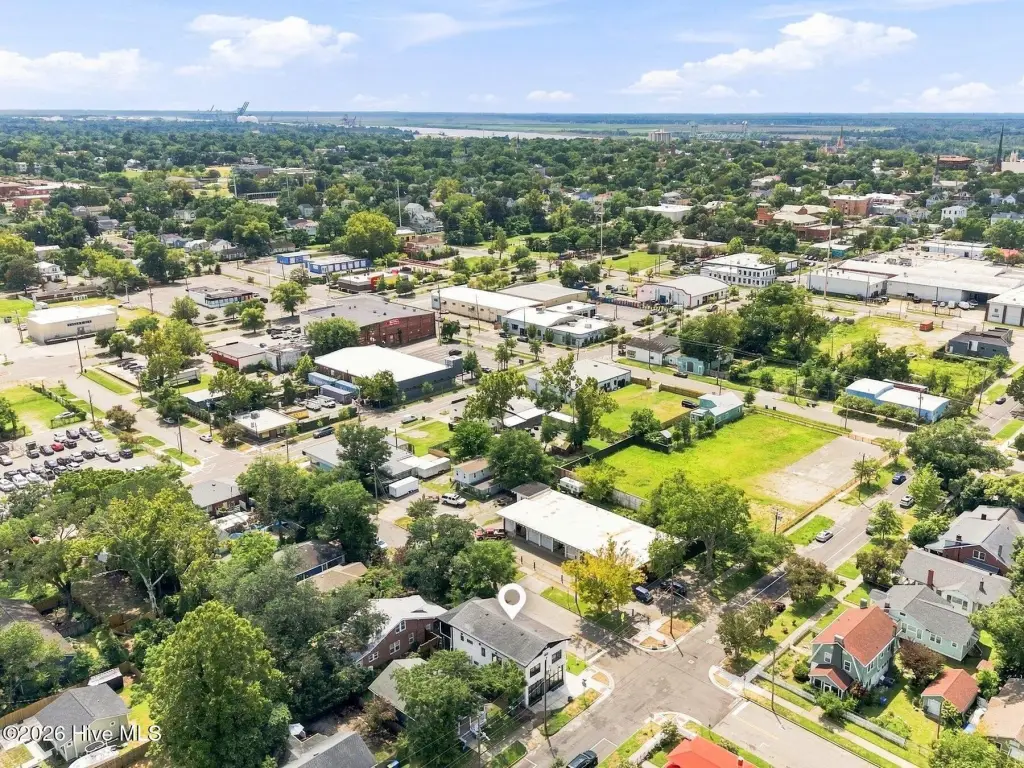
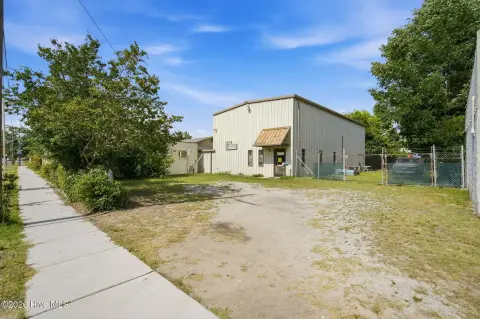
The property occupies 0.04 acres at 1202 Chestnut Street in Wilmington’s downtown Soda Pop District. The street-oriented office suite features a large glass entry, while a second office is positioned toward the rear. Public water, on-street parking, washer/dryer connections, and UMX zoning are also provided.
The property occupies 0.04 acres at 1202 Chestnut Street in Wilmington’s downtown Soda Pop District. The street-oriented office suite features a large glass entry, while a second office is positioned toward the rear. Public water, on-street parking, washer/dryer connections, and UMX zoning are also provided.
Key Highlights
- 3,215‑square‑foot mixed‑use building on 0.04 acres
- Five‑space layout: two one‑bedroom apartments, two office suites, and one studio
- 1931 construction with substantial renovation
Financial Insights
Estimated NOI and Cap Rate
NOI / Yr
$40,831
Cap Rate
2.82%
Suggested Prices Based on Cap Rates
Cap Rate 5%
$816,620
$816.6K
Cap Rate 7%
$583,300
$583.3K
Cap Rate 9%
$453,678
$453.7K
Market Conditions
NOI Build-Up for 3,215 SF
Gross rent
$67.1K $20.88/SF
− Vacancy
−$12.7K −$3.95/SF
EGI
$54.4K $16.93/SF
− OpEx
−$13.6K −$4.23/SF
NOI
$40.8K $12.70/SF
Area
Wilmington, NC
Vacancy
18.90%
Lease Rate
$20.88 /SF/Yr
Expense Ratio
25.00%
Simulate Cap Rate and NOI
Suggested Prices Based on Cap Rates
Cap Rate 5%
$816,620
Cap Rate 7%
$583,300
Cap Rate 9%
$453,678
Alternative Uses
Best Use
Multifamily LT 5
$39.37M
$34.45M – $45.93M
NOI $2,755,605 @ 7.0% cap · market cap 190.04%
Second Best
Mixed Use
$38.77M
$33.92M – $45.23M
NOI $2,713,793 @ 7.0% cap · market cap 187.16%
Theoretical Best
—
—
same as Best Use
Zoning and permitted uses should be independently verified with authorities.
How Realmo checks its estimates
Property Analytics
Unlock full access to Insights
Subscribe to Realmo Intelligence
Open Analytics
Current Use
Lease Details
2
Office units
Multi-tenant
Tenancy
Location Intelligence
Trade Area within ½ mile
1,148
Businesses Nearby
Explore this area
Business Placement
Demographics for 28401, NC
22,204
Population
13,017
Households
1.7
Avg Household Size
41
Median Age
34%
College-Educated
88%
High-School Grad
31.0 sq mi
ZIP Area
716
Density / Sq Mi
$52,159
Median Household Income
$35,739
Median Earnings
$1,183
Median Rent
$263,000
Median Home Value
Check the figures for this property
Cap Rate, Value Estimation, Potential NOI and more
View Realmo Analytics
Market
Vacancy Rate% for Office in South region





Frequently Asked Questions
What type of property is this?
Mixed-use property - Historic downtown property combines apartments, office suites, updated interiors, and flexible professional-use space.
Where is this mixed-use property located?
The property is located at 1202 Chestnut Street Wilmington, NC.
What is the asking price?
The asking price for this property is $1,450,000.
What are key features of this property?
This property features: 3,215‑square‑foot mixed‑use building on 0.04 acres; Five‑space layout: two one‑bedroom apartments, two office suites, and one studio; 1931 construction with substantial renovation


