Restaurant Ready with Exhaust
For Sale
Contact for pricing
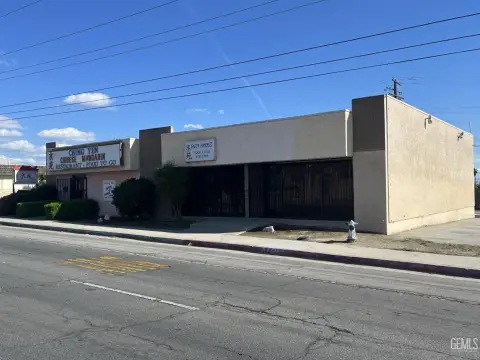
1201 Columbus St, Bakersfield, CA 93305
Remodeled restaurant space with motivated landlord and concessions available.
Property Size3,950 SF
Price / SF$113.92
Days on Market261

Ask AI about this property
Review the available facts, identify missing information and prepare questions for the agent.
Property Features for 1201 Columbus St
General Information
Standard status
Active
Size
3,950 SF
Property subtype
Retail
Building Details
Buildings
1
Stories
1
Listing Agency:
Jobah's Commercial
Listed By:
Abdul Jobah, CCIM · License #CA 02213635
(661) 834-3997
Source:
Crexi
Added: Jan 27
Changed: Oct 15
Last Checked: Oct 14 at 11:36PM
Displayed information is deemed reliable but is not guaranteed and should be independently verified. All listing content including descriptions, pricing, images are the copyrighted material of Jobah's Commercial
Investment Insights
Based on property information with market context.
This building is equipped with a 10ft exhaust hood and fire suppression system, making it ready for restaurant operations. The building was remodeled as of January 2026. The landlord is offering concessions, including tenant improvement allowances and a concession on the first six months of rent. This could be the start of a very profitable venture. The property is 3950 square feet.
Key Highlights
- Turnkey space ready for a thriving restaurant business.
- 10ft exhaust hood with fire suppression system READY TO OPERATE for a restaurant.
- Landlord is highly motivated and offering significant concessions (tenant improvement allowances and rent concession for the first six months).
Financial Insights
Estimated NOI and Cap Rate
NOI / Yr
$40,527
Cap Rate
9.01%
Suggested Prices Based on Cap Rates
Cap Rate 5%
$810,540
$810.5K
Cap Rate 7%
$578,957
$579.0K
Cap Rate 9%
$450,300
$450.3K
Market Conditions
NOI Build-Up for 3,950 SF
Gross rent
$56.9K $14.40/SF
− Vacancy
−$2.8K −$0.72/SF
EGI
$54.0K $13.68/SF
− OpEx
−$13.5K −$3.42/SF
NOI
$40.5K $10.26/SF
Area
Bakersfield, CA
Vacancy
5.00%
Lease Rate
$14.40 /SF/Yr
Expense Ratio
25.00%
Simulate Cap Rate and NOI
Suggested Prices Based on Cap Rates
Cap Rate 5%
$810,540
Cap Rate 7%
$578,957
Cap Rate 9%
$450,300
Alternative Uses
Best Use
Specialty Retail
$579.0K
$506.6K – $675.5K
NOI $40,527 @ 7.0% cap · market cap 9.01%
Second Best
—
—
no second resolved use
Theoretical Best
Office A
$1.05M
$917.2K – $1.22M
NOI $73,375 @ 7.0% cap · market cap 16.31%
Zoning and permitted uses should be independently verified with authorities.
How Realmo checks its estimates
Property Analytics
Unlock full access to Insights
Subscribe to Realmo Intelligence
Open Analytics
Current Use
Location Intelligence
Trade Area within ½ mile
528
Businesses Nearby
157k
Monthly Visits Nearby
Under-served
Demand for This Use
Explore this area
Business Placement
Foot Traffic Nearby
Groceries 33%
Shops & Services 23%
Dining 22%
Home Improvements & Furnishings 20%
Foods Co
Groceries
52,229 visits/mo
0.4 miles
Lowe's
Home Improvements & Furnishings
31,365 visits/mo
0.4 miles
Dutch Bros. Coffee
Dining
24,820 visits/mo
0.3 miles
Dollar Tree
Shops & Services
22,630 visits/mo
0.3 miles
7-Eleven
Shops & Services
6,917 visits/mo
0.4 miles
Demographics for 93305, CA
38,392
Population
11,824
Households
3.2
Avg Household Size
29
Median Age
9%
College-Educated
64%
High-School Grad
5.8 sq mi
ZIP Area
6,619
Density / Sq Mi
$41,290
Median Household Income
$27,936
Median Earnings
$1,065
Median Rent
$245,000
Median Home Value
Check the figures for this property
Cap Rate, Value Estimation, Potential NOI and more
View Realmo Analytics
Market
Vacancy Rate% for Retail in Bakersfield, CA





Similar Off Market Nearby
- Contreras Catering — 606 Columbus St A, Bakersfield, CA 93305
Frequently Asked Questions
What type of property is this?
Restaurant - Remodeled restaurant space with motivated landlord and concessions available.
Where is this restaurant located?
The property is located at 1201 Columbus St Bakersfield, CA.
What is the asking price?
The asking price for this property is $450,000.
What are key features of this property?
This property features: Turnkey space ready for a thriving restaurant business.; 10ft exhaust hood with fire suppression system READY TO OPERATE for a restaurant.; Landlord is highly motivated and offering significant concessions (tenant improvement allowances and rent concession for the first six months).


