Dorchester Two-Family Brick
For Sale
$975,000
Pending
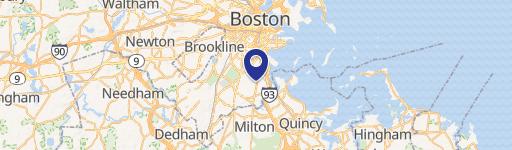
139 Selden St, Boston, MA 02124
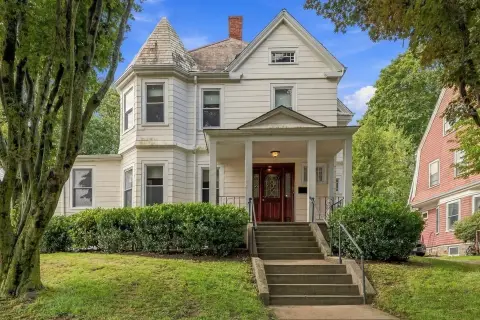
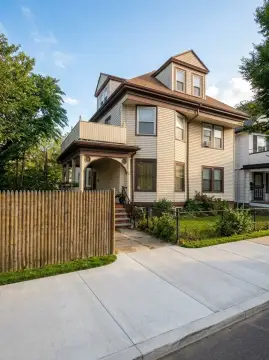
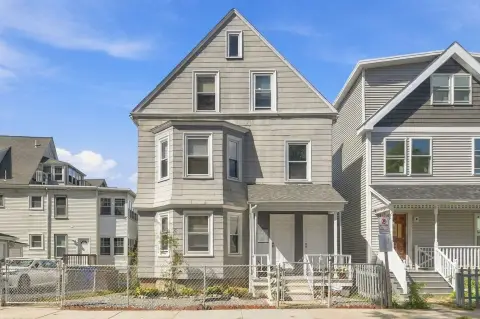
Classic two-family in Dorchester with spacious apartments and expansion potential.
Property Size3,082 SF
Days on Market550
Property Features for 139 Selden St
General Information
Standard status
Pending
Size
3,082 SF
Property subtype
Multi Family
Taxes and HOA fees
Annual Taxes
$9,237
Building Details
Year Built
1925
Listing Agency:
The Firm
(781) 924-3205
Listed By:
Thomas O'Neill Jr.
(617) 721-5966
Source:
Exitrealty
Added: Apr 19, 2025
Changed: Sep 1
Last Checked: Sep 15 at 5:51AM
Displayed information is deemed reliable but is not guaranteed and should be independently verified. All listing content including descriptions, pricing, images are the copyrighted material of The Firm

Ask AI about this property
Review the available facts, identify missing information and prepare questions for the agent.
Investment Insights
Based on property information with market context.
This classic brick two-family building is located in the heart of Dorchester. The fabulously spacious apartments feature excellent natural light and oak flooring throughout, with exceptional detail. Laundry hook-ups are available in both units. The first floor apartment includes a large, welcoming entry hall with space for a home office. The second floor unit, with 6 rooms, is air conditioned and features a granite kitchen with wood cabinets, recessed lighting, and a laundry area. Solar panels are installed to help reduce costs. The property includes a one-car garage with paved tandem parking behind it. Centrally located, the building is close to public transportation, major thoroughfares, shopping, and schools. The exterior features a brick facade, granite steps, and wrought iron fencing. The full basement includes a full bath and offers expansion potential. The property provides easy access to downtown Boston, public transportation, schools, and shopping.
Key Highlights
- Two spacious apartments with excellent natural light and oak flooring.
- Air‑conditioned 2nd‑floor unit with granite kitchen, wood cabinets, recessed lighting, and laundry area.
- Solar panels for reduced energy costs.
Financial Insights
Estimated NOI and Cap Rate
NOI / Yr
$77,880
Cap Rate
7.99%
Suggested Prices Based on Cap Rates
Cap Rate 5%
$1,557,600
$1.6M
Cap Rate 7%
$1,112,571
$1.1M
Cap Rate 9%
$865,333
$865.3K
Market Conditions
NOI Build-Up for 3,082 SF
Gross rent
$116.5K $37.80/SF
− Vacancy
−$5.2K −$1.70/SF
EGI
$111.3K $36.10/SF
− OpEx
−$33.4K −$10.83/SF
NOI
$77.9K $25.27/SF
Area
Boston, MA
Vacancy
4.50%
Lease Rate
$37.80 /SF/Yr
Expense Ratio
30.00%
Simulate Cap Rate and NOI
Suggested Prices Based on Cap Rates
Cap Rate 5%
$1,557,600
Cap Rate 7%
$1,112,571
Cap Rate 9%
$865,333
Alternative Uses
Best Use
Multifamily LT 5
$1.11M
$973.5K – $1.30M
NOI $77,880 @ 7.0% cap · market cap 7.99%
Second Best
Apartment 5plus
$1.03M
$905.0K – $1.21M
NOI $72,402 @ 7.0% cap · market cap 7.43%
Theoretical Best
Office A
$2.31M
$2.02M – $2.69M
NOI $161,546 @ 7.0% cap · market cap 16.57%
Zoning and permitted uses should be independently verified with authorities.
How Realmo checks its estimates
Property Analytics
Unlock full access to Insights
Subscribe to Realmo Intelligence
Open Analytics
Location Intelligence
Trade Area within ½ mile
1,042
Businesses Nearby
Explore this area
Business Placement
Demographics for 02124, MA
50,972
Population
21,264
Households
2.4
Avg Household Size
36
Median Age
31%
College-Educated
85%
High-School Grad
3.0 sq mi
ZIP Area
16,991
Density / Sq Mi
$79,168
Median Household Income
$43,483
Median Earnings
$1,783
Median Rent
$607,200
Median Home Value
Check the figures for this property
Cap Rate, Value Estimation, Potential NOI and more
View Realmo Analytics
Market
Vacancy Rate% for Multifamily in Northeast region



Frequently Asked Questions
What type of property is this?
Duplex - Classic two-family in Dorchester with spacious apartments and expansion potential.
Where is this duplex located?
The property is located at 139 Selden St Boston, MA.
What is the asking price?
The asking price for this property is $975,000.
What are key features of this property?
This property features: Two spacious apartments with excellent natural light and oak flooring.; Air‑conditioned 2nd‑floor unit with **granite kitchen, wood cabinets, recessed lighting, and laundry area.**; Solar panels for reduced energy costs.


