Renovated Automotive/Retail Property For
For Sale
Contact for pricing
1749 N Academy Blvd, Colorado Springs, CO
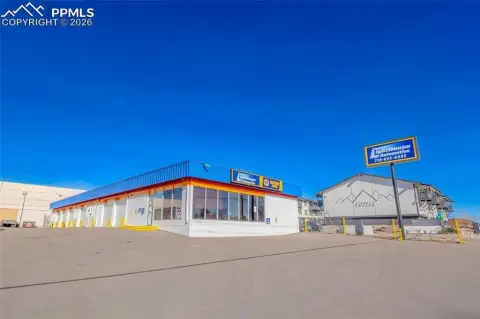
Recently renovated automotive/retail property with truck parking and high visibility.
Property Size29,915 SF
Lot Size19.43 Acres
Price / SF$125.02
Days on Market1113
Property Features for 1749 N Academy Blvd
General Information
Standard status
Active
Size
29,915 SF
Lot size
19.43 Acres
Property subtype
RETAIL
Lease Type
NNN
Properties For Sale
at 1749 N Academy Blvd
Rustic Hills Commerce Center
AVAILABLE, Completion
Floor
1
Size
29,915 SF
Type
RETAIL
Lease Type
NNN
Sublease
No
• Fully Renovated 2023
• Attractive Finishes
• High Visibility
• Convenient Access
• High Passenger Vehicle Ratio
• Truck Parking Available
• Multiple Loading
• Building Signage Available
• Professionally Managed
• Pikes Peak Enterprise Zone
• 3 drive in
•1 van-high
•14´Clear ht
Contact us
Listing Agency:
Cushman & Wakefield | Colorado Springs Commercial
(719) 634-1500
Listed By:
Aaron Horn · License #FA100007326
(719) 330-4162
Source:
Moodyscre
Added: Oct 4, 2023
Changed: Oct 8
Last Checked: Oct 19 at 6:17AM
Displayed information is deemed reliable but is not guaranteed and should be independently verified. All listing content including descriptions, pricing, images are the copyrighted material of Cushman & Wakefield | Colorado Springs Commercial

Ask AI about this property
Review the available facts, identify missing information and prepare questions for the agent.
Investment Insights
Based on property information with market context.
This renovated property, updated in 2023, offers attractive finishes and high visibility. It features convenient access and a high passenger vehicle ratio, with truck parking available. The property includes multiple loading options, building signage, and professional management. It is located within the Pikes Peak Enterprise Zone. The property features three drive-in bays, one van-high bay, and a 14-foot clear height. The property size is 29915 square feet.
Key Highlights
- Fully Renovated 2023
- Truck Parking Available
- Multiple Loading access
Financial Insights
Estimated NOI and Cap Rate
NOI / Yr
$271,459
Cap Rate
7.26%
Suggested Prices Based on Cap Rates
Cap Rate 5%
$5,429,180
$5.4M
Cap Rate 7%
$3,877,986
$3.9M
Cap Rate 9%
$3,016,211
$3.0M
Market Conditions
NOI Build-Up for 29,915 SF
Gross rent
$405.6K $13.56/SF
− Vacancy
−$17.8K −$0.60/SF
EGI
$387.8K $12.96/SF
− OpEx
−$116.3K −$3.89/SF
NOI
$271.5K $9.07/SF
Area
Colorado Springs, CO
Vacancy
4.40%
Lease Rate
$13.56 /SF/Yr
Expense Ratio
30.00%
Simulate Cap Rate and NOI
Suggested Prices Based on Cap Rates
Cap Rate 5%
$5,429,180
Cap Rate 7%
$3,877,986
Cap Rate 9%
$3,016,211
Alternative Uses
Best Use
Retail
$5.14M
$4.50M – $6.00M
NOI $359,967 @ 7.0% cap · market cap 9.62%
Second Best
Industrial
$3.88M
$3.39M – $4.52M
NOI $271,459 @ 7.0% cap · market cap 7.26%
Theoretical Best
Specialty Retail
$5.91M
$5.17M – $6.89M
NOI $413,545 @ 7.0% cap · market cap 11.06%
Zoning and permitted uses should be independently verified with authorities.
How Realmo checks its estimates
Property Analytics
Unlock full access to Insights
Subscribe to Realmo Intelligence
Open Analytics
Current Use
Location Intelligence
Trade Area within ½ mile
1,084
Businesses Nearby
70k
Monthly Visits Nearby
Well-served
Demand for This Use
Explore this area
Business Placement
Foot Traffic Nearby
Shops & Services 50%
Dining 35%
Leisure 10%
Apparel 4%
Taco Bell
Dining
13,114 visits/mo
0.4 miles
Sinclair
Shops & Services
10,198 visits/mo
0.1 miles
7-Eleven
Shops & Services
8,829 visits/mo
0.1 miles
WhirlyBall
Leisure
6,814 visits/mo
0.4 miles
U.S. Bank
Shops & Services
5,181 visits/mo
0.4 miles
Check the figures for this property
Cap Rate, Value Estimation, Potential NOI and more
View Realmo Analytics
Market
Vacancy Rate% for Retail in Colorado Springs, CO



Similar Off Market Nearby
- Drusautorepair — 1102 N Kingsley Dr, Colorado Springs, CO 80909, United States
- Drusmobileautorepair — 1102 n kingsley dr, colorado springs, co 80909
- Hoodz customs & repair llc — 1107 Bowser Dr, Colorado Springs, CO 80909
- Universal Motorsports — 1229 N Academy Blvd, Colorado Springs, CO 80909
- Goodyear Auto Service — 1303 N Academy Blvd, Colorado Springs, CO 80909
Frequently Asked Questions
What type of property is this?
Auto shop - Recently renovated automotive/retail property with truck parking and high visibility.
Where is this auto shop located?
The property is located at 1749 N Academy Blvd Colorado Springs, CO.
What is the asking price?
The asking price for this property is $3,740,000.
What are key features of this property?
This property features: Fully Renovated 2023; Truck Parking Available; Multiple Loading access


